HAL Id: inserm-00090721
https://www.hal.inserm.fr/inserm-00090721
Submitted on 1 Sep 2006
HAL is a multi-disciplinary open access
archive for the deposit and dissemination of
sci-entific research documents, whether they are
pub-lished or not. The documents may come from
teaching and research institutions in France or
abroad, or from public or private research centers.
L’archive ouverte pluridisciplinaire HAL, est
destinée au dépôt et à la diffusion de documents
scientifiques de niveau recherche, publiés ou non,
émanant des établissements d’enseignement et de
recherche français ou étrangers, des laboratoires
publics ou privés.
sizes: practical issues involving continuous outcomes.
Lydia Guittet, Philippe Ravaud, Bruno Giraudeau
To cite this version:
Lydia Guittet, Philippe Ravaud, Bruno Giraudeau. Planning a cluster randomized trial with unequal
cluster sizes: practical issues involving continuous outcomes.. BMC Medical Research Methodology,
BioMed Central, 2006, 6, pp.17. �10.1186/1471-2288-6-17�. �inserm-00090721�
Methodology
Open Access
Research article
Planning a cluster randomized trial with unequal cluster sizes:
practical issues involving continuous outcomes
Lydia Guittet
1,2, Philippe Ravaud
1,2and Bruno Giraudeau*
3,4Address: 1Département d'Epidémiologie, Biostatistique et Recherche Clinique, Groupe Hospitalier Bichat-Claude Bernard (AP-HP), Université
Xavier Bichat, Paris, France, 2INSERM U 738, Université Paris 7, Paris, France, 3INSERM CIC 202; Université François Rabelais de Tours; CHRU de
Tours, France and 4INSERM U 717, Université Paris 7, Paris, France
Email: Lydia Guittet - guittetl@free.fr; Philippe Ravaud - philippe.ravaud@bch.ap-hop-paris.fr; Bruno Giraudeau* - giraudeau@med.univ-tours.fr
* Corresponding author
Abstract
Background: Cluster randomization design is increasingly used for the evaluation of health-care,
screeening or educational interventions. At the planning stage, sample size calculations usually consider an average cluster size without taking into account any potential imbalance in cluster size. However, there may exist high discrepancies in cluster sizes.
Methods: We performed simulations to study the impact of an imbalance in cluster size on power.
We determined by simulations to which extent four methods proposed to adapt the sample size calculations to a pre-specified imbalance in cluster size could lead to adequately powered trials.
Results: We showed that an imbalance in cluster size can be of high influence on the power in the
case of severe imbalance, particularly if the number of clusters is low and/or the intraclass correlation coefficient is high. In the case of a severe imbalance, our simulations confirmed that the minimum variance weights correction of the variation inflaction factor (VIF) used in the sample size calculations has the best properties.
Conclusion: Publication of cluster sizes is important to assess the real power of the trial which
was conducted and to help designing future trials. We derived an adaptation of the VIF from the minimum variance weights correction to be used in case the imbalance can be a priori formulated such as "a proportion (γ) of clusters actually recruit a proportion (τ) of subjects to be included (γ ≤ τ)".
Background
A cluster randomized trial involves randomizing social units or clusters of individuals rather than the individuals themselves. This design, which is increasingly being used for evaluating healthcare, screening and educational inter-ventions presents specific constraints that must be consid-ered during planning and analysis [1,2]. Indeed, the responses of individuals within a cluster tend to be more
similar than those of individuals of different clusters, and we thus define the clustering effect as 1 + (m - 1)ρ, where m is the average number of subjects per cluster and ρthe intraclass correlation coefficient (ICC). This clustering effect is used during the planning of cluster randomized trials as an inflation factor to increase the sample size required by an individual randomization trial. However, such an approach does not take into account variations in Published: 12 April 2006
BMC Medical Research Methodology 2006, 6:17 doi:10.1186/1471-2288-6-17
Received: 25 October 2005 Accepted: 12 April 2006 This article is available from: http://www.biomedcentral.com/1471-2288/6/17
© 2006 Guittet et al; licensee BioMed Central Ltd.
This is an Open Access article distributed under the terms of the Creative Commons Attribution License (http://creativecommons.org/licenses/by/2.0), which permits unrestricted use, distribution, and reproduction in any medium, provided the original work is properly cited.
cluster size, which might differ greatly. Indeed, as illus-trated by Kerry et al [3], cluster size may depend on, for example, (i) the potential of recruitment of the cluster (i.e., the number of subjects belonging to each cluster), (ii) the eligible fraction of subjects, which may vary among clusters, or (iii) the ability of physicians to recruit subjects within each cluster. Such an imbalance in cluster size reduces the power of the trial and has to be taken into account in the sample size calculation.
Kerry et al [3] assessed the theoretical efficacy of 3 weight-ings of the inflation factor but in the context of cluster level analysis, so summary statistics are estimated at the cluster level and the unit of analysis remains the cluster. Manatunga et al [4], however, assessed a correction on the basis of the assumed distribution of cluster sizes in the context of marginal models, but the authors' simulations covered a range of ICCs larger than those usually observed in cluster randomized trials.
Our aim was therefore to assess these proposed correc-tions in the framework of cluster randomized trials in which the unit of analysis remains the subject, embedded in the cluster. We first describe the random effects model used to simulate clustered data; then display the simula-tion design used to evaluate the loss of power due to imbalance in cluster size and the findings. Corrections of the variance inflation factor to allow for cluster size ine-quality evaluated by simulation and robustness of these corrections to misspecification of the ICC is assessed. practical guidelines for the planning stage of cluster rand-omized trials are drawn and perspectives for future research.
Methods and results
Theoretical background
The mixed effects model
Let us supposed a continuous outcome distributed according to the following mixed-effects model:
Yijk = θi + βij + εijk (1)
where Yijk is the observed response for the kth subject in the jth cluster of the ith group, θi is the overall mean in the ith group, βij is the random effect associated with the clus-ter effect and εijk is the residual effect. The βij and εijk are assumed to be independent and normally distributed as (0; ) and (0; ) respectively.
The ICC quantifies the degree of similarity between the responses of subjects in the same cluster and is defined as the proportion of the total outcome variation between clusters:
Sample size calculations
Considering g clusters of m individuals to be randomized in each group, the total number of subject N per group is given by [2]:
where ∆ is the absolute mean difference between groups (i.e., ∆ = |θ0 - θ1|), σ2 is the total variance defined as (
+ ) and t(1 - α/2),2(g - 1) and t(1 - β),2(g - 1) is the 100 × (1
-α/2) and 100 × (1 - β) percentiles of the Student t-distri-bution with 2(g - 1) degrees of freedom. Considering the effect size, defined as the relative difference between groups (i.e., ES = |θ0 - θ1|/σ= ∆/σ), expression (3) can be
re-written as:
Impact of cluster size inequality
Simulation study
Monte Carlo simulations were used to assess the impact of imbalance in cluster size on both power and type I error. A 2 × 4 × 4 factorial plan was used, considering 2 effect sizes (0.25, 0.50) to be detected with fixed numbers of clusters (5, 10, 20, 40) and 4 a priori postulated values of the ICC (0.005, 0.02, 0.05, 0.10). The ICC values were chosen according to previously published estimates [5-15], and the number of clusters is in agreement with that from a recent review of cluster randomized trials in pri-mary care settings in which the median number of rand-omized clusters was estimated at 34 [13]. The α and β values were fixed at 0.05 and 0.20, respectively, in any case.
Once the sample size was calculated, correlated data were simulated, according to model (1). From a practical point of view, data were generated as the sum of a fixed effect (θ0
or θ1 if the control or experimental group, respectively)
and realizations of the 2 random variables βij and εijk. For convenience and without loss of generality we set θ0 equal
to 0 and ( + ) equal to 1. These constraints then allow for defining θ1 as the effect size ES, as ρand
as (1 - ρ). σb2 σw2 ρ σ σ σ = +
( )
b b w 2 2 2 2 N mg t g t g m = =2(
(− ) ( −)+(− ) ( −))
1+( −1) ( )3 2 1 2 2 1 1 2 1 2 2 σ α/ , β, ρ ∆ σb2 σw2 N t t m ES g g =2(
(1− 2 2) ( −1)+ (1− )2( −1))
1+( −1) ( )4 2 2 α/ , β , ρ σb2 σw2 σb2 σw2Cluster size
For any combination of ES, g and ρ, we simulated rand-omized trials with, on the one hand, constant cluster size and, on the other, imbalance in cluster size. In the absence of cluster sizes publications, three types of imbalance were considered:
1. A moderate imbalance:
For each group, each of the N subjects had an equiproba-bility of being in any of the g clusters randomized in this group. From a practical point of view, for any of the N subjects, we randomly selected with equiprobability the cluster to which it belongs, before adding the appropriate realizations of random variables βij and εijk.
2. A "Pareto" imbalance
Following the economic Pareto's principle, we considered the situation in which 80% of the subjects actually belong to only 20% of the clusters. From a practical point of view, we thus defined 2 strata within each group: the strata of large clusters (e.g., 20% of the g clusters) and the strata of small clusters. Eighty percent of the N subjects were in the large cluster strata, while the 20% remaining were in the small cluster strata. Then, within each stratum, subjects were randomly assigned with equiprobability to one of the clusters.
3. A Poisson imbalance
Cluster sizes were finally defined according to a Poisson distribution, which has already been used in such a con-text [16,17]. We thus considered a Poisson distribution with parameter m defined as N/g and defined the cluster size of any cluster before generating the associated obser-vations.
In this latter situation, and contrary to the 2 previous ones, the total number of patients per group varies and is equal to N only on average. Moreover, in the 3 types of cluster size inequality, the actual number of clusters per group could be smaller than g, because clusters could be empty.
For any combination of ES, g and ICC, and for any situa-tion (balance or any type of imbalance in cluster size), 5000 replications of data were simulated by use of SAS 8.1 software.
Analysis
Data analysis involved no stratification on cluster size. We used the MIXED procedure in SAS [18,19] to assess restricted maximum likelihood (REML) estimates of vari-ance components. The Wald test statistic was then used to
test the significance of the intervention effect with the Stu-dent t-distribution, with g0+g1-2 degrees of freedom as the
reference distribution, where g0 and g1 are the actual
num-bers of nonempty clusters in the control and intervention groups, respectively.
The empirical type I error and power were calculated as the proportion of significant trials (defined as a p value smaller than the nominal α level) when θ1 equals 0 and
ES, respectively.
Results
Results are expressed as absolute bias and mean square error on the one hand, and empirical' type I error and power on the other. Table 1 displays the results associated with an a priori postulated effect size of 0.25, while Table 2 displays the results associated with a 0.50 effect size. In 7 situations, data sets could not be generated for the fol-lowing combinations ES/ICC/g: 0.25/0.020/5, 0.25/ 0.050/5, 0.25/0.050/10, 0.25/0.100/5, 0.25/0.100/10, 0.25/0.100/20 and 0.50/0.100/5. Indeed, when the number of clusters is small and/or the ICC high, even an infinite cluster size may not allow for achieving 80% power [20].
No significant bias was induced by inequality in cluster size (since the relative bias was no more than about 1.5%, in absolute value), while the mean square error was barely increased in cases of severe imbalance (Pareto imbal-ance).
When the number of clusters is small, type I errors were estimated at a lower level than the nominal one, even with no imbalance in cluster sizes. A symmetrical result was also observed for power, which was estimated at a lower level than the nominal one. This result was of greater mag-nitude for small ICCs and for greater effect size, which cor-responded to situations in which the total number of subjects to be included is reduced. Otherwise, although moderate and Poisson imbalances were of no influence, a Pareto's imbalance was associated with an increase in both type I and type II errors. As an example, if one is will-ing to detect a 0.25 effect size and plan a randomized trial with 10 clusters per arm with an a priori postulated ICC of 0.02, a Pareto imbalance leads to type I and type II errors of 9% and 38%, respectively, and nominal values fixed at 5% and 20%. This result is of greater magnitude for large ICCs and a small number of clusters.
Thus, while moderate imbalances (based on an equiprob-ability hypothesis) and Poisson's imbalances can be neglected at the planning stage, a more severe imbalance (such as the Pareto's imbalance) should be taken into account, thus leading to an adjustment in sample size cal-culations.
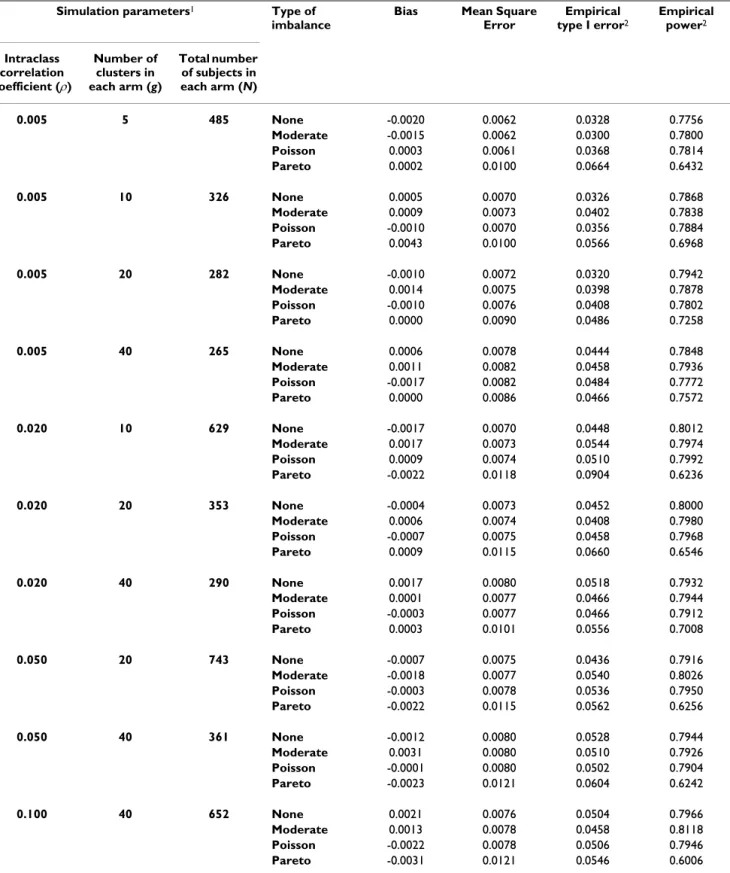
Table 1: Bias, mean square error, empirical type I error and power in cluster randomized trials according to several types of imbalance in cluster size – Effect size = 0.25
Simulation parameters1 Type of
imbalance
Bias Mean Square Error Empirical type I error2 Empirical power2 Intraclass correlation coefficient (ρ) Number of clusters in each arm (g) Total number of subjects in each arm (N) 0.005 5 485 None -0.0020 0.0062 0.0328 0.7756 Moderate -0.0015 0.0062 0.0300 0.7800 Poisson 0.0003 0.0061 0.0368 0.7814 Pareto 0.0002 0.0100 0.0664 0.6432 0.005 10 326 None 0.0005 0.0070 0.0326 0.7868 Moderate 0.0009 0.0073 0.0402 0.7838 Poisson -0.0010 0.0070 0.0356 0.7884 Pareto 0.0043 0.0100 0.0566 0.6968 0.005 20 282 None -0.0010 0.0072 0.0320 0.7942 Moderate 0.0014 0.0075 0.0398 0.7878 Poisson -0.0010 0.0076 0.0408 0.7802 Pareto 0.0000 0.0090 0.0486 0.7258 0.005 40 265 None 0.0006 0.0078 0.0444 0.7848 Moderate 0.0011 0.0082 0.0458 0.7936 Poisson -0.0017 0.0082 0.0484 0.7772 Pareto 0.0000 0.0086 0.0466 0.7572 0.020 10 629 None -0.0017 0.0070 0.0448 0.8012 Moderate 0.0017 0.0073 0.0544 0.7974 Poisson 0.0009 0.0074 0.0510 0.7992 Pareto -0.0022 0.0118 0.0904 0.6236 0.020 20 353 None -0.0004 0.0073 0.0452 0.8000 Moderate 0.0006 0.0074 0.0408 0.7980 Poisson -0.0007 0.0075 0.0458 0.7968 Pareto 0.0009 0.0115 0.0660 0.6546 0.020 40 290 None 0.0017 0.0080 0.0518 0.7932 Moderate 0.0001 0.0077 0.0466 0.7944 Poisson -0.0003 0.0077 0.0466 0.7912 Pareto 0.0003 0.0101 0.0556 0.7008 0.050 20 743 None -0.0007 0.0075 0.0436 0.7916 Moderate -0.0018 0.0077 0.0540 0.8026 Poisson -0.0003 0.0078 0.0536 0.7950 Pareto -0.0022 0.0115 0.0562 0.6256 0.050 40 361 None -0.0012 0.0080 0.0528 0.7944 Moderate 0.0031 0.0080 0.0510 0.7926 Poisson -0.0001 0.0080 0.0502 0.7904 Pareto -0.0023 0.0121 0.0604 0.6242 0.100 40 652 None 0.0021 0.0076 0.0504 0.7966 Moderate 0.0013 0.0078 0.0458 0.8118 Poisson -0.0022 0.0078 0.0506 0.7946 Pareto -0.0031 0.0121 0.0546 0.6006
1N is the number of subjects per intervention arm, calculated under the assumption of constant cluster size 2 The nominal values for type I and type II error rates were fixed at 0.05 and 0.20, respectively.
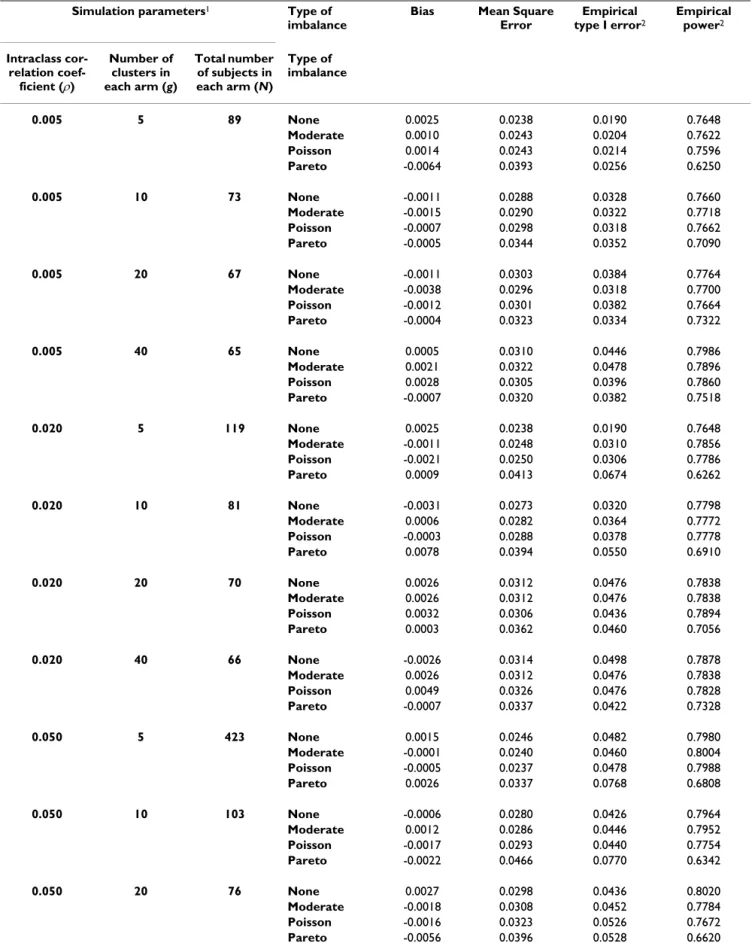
Table 2: Bias, mean square error, empirical type I error and power in cluster randomized trials according to several types of imbalance in cluster size – Effect size = 0.50
Simulation parameters1 Type of
imbalance
Bias Mean Square Error Empirical type I error2 Empirical power2 Intraclass cor-relation coef-ficient (ρ) Number of clusters in each arm (g) Total number of subjects in each arm (N) Type of imbalance 0.005 5 89 None 0.0025 0.0238 0.0190 0.7648 Moderate 0.0010 0.0243 0.0204 0.7622 Poisson 0.0014 0.0243 0.0214 0.7596 Pareto -0.0064 0.0393 0.0256 0.6250 0.005 10 73 None -0.0011 0.0288 0.0328 0.7660 Moderate -0.0015 0.0290 0.0322 0.7718 Poisson -0.0007 0.0298 0.0318 0.7662 Pareto -0.0005 0.0344 0.0352 0.7090 0.005 20 67 None -0.0011 0.0303 0.0384 0.7764 Moderate -0.0038 0.0296 0.0318 0.7700 Poisson -0.0012 0.0301 0.0382 0.7664 Pareto -0.0004 0.0323 0.0334 0.7322 0.005 40 65 None 0.0005 0.0310 0.0446 0.7986 Moderate 0.0021 0.0322 0.0478 0.7896 Poisson 0.0028 0.0305 0.0396 0.7860 Pareto -0.0007 0.0320 0.0382 0.7518 0.020 5 119 None 0.0025 0.0238 0.0190 0.7648 Moderate -0.0011 0.0248 0.0310 0.7856 Poisson -0.0021 0.0250 0.0306 0.7786 Pareto 0.0009 0.0413 0.0674 0.6262 0.020 10 81 None -0.0031 0.0273 0.0320 0.7798 Moderate 0.0006 0.0282 0.0364 0.7772 Poisson -0.0003 0.0288 0.0378 0.7778 Pareto 0.0078 0.0394 0.0550 0.6910 0.020 20 70 None 0.0026 0.0312 0.0476 0.7838 Moderate 0.0026 0.0312 0.0476 0.7838 Poisson 0.0032 0.0306 0.0436 0.7894 Pareto 0.0003 0.0362 0.0460 0.7056 0.020 40 66 None -0.0026 0.0314 0.0498 0.7878 Moderate 0.0026 0.0312 0.0476 0.7838 Poisson 0.0049 0.0326 0.0476 0.7828 Pareto -0.0007 0.0337 0.0422 0.7328 0.050 5 423 None 0.0015 0.0246 0.0482 0.7980 Moderate -0.0001 0.0240 0.0460 0.8004 Poisson -0.0005 0.0237 0.0478 0.7988 Pareto 0.0026 0.0337 0.0768 0.6808 0.050 10 103 None -0.0006 0.0280 0.0426 0.7964 Moderate 0.0012 0.0286 0.0446 0.7952 Poisson -0.0017 0.0293 0.0440 0.7754 Pareto -0.0022 0.0466 0.0770 0.6342 0.050 20 76 None 0.0027 0.0298 0.0436 0.8020 Moderate -0.0018 0.0308 0.0452 0.7784 Poisson -0.0016 0.0323 0.0526 0.7672 Pareto -0.0056 0.0396 0.0528 0.6620
Sample size adjustment for unbalanced trials
Adjusted variance inflation factors
The (1 + (m - 1)ρ) factor in expressions (3) and (4) defines the variance inflation factor (VIF) that takes into account the correlation induced by the cluster randomization. This VIF supposes a constant cluster size (m) or is based on the average cluster size in case of imbalance. Kerry et al [3] and Manatunga et al [4] proposed to adjust the VIF in cases of an imbalance in cluster size. Thus, we propose 4 correc-tions. The first 3 are based on weights derived from the a priori postulated distribution of cluster sizes among the g clusters (i.e., the different values of mj, where mj is the size of the jth cluster), and the fourth is based on the expected
mean and variance of this latter distribution. 1. Equal weights (denoted w1)[3]:
where
2. Cluster size weights (denoted w2)[3]:
where
3. Minimum variance weights (denoted w3) [3]:
4. Distribution-based correction (denoted d) [4]:
where E(m) and var(m) are the expected mean and the var-iance of the cluster size.
We considered these 4 adjustments when a Pareto's imbalance is a priori supposed to be observed. Since mod-erate imbalances have been shown to be of no influence, we assumed a constant cluster size within each stratum associated with the Pareto's imbalance. The adjusted VIF then becomes (Appendix A):
with and T = t(1 - α/2),2(g - 1) + t(1 - β),2(g - 1) VIF m g m m w j j g 1 1 1 1 =
(
−)
+ =∑
ρ ρ m gj mj g = =∑
1 1 VIFw2 = +1 (mA−1)ρ m m m A j j g j j g = = =∑
∑
2 1 1 VIF mg m m w j j j g 3 1 1 1 = +(
−)
=∑
ρ VIF E m m E m d = +( )
+( )
( )
− 1 1 2 var ρ VIFw1 =3 25. +(
mw1−3 25.)
ρ( )
5 m T gES T w1 6 5 1 2 2 2 2 =(
−)
− . ρ ρ VIFw2 = +1(
3 25. mw2 −1)
ρ( )
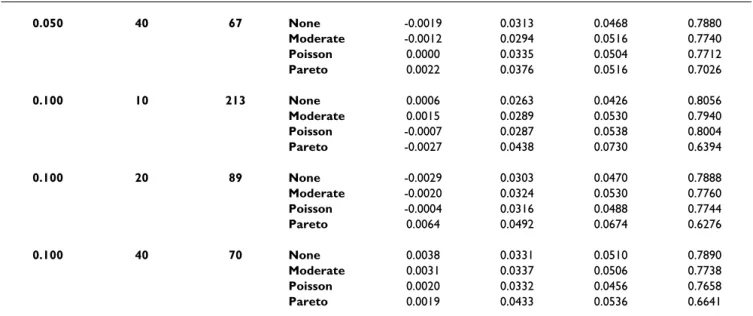
6 0.050 40 67 None -0.0019 0.0313 0.0468 0.7880 Moderate -0.0012 0.0294 0.0516 0.7740 Poisson 0.0000 0.0335 0.0504 0.7712 Pareto 0.0022 0.0376 0.0516 0.7026 0.100 10 213 None 0.0006 0.0263 0.0426 0.8056 Moderate 0.0015 0.0289 0.0530 0.7940 Poisson -0.0007 0.0287 0.0538 0.8004 Pareto -0.0027 0.0438 0.0730 0.6394 0.100 20 89 None -0.0029 0.0303 0.0470 0.7888 Moderate -0.0020 0.0324 0.0530 0.7760 Poisson -0.0004 0.0316 0.0488 0.7744 Pareto 0.0064 0.0492 0.0674 0.6276 0.100 40 70 None 0.0038 0.0331 0.0510 0.7890 Moderate 0.0031 0.0337 0.0506 0.7738 Poisson 0.0020 0.0332 0.0456 0.7658 Pareto 0.0019 0.0433 0.0536 0.66411N is the number of subjects per intervention arm, calculated under the assumption of constant cluster size 2 The nominal values for type I and type II error rates were fixed at 0.05 and 0.20, respectively.
Table 2: Bias, mean square error, empirical type I error and power in cluster randomized trials according to several types of imbalance in cluster size – Effect size = 0.50 (Continued)
with
with being the positive solution of the following equation:
with
The distribution-based and cluster size weights correction are equivalent [21]. We therefore no longer consider the distribution-based correction and focus on the 3 weighted corrections proposed by Kerry et al [3].
Simulation study
Monte Carlo simulations were performed to determine to what extent the proposed corrections could lead to ade-quately powered trials. We thus calculated the sample size needed assuming a Pareto repartition, using each of the adjusted VIFs. For each situation, we then simulated clus-ter randomized trials with a Pareto imbalance to estimate
empirical type I error and power. The same approach as that explained in the preceeding was used.
Results
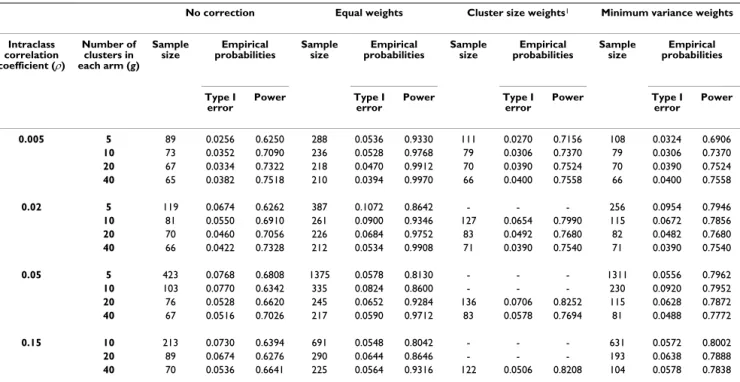
Results are displayed in Tables 3 and 4 for effect sizes of 0.25 and 0.50, respectively. For the cluster size weights correction, several situations existed in which the sample size calculations showed that 80% power could not be reached, thus preventing the generation of associated data sets. If sample size calculations were possible, this correc-tion led to sample sizes barely greater than the sample size obtained with the minimal variance weights correction and empirical type I error and power near the nominal value. This result is consistent for the different values of ES, ρand g in Tables 3 and 4, except for the combination 0.25/0.02/20. Actually, for fixed values of ES, couples of values for (g, ρ) lead to null values of the denominator of mw2. If ES is fixed at 0.25, the couple (20, 0.0233) is one
of these. For ρjust under this critical value (0.020 in our case), mw2 begins to diverge, and when ρis greater, mw2
can no longer be calculated. Equal weights correction led to a much greater sample size than minimum variance weights, particularly when the ICC is small, and the empirical power obtained was therefore much higher than its nominal value: it may even reach 99% if the nominal value were fixed at 80%. The minimum variance weights correction required the smallest increase in sample size and resulted in the smallest difference between empirical and nominal power. Empirical type I errors were also near the nominal 5% level, except when both the number of clusters and the ICC are small.
m T gES T w2 2 1 6 5 2 2 2 =
(
−)
− ρ ρ . VIF m m m w w w w 3 3 3 3 1 4 1 1 0 25 1 1 1 7 =(
+(
−)
)
(
+(
−)
)
+(
−)
( )
ρ ρ ρ . mw3 mw gES T mw gES T T 3 3 2 ρ 2−2ρ 2 1 ρ 2 8 5ρ 2 2 1 ρ 2 2 0 + ( − ) − . − ( − ) = VIFd = +1[
3 25. md−1]
ρ( )
8 m T gES T d = −(
)
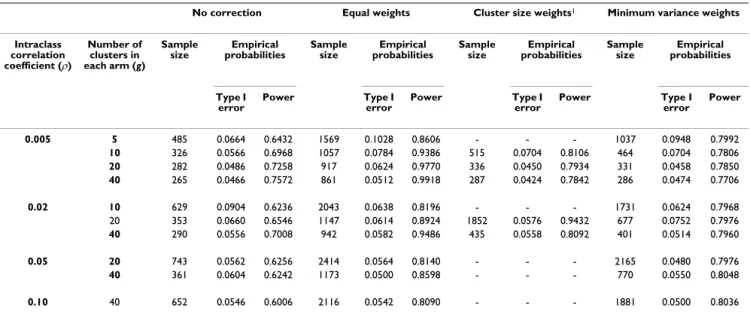
− 2 1 6 5 2 2 2 ρ ρ .Table 3: Required sample size and empirical Type I error and power when using corrected variance inflation factors with an a priori hypothesized Pareto imbalance in cluster size – Effect size = 0.25
No correction Equal weights Cluster size weights1 Minimum variance weights
Intraclass correlation coefficient (ρ) Number of clusters in each arm (g) Sample
size probabilitiesEmpirical Sample size probabilitiesEmpirical Sample size probabilitiesEmpirical Sample size probabilitiesEmpirical
Type I error Power Type I error Power Type I error Power Type I error Power 0.005 5 485 0.0664 0.6432 1569 0.1028 0.8606 - - - 1037 0.0948 0.7992 10 326 0.0566 0.6968 1057 0.0784 0.9386 515 0.0704 0.8106 464 0.0704 0.7806 20 282 0.0486 0.7258 917 0.0624 0.9770 336 0.0450 0.7934 331 0.0458 0.7850 40 265 0.0466 0.7572 861 0.0512 0.9918 287 0.0424 0.7842 286 0.0474 0.7706 0.02 10 629 0.0904 0.6236 2043 0.0638 0.8196 - - - 1731 0.0624 0.7968 20 353 0.0660 0.6546 1147 0.0614 0.8924 1852 0.0576 0.9432 677 0.0752 0.7976 40 290 0.0556 0.7008 942 0.0582 0.9486 435 0.0558 0.8092 401 0.0514 0.7960 0.05 20 743 0.0562 0.6256 2414 0.0564 0.8140 - - - 2165 0.0480 0.7976 40 361 0.0604 0.6242 1173 0.0500 0.8598 - - - 770 0.0550 0.8048 0.10 40 652 0.0546 0.6006 2116 0.0542 0.8090 - - - 1881 0.0500 0.8036 Sample size calculations were performed considering type I and type II error rates fixed at 0.05 and 0.20, respectively.
Robustness of sample size adjustment for unbalanced trials with misspecification of the ICC
Method
We assessed the robustness of the different sample size adjustments for Pareto-like unbalanced trials with mis-specification of the ICC. We considered an effect size of 0.25, a priori postulated ICCs of 0.005 and 0.020 and the combinations of number of clusters and cluster sizes pre-viously used (see sample sizes in Table 3). Then, for each weighting method, (i.e., for each total number of subjects of each arm Nw1, Nw2, Nw3) we plotted the expected power
calculated for a pre-specified ICC as a function of the real ICC (which will be a posteriori assessed). This power was calculated by use of the variance inflation factor VIFw3
derived from minimum variance weights, because it allows for calculating an expected power that does not dif-fer from the empirical one by more than 3.8% in the situ-ations explored in Table 3 (data not shown). For reference, we also plotted the expected power (calculated with the usual VIF) as a function of the real ICC in cases of no imbalance in cluster size.
Results
Results are displayed in Figures 1 and 2 for an effect size of 0.25 and a priori postulated ICC values of 0.005 and 0.020, respectively. As expected [20], in any situation, the power decreases as the ICC increases, and this result is all the more important when the number of clusters is low. In the planning situations explored, minimum variance
weights and cluster size weights curves are very close, except when 20 clusters per intervention arm are rand-omized and the ICC is a priori fixed at 0.020, but this latter situation is extreme, as discussed previously. Otherwise, the power associated with equal weights remains greater than that associated with minimum variance weights in any situation. However, this finding probably just reflects that the use of this weighting system leads to higher required sample sizes than the use of a minimum variance weights system (cf Tables 3 and 4) and therefore higher power. In any case, imbalance in cluster size is associated with a higher sensitivity to the a priori-specified ICC than constant cluster size. For example, let us consider the case of 20 clusters per intervention arm: if the ICC is a priori postulated at 0.005, but in reality equals 0.015, the power associated with constant cluster size decreases from 0.80 to 0.75 only, whereas the power associated with Pareto repartition decreases from 0.80 to 0.68 (with the mini-mum variance weighting system). However, all weighting systems show great sensitivity to the actual value of the ICC. Consider the former example (ES = 0.25, g = 20 and Pareto repartition, increase in ICC from 0.005 to 0.015), the power associated with equal weights will decrease from 0.98 to 0.90, and the power associated with cluster size weights from 0.80 to 0.68. Thus, if little prior knowl-edge is available concerning the value of the ICC, the sen-sitivity analysis involving several values of ICC is of major importance, particularly when imbalance in cluster size is expected.
Table 4: Required sample size and empirical Type I error and power when using corrected variance inflation factors with an a priori hypothesized Pareto imbalance in cluster size – Effect size = 0.50
No correction Equal weights Cluster size weights1 Minimum variance weights
Intraclass correlation coefficient (ρ) Number of clusters in each arm (g) Sample
size probabilitiesEmpirical Sample size probabilitiesEmpirical Sample size probabilitiesEmpirical Sample size probabilitiesEmpirical
Type I error Power Type I error Power Type I error Power Type I error Power 0.005 5 89 0.0256 0.6250 288 0.0536 0.9330 111 0.0270 0.7156 108 0.0324 0.6906 10 73 0.0352 0.7090 236 0.0528 0.9768 79 0.0306 0.7370 79 0.0306 0.7370 20 67 0.0334 0.7322 218 0.0470 0.9912 70 0.0390 0.7524 70 0.0390 0.7524 40 65 0.0382 0.7518 210 0.0394 0.9970 66 0.0400 0.7558 66 0.0400 0.7558 0.02 5 119 0.0674 0.6262 387 0.1072 0.8642 - - - 256 0.0954 0.7946 10 81 0.0550 0.6910 261 0.0900 0.9346 127 0.0654 0.7990 115 0.0672 0.7856 20 70 0.0460 0.7056 226 0.0684 0.9752 83 0.0492 0.7680 82 0.0482 0.7680 40 66 0.0422 0.7328 212 0.0534 0.9908 71 0.0390 0.7540 71 0.0390 0.7540 0.05 5 423 0.0768 0.6808 1375 0.0578 0.8130 - - - 1311 0.0556 0.7962 10 103 0.0770 0.6342 335 0.0824 0.8600 - - - 230 0.0920 0.7952 20 76 0.0528 0.6620 245 0.0652 0.9284 136 0.0706 0.8252 115 0.0628 0.7872 40 67 0.0516 0.7026 217 0.0590 0.9712 83 0.0578 0.7694 81 0.0488 0.7772 0.15 10 213 0.0730 0.6394 691 0.0548 0.8042 - - - 631 0.0572 0.8002 20 89 0.0674 0.6276 290 0.0644 0.8646 - - - 193 0.0638 0.7888 40 70 0.0536 0.6641 225 0.0564 0.9316 122 0.0506 0.8208 104 0.0578 0.7838
Practical implications
General considerations
Cluster size inequality may induce a loss of power and must be taken into account at the planning stage by using the minimum variance weights correction. From a practi-cal point of view, 2 situations must be distinguished. First, when entire clusters are randomized such as in cluster-cluster trials [22]. the cluster-cluster size distribution is a priori known and cluster size inequalities are therefore easy to be taken into account at the planning stage. Second, if physicians have to recruit patients to each cluster accord-ing to selection criteria, cluster size distribution cannot a priori be known. In this latter situation, a sensitivity anal-ysis must be performed considering several hypotheses on cluster size distribution for an optimal sample size deter-mination.
Adaptation of the VIF for a Pareto like imbalance
Let us assume that the cluster size inequality corresponds to a Pareto-like distribution, say that in each arm a pro-portion (γ) of clusters actually recruit the proportion (τ) of patients to be recruited (which implies γ≤ τ). If γand τ
are fixed at 20% and 80%, respectively, we have the Pareto imbalance defined previously; if γ and τ are equal, the cluster size imbalance is absent or moderate (and can then be neglected). The sensitivity analysis then consists of var-ying the parameters (γ) and (τ), thus allowing for imbal-ance increases with the absolute difference between the 2 values. The inflation factor calculated with the minimum variance weights correction will be the following (Appen-dix B):
To illustrate the discrepancy between nominal and real power if an imbalance of the form "γ clusters actually recruit τpatients" is not taken into account, we performed the following calculations. We used formula (4) (i.e., assuming a constant cluster size) to derive the number of subjects needed. Then, using expression (9), we calculated the expected power with such a sample size, with a pro-VIF m m m = + − − − + − + − − 1 1 1 1 1 1 1 1 1 τ γ ρ τ γ ρ τ τ γ −− +( − ) + − ( ) 1 1 1 1 9 ρ τ τ γm ρ
Real power of cluster randomized trials according to the discrepancy between the a priori postulated and a posteriori estimated intraclass correlation coefficients (ICCs)
Figure 1
Real power of cluster randomized trials according to the discrepancy between the a priori postulated and a posteriori estimated intraclass correlation coefficients (ICCs). The ICC is a priori postulated at 0.005 and sample sizes (N) and associated powers were calculated: 1°) assuming Pareto repartition of cluster sizes and using 3 corrections of the variance inflation factor (equal weights, cluster size weights and minimum variance weights), 2°) assuming constant cluster size (reference).
5 clusters per intervention arm
(Nw1=1569, Nw3=1037, Nc=485) 0 0.1 0.2 0.3 0.4 0.5 0.6 0.7 0.8 0.9 1 0 0.01 0.02 0.03 0.04 0.05 0.06 0.07 0.08 0.09 0.1 A posteriori ICC Pow e r
10 clusters per intervention arm
(Nw1=1057, Nw2=515, Nw3=464, Nc=326) 0 0.1 0.2 0.3 0.4 0.5 0.6 0.7 0.8 0.9 1 0 0.01 0.02 0.03 0.04 0.05 0.06 0.07 0.08 0.09 0.1 A posteriori ICC Po w e r
20 clusters per intervention arm
(Nw1=917, Nw2=336, Nw3=331, Nc=282) 0 0.1 0.2 0.3 0.4 0.5 0.6 0.7 0.8 0.9 1 0 0.01 0.02 0.03 0.04 0.05 0.06 0.07 0.08 0.09 0.1 A posteriori ICC Pow e r
4 0 clus t er s per in t er ven t ion ar m 0
1
0 0 . 0 1 0 . 0 2 0 . 0 3 0 . 0 4 0 . 0 5 0 . 0 6 0 . 0 7 0 . 0 8 0 . 0 9 0 . 1 A pos t er ior i I CC
Equal weights Cluster size weights Minimum variance weights Ref: constant size
(Nw1) (Nw2)
(Nw3) (Nc)
40 clusters per intervention arm
(Nw1=861, Nw2=287, Nw3=286, Nc=265) 0 0.1 0.2 0.3 0.4 0.5 0.6 0.7 0.8 0.9 1 0 0.01 0.02 0.03 0.04 0.05 0.06 0.07 0.08 0.09 0.1 A posteriori ICC Po w e r
portion of γclusters actually recruiting a proportion τof the patients to be included.
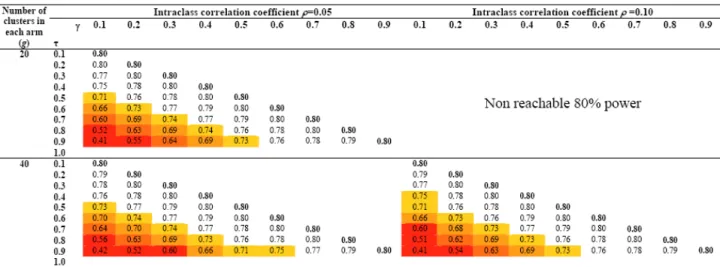
Figures 3 and 4 display the results for several combina-tions of ES/ICC/g and γ/τ under the assumption of no empty cluster. The upper part of Figures 3 and 4 is empty, since an 80% power cannot be reach for the associated combinations of ICC and g. Moreover, γis smaller than or equal to τ, which explains why any upper part of matrices associated with an ICC/g combination is empty. As expected, the bigger the cluster size inequality, the more important the discrepancy between nominal and real power. For example, let us consider a trial aimed at detect-ing a 0.25 effect size in which 10 clusters are to be rand-omized in each arm. Assuming an ICC of 0.005 and a balance in cluster size, this study would require 326 sub-jects to be recruited in each arm to reach 80% power. If 10% of the clusters recruit 50% of the subjects, the power barely declines, to 77%; if a major imbalance such as 90% of the patients are to be recruited by 10% of the clusters, the power would fall to 54%. The latter phenomenon is all the more acute with a low number of clusters; critical
situations in which a substantial loss in power may be expected are displayed in Figures 3 and 4. Red levels approximately follow diagonals representing constant τ-γ differences. It can be shown (appendix C) that the gini coefficient, a quantitative measure of site accrual inequal-ity [23], comes down to the absolute difference between τ and γ when a proportion γ of clusters actually recruit a proportion τof patients to be recruited. Our results show that varying this summary measure of imbalance is enough for performing a sensitivity analysis and that there is no need to specify both τand γ.
Assigning a value of 1 to τcreates a situation in which a proportion (1-γ) of clusters is empty. In this situation achieving the required sample size supposes to increase the average cluster size of the γg clusters by a factor 1/γ. However one has to be aware that such a strategy will indeed allow achieving the pre-specified sample size, but it will not allow to reach the nominal power. Indeed it is known that for a fixed total number of subjects, the higher the number of clusters, the higher the power [1] which means that reducing the number of clusters will translate Real power of cluster randomized trials according to the discrepancy between the a priori postulated and a posteriori estimated intraclass correlation coefficients (ICCs)
Figure 2
Real power of cluster randomized trials according to the discrepancy between the a priori postulated and a posteriori estimated intraclass correlation coefficients (ICCs). The ICC is a priori postulated at 0.020 and sample sizes (N) and associated powers were calculated: 1°) assuming Pareto repartition of cluster sizes and using 3 corrections of the variance inflation factor (equal weights, cluster size weights and minimum variance weights), 2°) assuming constant cluster size (reference).
4 0 clus t er s per in t er ven t ion ar m 0
1
0 0 . 0 1 0 . 0 2 0 . 0 3 0 . 0 4 0 . 0 5 0 . 0 6 0 . 0 7 0 . 0 8 0 . 0 9 0 . 1 A pos t er ior i I CC
Equal weights Cluster size weights Minimum variance weights Ref: constant size
10 clusters per intervention arm
(Nw1=2043, Nw3=1731, Nc=629) 0 0.1 0.2 0.3 0.4 0.5 0.6 0.7 0.8 0.9 1 0 0.01 0.02 0.03 0.04 0.05 0.06 0.07 0.08 0.09 0.1 A posteriori ICC Po w e r
20 clusters per intervention arm
(Nw1=1147, Nw2=1852, Nw3=677, Nc=353) 0 0.1 0.2 0.3 0.4 0.5 0.6 0.7 0.8 0.9 1 0 0.01 0.02 0.03 0.04 0.05 0.06 0.07 0.08 0.09 0.1 A posteriori ICC Po w e r
40 clusters per intervention arm
(Nw1=212, Nw2=71, Nw3=71, Nc=66) 0 0.1 0.2 0.3 0.4 0.5 0.6 0.7 0.8 0.9 1 0 0.01 0.02 0.03 0.04 0.05 0.06 0.07 0.08 0.09 0.1 A posteriori ICC Po we r (Nw1) (Nw2) (Nw3) (Nc)
in a loss in power even if the pre-specified sample size is achieved. Therefore, in case it is anticipated that empty clusters may occur, sensitivity analyses have to be con-ducted using formula (4) on the basis of the hypothesized number of active clusters g' = γg.
Discussion
A moderate inequality in cluster sizes has little effect on power and can thus be neglected at the planning stage. However, a major imbalance in cluster sizes, like the "Pareto" imbalance, (i.e. 80% of the subjects belong to only 20% of the clusters) is associated with a loss in power, and the phenomenon is all the more important when the number of clusters is low and/or the ICC is high. In these situations, the minimum variance weights correc-tion has good properties and allows for achieving the
nominal power. This result, obtained in the extreme situ-ation of a Pareto imbalance, suggests that this correction can be used to derive sample size or power in any situa-tion where, in each group, cluster sizes can be separated in two strata, the small cluster stratum and the big cluster stratum. The higher sensitivity of severely unbalanced tri-als to the a priori-postulated value of the ICC compared to that of balanced trials emphasized the necessity of a sen-sitivity analysis on this parameter. We derived an adapta-tion of the VIF, which should be used when the imbalance is a priori hypothesized to be "a proportion of γclusters will actually recruit a proportion τ of the subjects to be included".
A limit to this approach remains the degree of imbalance being usually difficult to foresee at the planning stage, Power of cluster randomized trials if an imbalance in cluster size is not taken into account when planning
Figure 3
Power of cluster randomized trials if an imbalance in cluster size is not taken into account when planning. The imbalance is a priori hypothesized to be "a proportion of γ clusters will actually recruit a proportion τ of the subjects to be included" (γ≤ τ) – The intraclass correlation coefficient is fixed at 0.005 and 0.02.
except when, for instance, families or practices are rand-omized and clusters as a whole are included in the trial. In these latter situations, one may a priori know precisely the cluster size repartition and therefore use the minimum variance weights correction as initially specified by Kerry et al [3]. However, if, within each cluster, the physician has to recruit patients to be included in the trial, cluster size distribution may then be difficult to hypothesize. It is all the more difficult since cluster sizes are usually not reported in published clustered randomized trials. We therefore proposed to consider that cluster sizes distribu-tion can be divided in each arm in two strata: a stratum of small clusters, and another of large clusters. This hypoth-esis may be debatable. However, since a moderate ine-quality of cluster size is of minor effect, it seems a rather useful and simple way to consider the risk of cluster size inequality at the planning stage, particularly since no
pre-cise data on cluster size inequality are available. Another limitation is that our work focused on normally distrib-uted continuous outcomes. More work is needed to extend our results to non-normal distributions, especially with binary variables. Finally, we restricted our work to cases of no differential recruitment between arms, thus considering that imbalance is the same in the two arms. Such a hypothesis may be questionable in cluster rand-omized trials: since inclusion is posterior to randomiza-tion, this may indeed induce differential recruitment and imbalance in patient characteristics, which may lead to questioning the results of the study [24].
Table 6: Number of clusters by intervention arm Number of patients belonging to the clusters
Mean cluster size
Small clusters (1-γ)g (1 - τ) g Big clusters γg τ g m 1 1 − − τ γ m m τ γ m Power of cluster randomized trials if an imbalance in cluster size is not taken into account when planning
Figure 4
Power of cluster randomized trials if an imbalance in cluster size is not taken into account when planning. The imbalance is a priori hypothesized to be "a proportion of γ clusters will actually recruit a proportion τ of the subjects to be included" (γ≤ τ) – The intraclass correlation coefficient is fixed at 0.05 and 0.10.
Table 5: Number of clusters by intervention arm Number of patients belonging to the clusters
Mean cluster size
Small clusters 0.8g 0.2 g (0.2 g)/(0.8g) = 0.25 Big clusters 0.2g 0.8 g (0.8 g)/(0.2g) = 4 m m m m m m
Conclusion
In conclusion, our study demonstrates that severely imbalanced trials with continuous outcomes may be highly underpowered. If such imbalance in cluster size can be anticipated at the design stage, minimum variance weights correction should be used to inflate the required sample size. A priori estimation of the expectable imbal-ance would be facilitated if more details on cluster sizes were given in published cluster randomized trials, as was recently advised in the extension of the CONSORT state-ment for cluster randomized trials [25]. Moreover, such publication of cluster sizes would be of particular interest to assess the real power of the trial conducted.
Competing interests
The author(s) declare that they have no competing inter-ests.
Authors' contributions
This study was designed by LG, BG and PR. LG performed the statistical analysis and drafted the article, which was then revised by BG and PR.
Appendix A: corrected variance inflation factor
(VIF) for an a priori postulated Pareto imbalance
Four corrections have been proposed for adjusting sample size in cases of imbalance in cluster size. Considering the specific situation of a Pareto imbalance, the general form of these corrections can be simplified.
Characteristics of the Pareto imbalance
g refers to the number of clusters within each arm and is the average cluster size
Equal weights (denoted w1) [3]
With an equal weights correction, the VIF is expressed as:
where
With a Pareto imbalance, this equation is expressed as:
where (the average cluster size for which an equal weights correction is used) is defined as:
which leads to :
where ES refers to the effect size and T = t(1 - α/2),2(g - 1) + t(1 - β),2(g - 1)
Cluster size weights (denoted w2) [3]
where
With a Pareto imbalance, we can write the equation as:
So the VIF is reduced to:
and
Minimum variance weights (denoted w3) [3]
With a Pareto imbalance, the equation can be written as:
m VIF m g m m w j j g 1 1 1 1 =
(
−)
+ =∑
ρ ρ m gj mj g = =∑
1 1 VIF m g g m g m m m w w w w w w 1 1 1 1 1 1 0 8 0 25 0 2 4 1 = + (
−)
+ − . . . ρ ρ = 3.25 +(
33 25.)
ρ mw1 m g T ES m w1 w1 2 3 25 3 25 2 2 = . +(
− .)
ρ m T gES T w1 6 5 1 2 2 2 2 =(
−)
− . , ρ ρ VIFw2 = +1 (mA−1)ρ m m m A j j g j j g = = =∑
∑
2 1 1 m g m g m m g m A w w w w =0 8(
0 25 2)
+0 2(
4 2)
=3 25 2 2 2 2 . . . . VIFw2 = +1(
3 25. mw2 −1)
ρ( )
6 m T gES T w2 2 1 6 5 2 2 2 =(
−)
− ρ ρ . VIF mg m m w j j j g 3 1 1 1 = +(
−)
=∑
ρ VIF m g g m m g m m w w w w w w 3 3 3 3 3 3 0 8 0 25 1 0 25 1 0 2 4 1 4 1 1 = +(
−)
+ +(
−)
= + . . . ρ . ρ 4 4 1 1 0 25 1 1 1 3 3 3 m m m w w w −(
)
(
)
(
+(
−)
)
+(
−)
ρ ρ ρ .with
which leads to being the positive solution of the fol-lowing equation:
Distribution-based correction (denoted d) [4]
So we have:
with
that is to say:
One then recognizes the results obtained using the cluster size weights correction.
Appendix B: minimum variance
weights-corrected variance inflation factor (VIF) for an a
priori postulated Pareto-like imbalance
Characteristics of the Pareto-like imbalance
g refers to the number of clusters within each arm and is the average cluster size
Minimum variance weighs VIF
So we obtain:
Appendix C: gini coefficient for an a priori
postulated Pareto-like imbalance
Given the characteristics of the Pareto-like imbalance pre-sented in appendix B, considering that clusters are ordered hierarchically by increasing size, the matrix of the differ-ence |mi - mj| can be written as:
Where 0(γg,γg) and 0((1-γ)g,(1-γ)g) are squared matrices of size
γg and (1-γ)g respectively and 1(γg,(1-γ)g) and 1((1-γ)g,γg) are
matices of size γg × (1-γ)g and (1-γ)g × γg respectively, con-taining only 1 s.
Thus:
Acknowledgements
The work was funded by a grant from the Foundation for Medical research (FRM). m g T ES m m m w w w w 3 3 3 3 2 1 4 1 1 0 25 1 1 1 2 2 =
(
+(
−)
)
(
+(
−)
)
+(
−)
ρ ρ ρ . mw3 mw3 gES T mw3 gES T T 2 2 2 2 2 2 2 2 1 8 5 2 1 0 ρ − ρ + ( −ρ) − . ρ − ( −ρ) = VIF E m m E m d = +( )
+( )
( )
− 1 1 2 var ρ var . . . . m g m g m g m g m g d d d d ( )= ( ) + ( ) −(
( )+ ( ))
0 8 0 25 2 0 2 4 2 0 8 0 25 0 2 4 2 gg md = 2 25. 2 VIF m m m m d d d d d = + + − −[
]
1 2 25 1 1 2 . 2 ρ ρ = 1 + 3.25 m g T ES m d = +(
d−)
2 1 3 25 1 2 2 . ρ m T gES T d = −(
)
− 2 1 6 5 2 2 2 ρ ρ . m VIF mg m m mg g m m w j j j g 3 1 1 1 1 1 1 1 1 1 1 = +(
−)
= −(
)
− − + − − − =∑
ρ γ τ γ τ γ ρ ++ + − γ τ γ τ γ ρ g m m 1 1 VIF m m m = + − − − + − + − − 1 1 1 1 1 1 1 1 1 τ γ ρ τ γ ρ τ τ γ −− +(
−)
+ − 1 ρ 1 τ 1 τ 1 γ m ρ gini g m j mi mj g i g = − = =∑
∑
1 2 2 1 1 M g g g g g g = − −(
)
− −(
)
( )(
( − ))
− ( )(
)
( − ) 0 1 1 1 1 0 1 1 1 γ γ γ γ γ γ γ τ γ γ γ τ γ γ γ , , ,(
gg, 1−( )g)
γ gini g m g m gini =(
−)
− −(
)
= − 1 2 2 2 1 1 2γ γ τ γ γ γ τ γPublish with BioMed Central and every scientist can read your work free of charge "BioMed Central will be the most significant development for disseminating the results of biomedical researc h in our lifetime."
Sir Paul Nurse, Cancer Research UK
Your research papers will be:
available free of charge to the entire biomedical community peer reviewed and published immediately upon acceptance cited in PubMed and archived on PubMed Central yours — you keep the copyright
Submit your manuscript here:
http://www.biomedcentral.com/info/publishing_adv.asp
BioMedcentral
References
1. Murray DM: Design and Analysis of Group-Randomized Trials Oxford University Press: New York; 1998.
2. Donner A, Klar N: Design and Analysis of Cluster Randomization Trials in Health Research Arnold: London; 2000.
3. Kerry SM, Bland JM: Unequal cluster sizes for trials in English and Welsh general practice: implications for sample size cal-culations. Stat Med 2001, 20:377-390.
4. Manatunga AK, Hudgens MG, Chen S: Sample size estimation in cluster randomized studies with varying cluster size. Biomet-rical Journal 2001, 1:75-86.
5. Hannan PJ, Murray DM, Jacobs DR, McGovern PG: Parameters to aid in the design and analysis of community trials: intraclass correlations from the Minnesota Heart Health Program. Epi-demiology 1994, 5:88-95.
6. Martinson BC, Murray DM, Jeffery RW, Hennrikus DJ: Intraclass correlation for measures from a worksite health promotion study: estimates, correlates, and applications. Am J Health Pro-mot 1999, 13:347-357.
7. Murray DM, Short BJ: Intraclass correlation among measures related to tobacco use by adolescents: estimates, correlates, and applications in intervention studies. Addict Behav 1997, 22:1-12.
8. Murray DM, Clark MH, Alexander CW: Intraclass correlation from a community-based alcohol prevention study: the effect of repeat observations on the same communities. J Stud Alcohol 2000, 61:881-90.
9. Murray DM, Phillips GA, Bimbaum AS, Lytle LA: Intraclass correla-tion for measures from a middle school nutricorrela-tion interven-tion study: estimates, correlates, and applicainterven-tions. Health Educ Behav 2001, 28:666-679.
10. Siddiqui O, Hedeker D, Flay BR, Hu FB: Intraclass correlation esti-mates in a school-based smoking prevention study. Am J Epi-demiol 1996, 144:425-433.
11. Smeeth L, Siu-Woon NgE: Intraclass correlation coefficients for cluster randomized trials in primary care: data from the MRC Trial of the Assessment and Management of Older People in the Community. Control Clin Trials 2002, 23:409-421. 12. Reading R, Harvey I, McLean M: Cluster randomised trials in
maternal and child health: implications for power and sam-ple size. Arch Dis Child 2000, 82:79-83.
13. Eldridge SM, Ashby D, Feder GS, Rudnicka AR, Ukoumunne OC: Les-sons for cluster randomized trials in the twenty-first century: a systematic review of trials in primary care. Clinical Trials 2004, 1:80-90.
14. Ukoumunne OC, Gulliford MC, Chinn C, Sterne JAC, Burney PGJ: Methods for evaluating area-wide and organisation-based interventions in health and health care: a systematic review. Health Technol Assess 1999, 3:iii-92.
15. Gulliford MC, Adams G, Ukoumunne OC, Latinovic R, Chinn S, Campbell MJ: Intraclass correlation coefficient and outcome prevalence are associated in clustered binary data. J Clin Epi-demiol 2005, 58:246-251.
16. Ukoumunne OC: A comparison of confidence interval meth-ods for the intraclass correlation coefficient in cluster rand-omized trials. Stat Med 2002, 21:3757-3774.
17. Bellamy SL, Gibberd R, Hancock L, Howley P, Kennedy B, Klar N, Lip-sitz S: Analysis of dichotomous outcome data for community intervention studies. Stat Methods Med Res 2000, 9:135-159. 18. Verbeke G, Molenberghs G: Linear Mixed Models in Practice. A SAS
Ori-ented Approach Springer-Verlag: New York; 1997.
19. Littell RC, Milliken GA, Stroup WW, Wolfinger RD: SAS System for Mixed Models BBU Press: Cary; 1996.
20. Guittet L, Giraudeau B, Ravaud P: A priori postulated and real power in cluster randomized trials: mind the gap. BMC Med Res Methodol 2005, 5:25.
21. Lake S, Kammann E, Klar N, Betensky R: Sample size re-estima-tion in cluster randomizare-estima-tion trials. Stat Med 2002, 21:1337-1350.
22. Edwards SJ, Braunholtz DA, Lilford RJ, Stevens AJ: Ethical issues in the design and conduct of cluster randomised controlled tri-als. BMJ 1999, 318:1407-1409.
23. Haidich AB, Ioannidis JPA: The Gini coefficient as a measure for understanding accrual inequalities in multicenter clinical tri-als. J Clin Epidemiol 2004, 57:341-8.
24. Puffer S, Torgerson D, Watson J: Evidence for risk of bias in clus-ter randomised trials: review of recent trials published in three medical journals. BMJ 2003, 327:785-789.
25. Campbell MK, Elbourne DR, Altman DG: CONSORT statement: extension to cluster randomised trials. BMJ 2004, 328:702-708.
Pre-publication history
The pre-publication history for this paper can be accessed here: