HAL Id: hal-02921636
https://hal.archives-ouvertes.fr/hal-02921636
Submitted on 2 Sep 2020
HAL is a multi-disciplinary open access
archive for the deposit and dissemination of
sci-entific research documents, whether they are
pub-lished or not. The documents may come from
teaching and research institutions in France or
abroad, or from public or private research centers.
L’archive ouverte pluridisciplinaire HAL, est
destinée au dépôt et à la diffusion de documents
scientifiques de niveau recherche, publiés ou non,
émanant des établissements d’enseignement et de
recherche français ou étrangers, des laboratoires
publics ou privés.
spectrum of methyl isocyanate
Oliver Harper, Laurent Coudert, Bérenger Gans, Stephane Douin, Séverine
Boyé-Péronne, Jean-Christophe Loison, Gustavo Garcia, Jean-Claude
Guillemin
To cite this version:
Oliver Harper, Laurent Coudert, Bérenger Gans, Stephane Douin, Séverine Boyé-Péronne, et al..
Quasi-symmetry effects in the threshold photoelectron spectrum of methyl isocyanate. Journal of
Chemical Physics, American Institute of Physics, 2020, 153 (7), pp.074308. �10.1063/5.0017753�.
�hal-02921636�
Oliver J. Harper, Laurent H. Coudert,∗ B´erenger Gans, St´ephane Douin, and S´everine Boy´e-P´eronne
Universit´e Paris-Saclay, CNRS, Institut des Sciences Mol´eculaires d’Orsay, 91405, Orsay, France
Jean-Christophe Loison
Institut des Sciences Mol´eculaires, UMR 5255 CNRS - Universit´e de Bordeaux, Bˆat. A12, 351 Cours de la Lib´eration, F-33405 Talence cedex, France
Gustavo A. Garcia
L’Orme des Merisiers, Saint Aubin BP 48, Synchrotron SOLEIL, Gif sur Yvette, France
Jean-Claude Guillemin
Univ. Rennes, Ecole Nationale Sup´erieure de Chimie de Rennes, CNRS, ISCR-UMR6226, F-35000 Rennes, France
(Dated: September 2, 2020)
The vacuum-ultraviolet threshold photoelectron spectrum of methyl isocyanate CH3NCO has
been recorded from 10.4 to 12 eV using synchrotron radiation and a coincidence technique allowing for a mass-discrimination of the photoelectron signal. A significant improvement is achieved over previous investigations as this experimental setup leads to a much more resolved spectrum. Ten sharp peaks and a broad feature spanning 1.2 eV were recorded. This spectrum consists of the
˜
X+ 2A00← ˜X1A0and ˜A+ 2A0← ˜X1A0ionizing transitions. For the former, the adiabatic ionization energy was determined experimentally to be 10.596(6) eV; for the latter its value was estimated to be 10.759(50) eV. Seven sharp peaks could be assigned to vibrational modes of the cation ˜X+ 2A00and neutral ˜X1A0 ground electronic states involving only the NCO group atoms. Theoretical modeling of the threshold photoelectron spectrum has proven difficult as methyl isocyanate is a non-rigid molecule displaying large amplitude internal rotation of the methyl group and ∠CNC bending mode, leading to the quasi-symmetry. With the help of ab initio calculations, a theoretical model in which these two large amplitude motions are included in addition to the five small amplitude vibrational modes involving NCO group atoms is proposed. Comparison with the experimental spectrum shows that the broad feature and the strongest peaks line positions are well accounted for; their intensities are also fairly well reproduced after adjusting a few parameters.
I. INTRODUCTION
Methyl isocyanate (CH3NCO) is a reactive chemical compound1 which is an intermediate in the industrial production of carbamate. It is widely used in the syn-thesis of rubbers, adhesives and pesticides, and was the main toxicant associated with the Bhopal disaster. Its ground electronic state is spectroscopically well charac-terized as it is a benchmark molecule for quasi-symmetric species. Such species, of the WH3XYZ type, display two large amplitude motions, the WH3 torsion and ∠WXY bending mode, leading to a singularity at the symmetri-cal C3v configuration. Dedicated theoretical treatments developed to evaluate the rotation-bending-torsion en-ergy levels of such species2–11were applied to the analysis of the microwave spectrum of methyl isothiocyanate3,12 (CH3NCS), silyl isocyanate5,7 (SiH
3NCO), and methyl isocyanate.8,12–14 For the latter species, nearly 400 tran-sitions could be assigned leading to its detection in the interstellar space medium.14,15 It was then believed to be one of the most abundant molecules after water and
∗laurent.coudert@u-psud.fr
formamide on the surface of the comet 67P/Churyumov-Gerasimenko,16but this was later disputed.17
In order to further investigate the effects of quasi-symmetry, spectroscopic investigations of the infrared spectrum of methyl isocyanate18,19 were carried out and the two low energy vibrations corresponding to the large amplitude methyl group torsion and ∠CNC bending mode were observed. The photoabsorption cross sec-tion and fluorescence excitasec-tion spectra were measured by Tokue et al.20 in the 105–210 nm range, and three Rydberg series were assigned with their vibrational pro-gressions. This analysis provided a value of the ioniza-tion energy of 10.674 eV. Above the ionizaioniza-tion energy (IE), fewer laboratory experiments have been performed and little information is currently available on the cation CH3NCO
+
. Photoelectron spectra were recorded21,22 with a He I lamp with a typical resolution of 15 meV. From 10 to 18 eV, seven bands were observed and un-ambiguously assigned in terms of NCO group orbitals. The two lowest lying bands, in the 10.4 to 12 eV energy range, display distinct spectroscopic features and the first vertical ionization energy was measured22 at 10.63 eV. No attempts were made to understand the photoelectron spectrum in this energy range accounting for the quasi-symmetry effects.
In the present work, the experimental threshold pho-toelectron spectrum (TPES) of methyl isocyanate has been recorded from 10.4 to 12 eV using synchrotron radiation. This spectrum, characterized by a better resolution than those previously reported,21,22 displays several sharp lines and a broad feature. It has been modeled with two theoretical treatments accounting for quasi-symmetry effects. In the first treatment, only the two large amplitude motions are considered.2,3,5,7–11 In the second one, making use of the harmonic adiabatic approximation,23,24 the previous treatment is extended to include small amplitude vibrational modes. In agree-ment with Eland,25 only the five small amplitude vibra-tional modes involving the NCO group are included be-cause this group undergoes the largest structural changes upon ionization.
The paper has four remaining sections. In Section II, the experimental setup and results are described. Sec-tion III reports on the calculaSec-tion of the bending-torsion and vibration-bending-torsion energy levels. Section IV deals with the simulated TPES and comparisons with the experimental one. Section V is the conclusion.
II. EXPERIMENTAL
A. CH3NCO TPES and photoion yield recording
Methyl isocyanate was prepared with a modified ver-sion of the synthesis of Han et al.26 as reported in Mat´e et al.27 A few grams of the sample were placed in a vial attached to the experiment. The vial was plunged into a chiller set at −40◦C to lower the vapor pressure to around 10−1 mbar, which was otherwise 280 mbar at 0◦C. This step was necessary to avoid too great a build-up of the sample in the experiment which could lead to polymerization or blockages, but also to limit the consumption of the sample. Maintaining the sample at a constant temperature also provided pressure stabil-ity. The gaseous molecules were fed into the SAPHIRS endstation28 through a nozzle 30 µm in diameter. The beam was then doubly skimmed and irradiated at a right angle by the tunable synchrotron VUV radiation from the DESIRS beamline29 at the French national synchrotron facility SOLEIL. The spectral purity of the photons was ensured by a gas filter located upstream from the beam-line monochromator and filled with argon.30 Argon ab-sorption lines appearing in the ion yield were used to cal-ibrate the photon energy scale. All experimental spectra are corrected by the photon flux, which was monitored as a function of the photon energy with an Si photodiode (AXUV, IRD).
After the photoionization of the neutral species by the monochromatized synchrotron radiation, the result-ing photoelectrons and photoions were analyzed with the DELICIOUS III spectrometer.31 The photoion yield (PIY) of CH3NCO+(m/q = 57 a.m.u) was recorded with a photon resolution of 5 meV using a 177 V/cm
extrac-tion field to ensure that all ions associated with electrons possessing a kinetic energy up to 7 eV were collected.
The TPES spectrum was obtained using the slow pho-toelectron spectroscopy (SPES) technique,32 in which electrons whose kinetic energy is less than 5 meV are taken into account. The total resolution (electron + pho-ton) was 8 meV (65 cm−1) and the absolute accuracy of the energy scale was found to be 3.2 meV. Note that the 53 V/cm DC field used to extract the photoelectrons re-sulted in a field-induced shift33 of the ionization energy of about −5.4 meV. Hence all ionization energies given in the following sections are corrected from the field-induced shift. The final absolute accuracy on ionization threshold measurements was about 6 meV.
B. Experimental results
Figure 1 displays the TPES of CH3NCO and the PIY of CH3NCO
+
, recorded from 10.4 to 12 eV. The PIY dis-plays a sharp rise around 10.6 eV followed by a smooth increase. It then plateaus and even slightly decreases from roughly 11.5 eV. This energy coincides with the ap-pearance of other fragments in the mass spectrum. The strongest signal appearing around 12 eV is the m/q = 56 a.m.u. fragment, which is assigned to CH2NCO+ pro-duced via dissociative ionization of the parent molecule through loss of H. The m/q = 57 a.m.u. ion yield does not present any observable autoionization features, hence the intensities of the TPES peaks are probably not affected by resonant autoionization signals.
The TPES consists of the X˜+ 2A00 ← X˜1A0 and ˜
A+ 2A0 ← ˜X1A0 ionizing transitions,21,22 where ˜X1A0, ˜
X+ 2A00, and ˜A+ 2A0 are the neutral ground electronic state and the cation ground and first excited electronic states, respectively. As shown in Fig. 1, the experimen-tal TPES displays a broad feature, from 10.6 to 11.8 eV, and 10 sharp peaks. Their Stark-shift corrected ioniza-tion energies are given in Table I; peak # 2 at 10.596 eV is the strongest. For this peak, the ionization energy measured by Pasinszki et al.22 with conventional photo-electron spectroscopy is 10.630(15) eV which is 34 meV higher. Assuming that the remaining peaks are the first members of a vibrational Franck-Condon progres-sion, they were tentatively assigned to vibrational modes of the neutral species and cation ˜X+ 2A00 ground elec-tronic state. These assignments, given in Table I, are corroborated by the calculated vibrational frequencies of Section III C. We can see that observed and calculated fundamental vibrational frequencies are at most within 93 cm−1. For ν01, ν20, and ν30, Pasinszki et al.22 reported experimental values of 2150, 1290, and 800 cm−1 which differ from the present experimental values.
Figure 1. The experimental TPES of the ˜X+ 2A00← ˜X1A0 and ˜A+ 2A0
← ˜X1A0
ionizing transitions of methyl isocyanate and the PIY signal are plotted as function of the photon en-ergy in the lower and upper panels, respectively. For the TPES, vertical lines indicate the position of the 10 strongest sharp peaks numbered from 1 to 10.
III. THE MODELS
In the present investigation, the harmonic adiabatic approximation is used.23,24 The internal coordinates qi consist of n active large amplitude coordinates with 1 ≤ i ≤ n and of m inactive small amplitude coordi-nates with n + 1 ≤ i ≤ n + m. These coordicoordi-nates are chosen in this section and, with the help of ab initio cal-culations, Eqs. (4a) and (4b) of Lauvergnat et al.23 are solved allowing us to retrieve qieq(qj) the equilibrium val-ues of the inactive coordinates as functions of the active coordinates. The Hessian matrix, also retrieved from ab initio calculations, is parameterized with the active coor-dinates. This second step leads to the normal modes and fundamental frequencies describing the harmonic oscilla-tor energy levels associated with the inactive coordinates. The anharmonic potential is then obtained, also from ab initio results. These numerical results allow us to re-trieve energy levels for the neutral and the cation using two different theoretical approaches.
A. Ab initio calculation results
There are 15 internal coordinates in methyl isocyanate which are defined in Table II. Coordinates qi, with 3 ≤ i ≤ 6 and 8 ≤ i ≤ 13, are expressed in terms of bond lengths, bond angles, and dihedral angles using the atom labeling of Fig. 2. Coordinate q7= θ is the out-of-plane bending angle of the NO direction with respect to the CαNC plane.34,35 Coordinates q1 = τ , q2= ρ, q14 = β1,
Table I. Peak energya and assignment
Peak # E/eV ∆E/cm−1 Assignmentb ˜ν(Cal)/cm−1
1 10.521 −604 ν400 621c 2 10.596 0 3 10.648 420 4 10.665 555 ν40 541 5 10.719 986 ν30 920d 6 10.743 1186 7 10.767 1374 ν20 1338d 8 10.846 2011 ν10 2104d 9 10.898 2430 2ν20 2658 10 11.015 3376
aThe Stark-shift corrected ionization energy is given in the
column headed E; the relative energy with respect to the main peak, peak # 2, is given in the column headed ∆E.
bAssignment in terms of the vibrational modes defined in
Section III C is given in this column; calculated frequency in the column headed ˜ν. A prime (double prime) denotes a vibrational mode of the cation (neutral species) ground electronic state.
cThis peak is a hot band originating from an excited vibrational
state of the neutral species.
dFor ν0
1, ν20, and ν30, the observed values reported in Ref.22are
2150, 1290, and 800 cm−1, respectively.
and q15= β2 are four angles:
τ = (α1+ α2+ α3− π)/3, ρ = π − ∠CαNC, β1= 2α1− α2− α3, β2= α2− α3,
(1)
where αi is the dihedral angle ∠CNCαHi for hydrogen atom Hi. Equations (1) emphasize that τ and ρ corre-spond respectively to the internal rotation of the methyl group and to the ∠CαNC bending mode. Irrespective of τ , the angles β1 and β2 parameterize the distortion of the methyl group from C3vsymmetry. For an undistorted methyl group β1 is 0 and β2 is either 120◦ or 240◦. Co-ordinates q1= τ and q2 = ρ are chosen as the active co-ordinates; the remaining coordinates qi, with 3 ≤ i ≤ 15, are the inactive coordinates.
The ab initio calculations were performed using the CCSD(T) (Coupled-Cluster with Single and Double and perturbative Triple excitations) method explicitly correlated (RCCSD(T)-F12) using the MOLPRO 2012 package36 and the Dunning augmented triple zeta ba-sis (AVTZ). Still using the same method, RCCSD(T)-F12/AVTZ, various sets of calculations have been per-formed to compute the potential energy surfaces (PES) of ˜X1A0, ˜X+ 2A00, and ˜A+ 2A0 states in reduced coordi-nates so as to determine the parameters needed to ana-lyze the spectra. These PES are the bending potential energy curves as a function of the CαNC bending angle, where all other parameters were optimized, the vibra-tional frequencies being calculated at each angle value. For several values of this bending angle, the Hessian has also been calculated to obtain Wilson’s F matrix.34 Fi-nally, the bending-torsion potential of the CH3group was
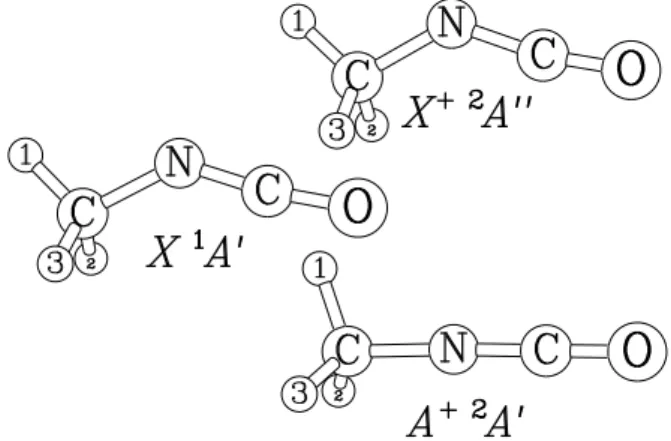
Figure 2. Atom labeling in methyl isocyanate. The numbers 1, 2, and 3 identify the three hydrogen atoms of the methyl group, its carbon atom being labeled Cα. τ and ρ are the
two active large amplitude coordinates corresponding to the internal rotation of the methyl group and the ∠CαNC bending
mode. The molecule fixed xyz axis system is shown. For clarity its origin is not drawn at the molecular center of mass. The AB axis bisects the ∠CαNC angle and is parallel to the
x axis.
calculated again by optimizing all other parameters in-cluding the Cα−H bonds.
1. Equilibrium structures
The equilibrium structures of the neutral and the cationic species were determined in the first set of ab ini-tio calculaini-tions. The 3 equilibrium structures are drawn in Fig. 3. Equilibrium values for the internal coordinates are given in Table II where, in the case of the neutral, they are compared to those retrieved from the analysis of the microwave spectrum.8For the neutral species and the cation electronic ground states, a Csbent structure arises with hydrogen atom H1in the symmetry plane and point-ing away from the NCO group. The value of β2indicates that the methyl group is distorted from C3v symmetry, especially for the cation ˜X+ 2A00 state. For the neutral ground state, the agreement with the experimental equi-librium values8 is better than 1% except for the angles q2= ρ and q6 = ∠NCO. For the cation ˜A+ 2A0 state, a nearly linear structure with almost C3vsymmetry arises. The value of β2 indicates a more distorted methyl group than in the two previous cases.
2. Determination of qeqi (τ, ρ)
The equilibrium values of the 13 inactive coordinates are approximated with analytical expansions Fi(τ, ρ) compatible with the symmetry of the molecule and de-pending on the two active coordinates τ and ρ:
qeqi (τ, ρ) ≈ Fi(τ, ρ) = q0i + n X j=1 gij(τ ) ρj, (2) where q0 i is the value of q eq
i for the ρ = 0, C3v con-figuration and gi
j(τ ) is a Fourier-type expansion. The values of q0
i and the expansions gij(τ ) can be found in
Figure 3. The equilibrium structures obtained in Sec-tion III A 1 for the neutral ˜X1A0electronic ground state and the cation ˜X+ 2A00and ˜A+ 2A0 lowest electronic states.
Eqs. (A1)–(A6). The Fi(τ, ρ) expansions were numeri-cally retrieved from the second set of ab initio calcula-tions in which ρ was constrained to several values ranging from 0.1◦ to 80◦. Convergence, however, could only be attained for one τ -value. For the neutral species and the cation ground states, results are only available for τ = 0; for the cation ˜A+ 2A0 excited electronic state, only for τ = 60◦. These two τ values being (within ±2π/3) those characterizing the corresponding equilibrium configuration in Table II. This prevents us from retrieving the τ -dependence of the expansions in Eq. (2) and we were led to use simplified expansions Fi(ρ) with no τ -dependence. These expansions are expressed in terms of fitted param-eters fi
j. For the three bond lengths qi, with 3 ≤ i ≤ 5, Fi(ρ) is an even function of ρ:
Fi(ρ) = qi0+ n X j=1
fjiρ2j. (3)
For the bond angle q6 = ∠NCO and the angle q15= β2, there is no parity restriction:
Fi(ρ) = qi0+ n X j=1
fjiρj. (4)
For the angles q7 = θ and q14 = β1, there is no ρ-dependence and Fi(ρ) = q0i. For the 6 coordinates qi, with 8 ≤ i ≤ 13, parameterizing the methyl group, Eq. (4) can be used. For the three bond lengths qi, with 8 ≤ i ≤ 10, the relations f8
j = fj9= fj10, for j even, and f8
j = −fj9= −fj10, for j odd, hold. Similar relations are fulfilled by the three bond angles qi, with 11 ≤ i ≤ 13.
The fit of the ab initio data showed that the inactive coordinates qi, with 8 ≤ i ≤ 15, describing the methyl group, display little dependence on the angle ρ. A larger dependence was observed for the inactive coordinates qi, with 3 ≤ i ≤ 7, describing the NCO group. Figures 4 and 5 show the results of the fitting for two such coordinates, q3 = r(CN) and q6 = ∠NCO. It can be seen that the
Table II. Expressionsaand equilibrium valuesbof the internal coordinates for the ground electronic state of the neutral and the two lowest electronic states of the cationic species.
˜
X1A0 ˜
X+ 2A00 ˜
A+ 2A0
Coordinates This work Ref.8
q1= τ 0.0 0.0 0.0 180.1 q2= ρ 44.3 39.8 48.1 1.9 q3= r(CN) 1.206 1.207 1.263 1.209 q4= r(CO) 1.176 1.171 1.145 1.165 q5= r(CαN) 1.447 1.434 1.436 1.417 q6= ∠NCO 172.9 180.0 170.4 179.8 q7= θ 0.0 0.0 0.0 0.0 q8= r(CαH1) 1.088 1.091 1.085 1.107 q9= r(CαH2) 1.091 1.091 1.102 1.091 q10= r(CαH3) 1.091 1.091 1.102 1.091 q11= ∠NCαH1 108.5 108.4 108.6 104.8 q12= ∠NCαH2 110.6 110.0 108.4 109.6 q13= ∠NCαH3 110.6 110.0 108.4 109.6 q14= β1 0.0 0.0 0.0 0.0 q15= β2 121.4 120.7 115.0 233.0 a Internal coordinates are defined with the atom labeling of
Fig. 2. τ , ρ, β1, and β2are 4 angles defined in Eqs. (1); θ is the
out-of-plane bending angle of the oxygen atom.34,35 bBond lengths are in ˚A and angles in degrees.
Figure 4. Variations with the active large amplitude coordi-nate ρ of the bond length r(CN) for the neutral ˜X1A0ground electronic state and the cation ˜X+ 2A00and ˜A+ 2A0electronic states. Ab initio values are indicated by dots. Solid lines are fitted values calculated with Eq. (3).
ab initio results are well reproduced by the expansions in Eqs. (3) and (4).
3. Normal modes and vibrational frequencies
The F G method34was utilized to derive normal modes and fundamental vibrational frequencies from the har-monic expansion of the potential energy. Cartesian co-ordinates of the Hessian matrix were extracted from the third set of ab initio calculations allowing us to obtain Wilson’s F matrix. Due to the limited set of data, its τ -dependence was ignored and a cubic spline interpolation
Figure 5. Variations with the active large amplitude coordi-nate ρ of the bond angle ∠NCO for the neutral ˜X1A0
ground electronic state and the cation ˜X+ 2A00and ˜A+ 2A0 electronic states. Ab initio values are indicated by dots. Solid lines are fitted values calculated with Eq. (4).
was used to obtain its ρ-dependence. Care was taken to have the correct behavior near the ρ = 0, C3v configura-tion.
As stressed in the introduction, the F G method was applied to a reduced set of inactive coordinates. The 5 selected coordinates qi are those with 3 ≤ i ≤ 7, in-volving NCO group atoms.25A B(ρ) matrix34was calcu-lated using Section III A 2 leading to a 5 × 5 G(ρ) matrix. Solving the vibrational problem leads to normal modes, fundamental vibrational frequencies νn(ρ), and an L(ρ) matrix. The latter relates the normal coordinates Qn to the internal coordinates by qi− qieq(ρ) =P
nLi,n(ρ)Qn. The wavefunction of the harmonic oscillators, depending parametrically on the active coordinate ρ, is written:
Ψn(Q; ρ), (5)
where the subscripted n is a shorthand notation for the 5 vibrational quantum numbers n1, . . . , n5. For the cation
˜
A+ 2A0state, Fig. 6 shows the variations of the five funda-mental frequencies with ρ. There are four A0 vibrational modes νn, with 1 ≤ n ≤ 4, corresponding respectively to νa(NCO) the antisymmetrical stretch, νs(NCO) the symmetrical stretch, the Cα−N stretch, and the in-plane ∠NCO bend. The only A00 vibrational mode ν5 corre-sponds to the out-of-plane ∠NCO bend. Near ρ = 0, Fig. 6 shows that ˜ν4 and ˜ν5 become close to each other as they correlate to a doubly degenerate vibrational mode in the C3v configuration.
4. Anharmonic potential
The anharmonic potential is the part of the poten-tial depending only on the active coordinates. In agree-ment with previous investigations of quasi-symmetric top molecules,7–9 we take:
V0(τ, ρ) = Vb(ρ) − 12V30ρ cos 3τ, (6) where Vb(ρ) is the pure bending potential and the term 1
2V 0
3ρ cos 3τ , involving the parameter V30, is a 3-fold tor-sional potential with a ρ-dependent barrier equal to ρV0
Figure 6. For the cation ˜A+ 2A0 electronic state, variations with ρ of the five fundamental frequencies ˜νn(ρ), with 1 ≤ n ≤
5. Each curve is identified by n. See text for a description of the inactive coordinates used.
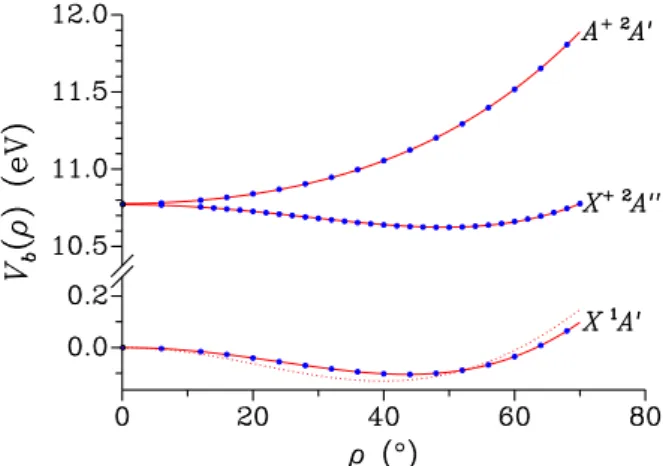
The pure bending potentials were determined in the last set of ab initio calculations where the zero-point energy was included. The ab initio energies were fitted to the expansion in Eq. (3). Figure 7 shows the variations with ρ of the bending potentials obtained for the neutral and the cationic species. The bending potential retrieved for the neutral from the analysis of the microwave spectrum8 is also shown. Figure 7 is consistent with the results in Section III A 1 for the equilibrium ρ-values. In agree-ment with Cradock et al.21 and Pasinszki et al.,22 this figure also shows that the ˜X+ 2A00and ˜A+ 2A0electronic states of the cationic species become degenerate for the ρ = 0, C3v configuration. The barriers to linearity ex-tracted from this last set of ab initio calculations are 841 and 1181 cm−1 for the neutral and the cationic species, respectively. For the neutral species, the barrier to lin-earity is smaller than that obtained from the analysis of the microwave spectrum,81048 cm−1. The mismatch be-tween the experimental8and the present ab initio poten-tial might be due to model differences. Koput8 assumed a rigid linear NCO group while its structure was opti-mized in the present calculation as indicated by Figs. 4 and 5.
The bending-torsional parameter V0
3 in Eq. (6), also determined in this last set of ab initio calculations, is 10.3, 125.6, and −432.6 cm−1/rad for the neutral ˜X1A0 state and the cation ˜X+ 2A00 and ˜A+ 2A0 states, respec-tively. These results are consistent with the equilib-rium τ -values in Table II. For the neutral species, the analysis of the microwave spectrum8 yielded a value of 20 cm−1/rad which is twice as large as that obtained in this work.
B. Bending-torsion energy levels
The zeroth-order rotation-bending-torsion Hamilto-nian Hrbt depends on the Eulerian-type angles, describ-ing the overall rotation, and on the two active large am-plitude coordinates. Following Wierzbicki et al.4 and Koput,8we choose a reference configuration represented by atom positions ak(τ, ρ), with 1 ≤ k ≤ 7, depending
Figure 7. For the neutral species ˜X1A0
ground state and the cationic species ˜X+ 2A00and ˜A+ 2A0states, variations with ρ of the bending potential Vb(ρ) of Eq. (6). Ab initio values are
indicated by dots; solid lines are fitted values calculated with Eq. (3). The dotted line is the bending potential retrieved by Koput8 for the neutral ground state.
only on the two active coordinates. Such atom positions are obtained using the coordinate system of Section III A and setting the inactive coordinates to the equilibrium values of Section III A 2. The molecule fixed xyz axis system, shown in Fig. 2, is such that its origin is the molecular center of mass; its xz plane is parallel to the CαNC plane; and the AB axis, bisecting the ∠CαNC angle, is parallel to the x axis.
In order to use previous theoretical results37–42 con-cerning large amplitude bending modes, the angular co-ordinate ρ is replaced by t = cos(π − ρ), where −1 ≤ t ≤ +1. The classical rotation-bending-torsion kinetic energy T is expressed in terms of the angular velocities ωδ, with δ = x, y, z, the time derivatives ωτ = ˙τ and ωt= ˙t, and the 5 × 5 generalized inertia tensor I(τ, t) as:
T = 12X δ,γ
I(τ, t)δγωδωγ, (7)
where δ, γ = x, y, z, τ, t. As stressed in Section III A 2, the equilibrium values of the inactive coordinates are only available for τ = 0 or τ = 60◦. For this reason the τ -dependence of the generalized inertia tensor in Eq. (7) is ignored and this tensor is approximated by I(t). This ap-proximated tensor is to be calculated for the τ = 0 config-uration of the neutral and the cation ground states, and for the τ = 60◦ configuration of the cation ˜A+ 2A0 state. The zeroth-order Hamiltonian Hrbt, written in terms of the generalized inverse inertia tensor43,44 µ(t), takes the form: Hrbt= 12Pτµτ τPτ+12PtµttPt+12 X δ=x,y,z µδδJδ2 +12µxz{Jx, Jz} + 1 2{µxτ, Pτ}Jx +12{µyt, Pt}Jy+12{µzτ, Pτ}Jz+ V0(τ, t), (8)
general-ized inverse inertia tensor; {, } is the anticommutator; Pτ and Ptare the momentum conjugated to τ and t, re-spectively; Jδ, with δ = x, y, z, are molecule fixed compo-nents of the rotational angular momentum J; and V0(τ, t) is the anharmonic potential of Eq. (6). The volume el-ement to be used is sin θdθdφdχdτ dt. A term involving the determinant of µ(t), giving rise to a mass-dependent potential,43,44 has been omitted in Eq. (8). Because of the Cssymmetry of the molecule, the generalized inverse inertia tensor displays only 4 nonvanishing non-diagonal components. Compared to the rotation-bending-torsion Hamiltonian in Eq. (4) of Koput,8 the additional term in µyt arising in this work is due to a different molecule fixed axis system.
Although there are no analytical expressions for the generalized inverse inertia tensor, it can be shown that its µzz, µxτ, µzτ, and µτ τ components go to infinity for the t = −1, C3v configuration. This is due to the quasi-symmetry. Using Appendix B, it can be deduced that these components and µtt, display the following limiting behavior when t → −1: lim t→−1 µzz(t) = B/z, µxτ(t) = −2A/√2z, µzτ(t) = B/z, µτ τ(t) = B/z, µtt(t) = 4Bz, (9)
where z = 1 + t and the kinetic energy constants A and B can be expressed in terms of atom masses and C3v configuration geometrical parameters using Eqs. (B3).
In order to compute bending-torsion energies, the zeroth-order Hamiltonian of Eq. (8) is diagonalized us-ing the followus-ing basis set functions:
ψm,v(τ, t) = |miφmv(t), (10) where |mi = exp(imτ )/√2π is a free internal rotation function characterized by the quantum number m and φm
v(t) is a bending function characterized by the quan-tum number v and depending on m. The bending func-tions are the eigenfuncfunc-tions of a bending Hamiltonian Hbmbuilt retaining in Eq. (8) those terms having diago-nal torsiodiago-nal matrix elements:
Hbm= 12µτ τm 2+1
2PtµttPt+ Vb(t), (11) where Vb(t) is the pure bending potential of Eq. (6). The results of Eq. (9) suggest that the bending eigenfunctions and eigenvalues should be obtained using the results de-rived for a large amplitude bending mode.37–42 We are led to expand the bending eigenfunction φm
v (t) as: φmv (t) = pMax X p=0 av,mp θpα,β(t), (12) where av,m
p are expansion coefficients and θα,βp (t) are the basis set functions defined in Eq. (4) of Coudert.38 In agreement with Eqs. (9), β is set to |m|. As the bend-ing potentials, shown in Fig. 7, become strongly repulsive
when t increases, the bending functions should vanish in this limiting case. This behavior is achieved by setting α to a large enough positive value. Taking α = 30 en-sures the correct behavior without accuracy loss. The matrix of the bending Hamiltonian Hm
b can be set up evaluating the matrix elements of the bending potential Vb(t) with a Gauss-Jacobi quadrature. Matrix elements of the operators PtµttPt and µτ τ can be evaluated with the help of Eqs. (A1)–(A6) of Coudert et al.45The bend-ing energies obtained after diagonalization will be de-noted Emb(v). The matrix element of the zeroth order Hamiltonian in Eq. (8) can now be expressed as:
hψm0,v0|Hrbt|ψm,vi = δm0,mδv0,vEbm(v) −1 4V 0 3δ|m0−m|,3hφm 0 v0 |ρ|φmvi, (13)
where the last term, when evaluated with the help of Eq. (12), leads to the bending matrix element hθpα00,β0|ρ|θpα,βi. Evaluation of this matrix element should be carried out with care because the angle ρ cannot be expanded as a polynomial-type expansion in terms of t. The angle ρ varies like √1 − t2 when t is close to −1 and its bending matrix element can be computed using the same ideas as in Eqs. (A1)–(A6) of Coudert et al.45 Equation (13) emphasizes that the matrix of the zeroth order Hamiltonian can be split into 3 submatrices. The matrices with m = 3q ± 1 give rise to doubly degenerate levels belonging to the E symmetry species of C3v. The submatrix with m = 3q can be further split into 2 smaller submatrices leading to nondegenerate levels belonging to either the A1 or A2 symmetry species. Bending-torsion energy levels obtained after diagonalization of the zeroth order Hamiltonian are denoted E(vb, m, Γ) and labeled using the bending vibrational quantum number vb, the torsional quantum number m, and Γ their symmetry species in C3v. The bending-torsion wavefunction takes the following form:
|Ψvb,m,Γi =X q,v
bvb,m,Γ
q,v |ψq,vi, (14)
where bvb,m,Γ
q,v are expansion coefficients and ψq,v is a ba-sis function of Eq. (10). Table III gathers four sets of calculated bending-torsion energies listed with respect to that of the lowest vb = m = 0, A1 level. The first set was calculated using the reference configuration and the anharmonic potential of Koput,8 defined in Column I of his Table III. The energy values are at most within 0.07 cm−1 from those reported by the author in his Ta-ble II. The second, third, and fourth sets, for the neutral molecule and the cationic species ˜X+ 2A00 and ˜A+ 2A0 states, respectively, were calculated using the reference configurations obtained in Section III A 2 and the anhar-monic potential of Eq. (6). For the neutral molecule and especially for vb = 1, the energy values obtained in this work differ from those obtained with Koput’s parameterization8 because, as emphasized by Fig. 7, the bending potentials are very different. Calculating the
Table III. Calculated bending-torsion energiesa
˜
X1A0 ˜
X+ 2A00 ˜
A+ 2A0
vb m Γ Ref.8 This work
0 1 E 8.70 8.69 6.63 190.57 0 −2 E 36.32 36.52 36.00 388.36 0 3 A2 80.16 80.30 72.97 593.57 0 3 A1 80.45 80.64 74.93 593.81 0 4 E 141.71 141.77 128.71 808.33 1 0 A1 191.28 168.34 183.06 339.90 1 1 E 200.74 177.98 190.32 534.12
a Bending-torsion levels are labeled with the quantum numbers
vband m, and their symmetry species Γ. Their energies in
cm−1are given with respect to the v
b= m = 0, A1lowest level.
The reference configuration of Koput8and those retrieved in
Section III A 2 for the neutral and the cationic species were considered.
fundamental frequency of the bending ∠CαNC mode for the neutral species as the average of the energy differ-ences E(vb = 1, m = 1, E) − E(vb = 0, m = 1, E) and E(vb = 1, m = 0, A1) − E(vb = 0, m = 0, A1), we obtain 191.6 and 168.8 cm−1 with Koput’s parameterization8 and that of this work, respectively. Both values com-pare favorably with the experimental gas-phase value of 172 cm−1 reported by Sullivan et al.19Similarly, also for the neutral, the fundamental frequency for the torsional mode should be calculated as the average of the energy difference E(vb = 0, m = 3, A2) − E(vb = 0, m = 0, A1) and E(vb= 0, m = −2, E) − E(vb= 0, m = 1, E) leading to 54 cm−1with either Koput’s parameterization8or that of this work. This value is in very good agreement with the experimental gas-phase value reported by Sullivan et al.,1950 cm−1.
C. Vibration-bending-torsion energy levels
Vibration-bending-torsion energy levels were calcu-lated using the harmonic adiabatic approximation23 (HADA). Eigenvalues and eigenfunctions of the total Hamiltonian are retrieved using basis set functions which are the product of the harmonic oscillator wavefunction of Eq. (5) and of the bending-torsion basis set functions of Eq. (10):
Ψn(Q; t)ψm,v(τ, t). (15) Within the HADA approximation,23the t parametric de-pendence of the harmonic oscillator wavefunction is ig-nored leading to no additional kinetic energy term in the zeroth-order Hamiltonian of Eq. (8). Also, matrix ele-ments of the total Hamiltonian are only considered be-tween two basis set functions of Eq. (15) characterized by the same n1, . . . , n5 vibrational quantum numbers. We are led to compute bending-torsion energy levels for each
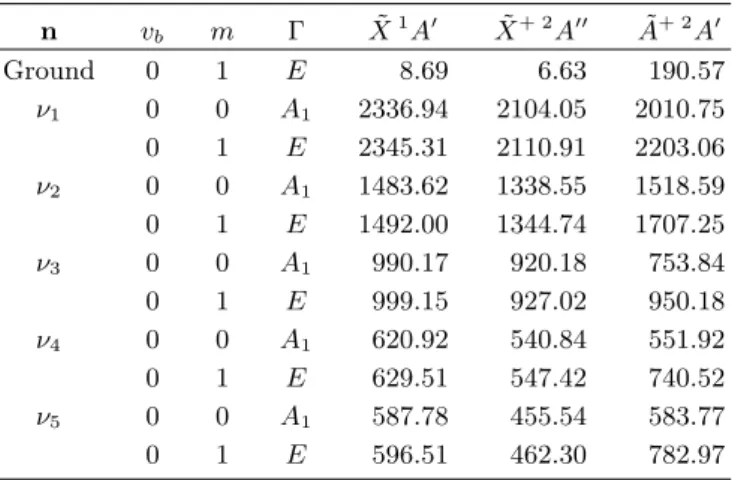
Table IV. Calculated vibration-bending-torsion energiesa
n vb m Γ X˜1A0 X˜+ 2A00 A˜+ 2A0 Ground 0 1 E 8.69 6.63 190.57 ν1 0 0 A1 2336.94 2104.05 2010.75 0 1 E 2345.31 2110.91 2203.06 ν2 0 0 A1 1483.62 1338.55 1518.59 0 1 E 1492.00 1344.74 1707.25 ν3 0 0 A1 990.17 920.18 753.84 0 1 E 999.15 927.02 950.18 ν4 0 0 A1 620.92 540.84 551.92 0 1 E 629.51 547.42 740.52 ν5 0 0 A1 587.78 455.54 583.77 0 1 E 596.51 462.30 782.97
aVibration-bending-rotation levels are labeled with the small
amplitude vibrational quantum number n, the bending quantum numbers vb, the torsional quantum number m, and
their torsional symmetry species Γ. Their energies in cm−1
with respect to the vb= m = 0, A1ground vibrational state are
listed in the body of the table.
small amplitude vibrational state using the results in Sec-tion III B and adding the following term to the potential energy function: Vn(t) = 5 X i=1 ˜ νi(t)ni, (16)
where n = n1, . . . , n5, as in Eq. (5), and ni appears, instead of the familiar ni + 12, because the zero-point vibrational energy is already included in the anharmonic potential of Eq. (6).
Table IV lists a few low-lying vibration-bending-torsion energies for the neutral and the cationic species. It can be seen that for the ground vibrational state of ei-ther electronic states, the energies are the same as in Table III. This is due to the fact that the contribu-tion from the potential in Eq. (16) vanishes for that state. An estimate of the fundamental frequencies of the 5 small amplitude vibrational modes can be obtained taking the average of the energy differences E(νi, vb = 0, m = 0, A1) − E(Ground, vb = 0, m = 0, A1) and E(νi, vb = 0, m = 1, E) − E(Ground, vb = 0, m = 1, E). For the neutral molecule this leads to 2337, 1483, 990, 621, and 588 cm−1. These frequencies should be com-pared to the experimental values of Sullivan et al.,19 2230, 1434, 855, 619, and 583 cm−1. In many cases, the frequencies retrieved in this work are in better agree-ment with the experiagree-mental values than those calculated by these authors. For the cation ˜X+ 2A00 state, the fundamental frequencies are 2104, 1338, 920, 541, and 456 cm−1 and, as stressed in Section II, are consistent with the observed values extracted from the experimen-tal TPES.
IV. CALCULATED TPES
For a transition with upper and lower levels denoted v+and v00, respectively, belonging to either ionizing tran-sitions, the transition probability is taken equal to the Franck-Condon factor |hΨv+|Ψv00i|2 involving Ψv+ the
wavefunction of the cation and Ψv00 that of the neutral.
A. Bending-torsion approach
The expansion of the bending-torsion wavefunction in Eq. (14) shows that computing Franck-Condon factors requires evaluating the matrix elements of two basis set functions of Eq. (10): hψm+,v+|ψm00,v00i = δm+,m00hφm + v+ |φm 00 v00 i. (17)
The last term in this equation can be obtained from Eq. (12) leading to bending matrix elements of the form hθαp++,β+|θ
α00,β00
p00 i. The latter reduces to δp+,p00 because
m+ = m00 in Eq. (17) dictates that α+ = α00 and β+= β00, in agreement with Section III B. For each elec-tronic state, the lowest 81 bending-torsion energy levels were calculated for the A1 and A2 torsional symmetry species as well as for the E torsional symmetry species. Franck-Condon factors were then computed for the re-sulting transitions of either ionizing transitions. Sym-metry requires that transitions connect bending-torsion energy levels with the same torsional symmetry, reduc-ing the number of allowed transitions. The TPES was calculated for both ionizing transitions and for a tem-perature of 300 K. The value of the adiabatic ioniza-tion energy for the ˜X+ 2A00← ˜X1A0 ionizing transition calculated at 10.729 eV was found too high when first comparing observed and calculated TPES. Matching the position of the strongest peaks, this value was decreased by 0.133 eV yielding 10.596(6) eV. As stressed in Sec-tion II B, no spectroscopic feature could be assigned for the ˜A+ 2A0 ← ˜X1A0 ionizing transition. For this rea-son, the adiabatic ionization energy of this transition, calculated at 10.892 eV, was also decreased by 0.133 eV yielding 10.759(50) eV where the large 50 meV uncer-tainty is an estimate of the ˜A+ 2A0 and ˜X+ 2A00 states relative energy ab initio error. Figure 8 depicts the re-sulting TPES along with the experimental one. For the
˜
X+ 2A00← ˜X1A0 ionizing transition, only 4 sharp peaks arise and the short Franck-Condon progression is due to the bending mode. For the ˜A+ 2A0 ← ˜X1A0 ionizing transition, the larger number of peaks is due to the large difference between the structure and the potential of the neutral and of the cation ˜A+ 2A0state. The TPES includ-ing both ionizinclud-ing transitions was computed multiplyinclud-ing the contribution from the ˜A+ 2A0 ← ˜X1A0ionizing tran-sition by 3 which ensures the best agreement with the ex-perimental spectrum but has no theoretical justification. An HWHM of 75 cm−1 was used to take into account
Figure 8. TPES calculated with the bending-torsion approach plotted as a function of the photon energy. A Gaussian line shape with an HWHM of 20 cm−1was taken for clarity in a) and b) for the ˜X+ 2A00
← ˜X1A0
and ˜A+ 2A0
← ˜X1A0
ion-izing transitions, respectively. In c), an HWHM of 75 cm−1 was adopted for the TPES calculated in accordance with Sec-tion IV A and compared to the experimental spectrum in d). Different y-axis scales were used for each panel.
both the experimental resolution and the rotational en-velope. Although the agreement with the experimental TPES is not really satisfactory, the present simplified cal-culation is able to reproduce the broad feature spanning the energy range from 10.6 to 11.8 eV.
B. Vibration-bending-torsion approach
Using the results in Section III C we can see that evalu-ating the Franck-Condon factors leads to matrix elements between two basis set functions of Eq. (15) expressed as: hψm+,v+|I(n+, n00; t)|ψm00,v00i (18)
where I(n+, n00; t) is the Franck-Condon overlap integral between Ψn+(Q+; t) the vibrational wavefunctions of the
cation and Ψn00(Q00; t) that of the neutral, as defined in
Eq. (5). The Franck-Condon overlap integral takes the form:46 I(n+, n00; t) = [det J(t)]− 1 2 × Z Ψn+(Q+; t)Ψn00(Q00; t)dQ00, (19)
where J(t) is defined below. The relation between both sets of normal coordinates, required to evaluate this in-tegral, is Duschinsky’s linear transformation:47
where J(t) is a matrix and k(t) is a column vector. Denoting L+(t) and L00(t) the Wilson-type matrices34 arising in Section III A 3 for the cation and the neutral species, respectively, we obtain:48
J(t) = [L+(t)]−1L00(t) (21) and
k(t) = [L+(t)]−1[qeq00(t) − qeq+(t)], (22) where qeq+(t) and qeq00(t) are the equilibrium values arising in Section III A 2 for the cation and the neutral species, respectively. Using Ruhoff and Ratner’s recur-sive algorithm46 and Eqs. (20)–(22), the Franck-Condon overlap integral were evaluated. For each set n+ and n00 of upper and lower vibrational quantum numbers, a t-dependent function was obtained. Figure 9 shows the variations of I(n+, n00; t) for the ˜A+ 2A0← ˜X1A0ionizing transition and for 4 sets of vibrational quantum numbers. The cation, n+ = ν
n was taken, with 1 ≤ n ≤ 4; while for the neutral, n00corresponds to the ground vibrational state.
Because the FranckCondon overlap integral is not τ -dependent, the matrix element in Eq. (18) reduces to:
δm+,m00hφm +
v+ |I(n+, n00; t)|φm 00
v00i, (23)
an expression analogous to that in Eq. (17). As in the case of this equation, the following bending matrix ele-ment arises:
hθpα,β+|I(n
+, n00; t)|θα,β
p00 i, (24)
and can be calculated using a Gauss-Jacobi quadrature. The TPES of each ionizing transition was simu-lated considering small amplitude vibrational states with P5
i=1n 00
i ≤ 2 for the neutral species and P5
i=1n + i ≤ 4 for the cation leading to 21 and 126 states, respectively. For each state 162 bending-torsion energy levels were calcu-lated including 81 levels with A1 and A2 torsional sym-metry and 81 levels with E torsional symsym-metry. This led to 3402 energy levels for the neutral molecule and 20412 for the cationic species. Total photoionization proba-bilities were then computed for the resulting transitions taking into account symmetry restrictions.
In addition to the experimental TPES, Fig. 10 shows three TPES calculated for a vibrational temperature of 300 K including those of the ˜X+ 2A00 ← ˜X1A0 and
˜
A+ 2A0 ← ˜X1A0 ionizing transitions, and a trial TPES computed adding the contribution of both ionizing tran-sitions. In order to have the best agreement with the ex-perimental TPES, the contribution from the ˜A+ 2A0 ←
˜
X1A0 ionizing transition was multiplied by 2. This fac-tor, as the one used in Section IV A, has no theoretical significance. Comparing this trial TPES with the exper-imental one confirms the line position agreement high-lighted in Section II. It also shows that the broad fea-ture of the experimental TPES, from 10.6 to 11.8 eV,
Figure 9. The dimensionless Franck-Condon overlap integral I(n+, n00; ρ) for the ˜A+ 2A0 ← ˜X1A0 ionizing transition is plotted as a function of ρ for 4 sets of small amplitude vibra-tional states. n+= ν
n, with 1 ≤ n ≤ 4, and n00corresponding
to the neutral ground vibrational state. The value of n iden-tifies each curve in the figure.
is fairly well reproduced. The line intensity agreement is, however, less satisfactory. The sharp peaks in the 10.65 to 10.8 eV energy range, corresponding to the ν2, ν3, and ν4 modes, are obviously too weak. Conversely, the Franck-Condon progression due to the ∠CαNC bend-ing mode at 191 cm−1 is quite prominent in the calcu-lated TPES but not in the experimental one. Without adjustment, the calculated adiabatic ionization energies for the ˜X+ 2A00 ← ˜X1A0 and ˜A+ 2A0 ← ˜X1A0 ioniz-ing transitions are exactly the same as in Section IV A. In this case too, the value for the former transition was decreased being too large. Within the experimental un-certainty, the energy shift was the same as in this section leading to an adjusted value of 10.596(6) eV. Similarly for the ˜A+ 2A0 ← ˜X1A0 ionizing transition, this leads to the same estimated value of 10.759(50) eV.
Although line intensities may be affected by resonant autoionization in threshold photoelectron spectroscopy,49 the intensity discrepancies in the 10.65 to 10.8 eV energy range can also be understood noticing that the Franck-Condon factors are extremely sensitive to the equilibrium value differences in Eq. (22). The ˜X+ 2A00← ˜X1A0 ion-izing transition was recalculated changing slightly the pa-rameters retrieved whilst fitting the ab initio values of the cationic species ˜X+ 2A00 ground state in Section III A 2. For the two bond length coordinates q3 = r(CN) and q4 = r(CO), the values of q03 and q40 in Eq. (3) were in-creased by 1.721 and 0.904 %, respectively. For the bond angle q6= ∠NCO, the parameters fj6 in Eq. (4) were in-creased by 20%. The vibration-bending-torsion energies of the cationic species ˜X+ 2A00 ground state underwent small changes on the order of a few cm−1 but line in-tensities were drastically changed. Figure 11 shows the TPES obtained adding the contribution of both ionizing transitions with no multiplicative factors. The Franck-Condon progressions due to the ν1and ν2modes and the fundamentals of the ν3 and ν4 modes can now clearly be seen in panel a) of this figure where vibrational as-signments are given. These asas-signments are consistent with Table I and a more satisfactory agreement with the experimental TPES arises. However, we are still
un-Figure 10. TPES calculated with the vibration-bending-torsion approach plotted as a function of the photon energy. The ˜X+ 2A00← ˜X1A0 and ˜A+ 2A0 ← ˜X1A0 ionizing transi-tions are drawn in a) and b), respectively, using the same line shape as for a) in Fig. 8. The TPES calculated in accordance with Section IV B is plotted in c) using the same line shape as for c) in Fig. 8 and compared to the experimental spectrum in d). Different y-axis scales were used for each panel.
able to assign peak # 3. Likewise, the band calculated at 10.61 eV, corresponding to the short Franck-Condon progression along the bending molde as described in Sec-tion IV A, still does not have a counterpart in the ex-perimental TPES. No effort was made to recalculate the
˜
A+ 2A0 ← ˜X1A0 ionizing transition. This transition is dominated by Franck-Condon progressions due to the two large amplitude modes and altering the parameterization of the small amplitude vibrational modes did not allow us to observe Franck-Condon progressions due to these modes.
V. CONCLUSION
The photoelectron spectrum of methyl isocyanate in the 10.4 to 12 eV region is attributable to ionization from the nonbonding π2(a00, a0) orbitals of the NCO group leading to two ionizing transitions from the neu-tral ground ˜X1A0 state to the cation ground ˜X+ 2A00 and first excited ˜A+ 2A0 electronic states. The TPES of these two photoionizing transitions has been recorded in this work using synchrotron radiation and theoretically modeled.
Although methyl isocyanate has only 7 atoms, it is the-oretically challenging as it displays two large amplitude motions consistent with its quasi-symmetry.2–11The cou-pling between these two large amplitude motions must be treated exactly to properly model its energy level
dia-Figure 11. TPES calculated with the vibration-bending-torsion approach plotted in a) as a function of the photon energy. The line shape is the same as for c) in Fig. 8. This adjusted spectrum was obtained by changing slightly param-eters describing the equilibrium values of the inactive coordi-nates q3, q4, and q6 for the cationic species ˜X+ 2A00 ground
state. The vibrational bands of the ˜X+ 2A00← ˜X1A0 ioniz-ing transition are labeled with the small amplitude vibrational mode number of Section III C and upper and lower vibrational quantum numbers. The experimental spectrum is shown in b) and the 10 strongest sharp peaks are numbered as in Fig. 1.
gram and, for instance, to account for its high-resolution spectroscopic data.8,13,14 As the TPES recorded in this work displays well-resolved vibrational structures, the 13 small amplitude vibrational modes should also be in-cluded in the theoretical model.
Even though theoretical models accounting for one large amplitude motion have already been proposed for modeling photoelectronic spectra,50the model developed in this work goes one step further since it takes into ac-count two large amplitude motions and the small am-plitude vibrational modes. Several approximations, how-ever, were made. Only a few small amplitude modes were considered. The selected ones are those closely related to the change in equilibrium structure upon ionization. This principle, applied by Eland25 in the case of the parent species HNCO, means in the case of methyl isocyanate that only the 5 small amplitude vibrational modes in-volving NCO group atoms should be retained. Indeed, the orbital from which ionization occurs belongs to this group and, as confirmed by Table II, the internal coordi-nates involving these atoms undergo the largest changes when going from the neutral molecule to either states of the cationic species. The second adopted approxi-mation involves neglecting the dependence on the large amplitude torsional motion of the generalized inverse in-ertia tensor43,44 and of the matrices involved in the F G method.34The third approximation involves omitting the vibronic couplings between the two electronic states of the cationic species.
In this work, ab initio calculations were performed to obtain the equilibrium geometries of the neutral and cationic species, the equilibrium values of the small
am-plitude inactive coordinates as functions of the two ac-tive large amplitude coordinates,23,24 and the Hessian matrix. These results allowed us to obtain bending-torsion and vibration-bending-bending-torsion energy levels for the neutral and the cationic species. For the neutral molecule, these results, given in Tables III and IV are in good agreement with those obtained in previous spectro-scopic investigations.8,19 For the cation ˜X+ 2A00 ground electronic state, the vibrational energies could only be compared to those reported by Pasinszki et al.22 and those extracted from the present experimental TPES. Table I, where experimental and calculated values are compared, emphasizes that the discrepancies are smaller than 100 cm−1 for fundamental frequencies.
The main results of the paper are the calculated TPES presented in Sections IV A and IV B. With the model in which only the two large amplitude coordinates are con-sidered, a qualitative agreement with the experimental spectrum is achieved as the theoretical TPES displays a sharp line and a broad feature spanning a large energy range, Fig. 8. With the more sophisticated treatment ac-counting also for the small amplitude vibrational modes, there is a good agreement between the line positions of the strongest sharp peaks, but their intensities are not fully reproduced by the model. A better agreement could be obtained for the line intensity of these peaks by ad-justing several parameters retrieved from the fit of the ab initio calculations results.
The present investigation provided an accurate value of 10.596(6) eV for the adiabatic ionization energy of the ˜X+ 2A00 ← ˜X1A0 photoionizing transition, with ei-ther the bending-torsion or the vibration-bending-torsion models. The value obtained directly from the ab ini-tio calculaini-tions turned out to be 0.133 eV too high. Although no spectroscopic patterns could be assigned for the ˜A+ 2A0 ← ˜X1A0 ionizing transition, a value of 10.759(50) eV was deduced for its adiabatic ionization en-ergy using the relative enen-ergy of the ˜A+ 2A0 and ˜X+ 2A00 electronic states obtained from the ab initio calculations. The present investigation also offers an estimate of the oscillator strength ratio between the ˜A+ 2A0 ← ˜X1A0 and ˜X+ 2A00 ← ˜X1A0 ionizing transitions. Depending on the model, the value ranges from 1 to 3.
ACKNOWLEDGMENTS
This work was performed on the DESIRS beamline under Proposal No. 20160902. We acknowledge SOLEIL for provision of synchrotron radiation facilities and the DESIRS beamline staff for their assistance. This study was supported by the Programme National Physique et Chimie du Milieu Interstellaire (PCMI) of CNRS/INSU with INC/INP co-funded by CEA and CNES. J.-C. G. thanks the CNES for a grant.
DATA AVAILABILITY
The data that support the findings of this study are available from the corresponding author upon reasonable request.
Appendix A: Fitting expansion to obtain qeqi (τ, ρ)
The value of qi0 to be used in Eq. (2) are:
qi0= r0 i, 3 ≤ i ≤ 5, 0 or π, 6 ≤ i ≤ 7, r(CαH), 8 ≤ i ≤ 10, ∠NCαH, 11 ≤ i ≤ 13, 0, i = 14, ±2π/3, i = 15, (A1) where r0
i, r(CαH), and ∠NCαH are the bond lengths and bond angles for the C3v configuration. The Fourier-type expansions gi
j(τ ) in Eq. (2) are given below and are written with parameters denoted fki,j. For 3 ≤ i ≤ 6, the expansion gi j(τ ) is given by: gij(τ ) = m X k=0
fki,j cos 3(2k + l)τ, (A2)
where fki,jare fitted parameters and l is 0 or 1 depending on the coordinate i and on the parity of j. For 3 ≤ i ≤ 5, l is 0 (1) for j even (odd); for i = 6, l is 1 (0) for j even (odd). For i = 7, gi j(τ ) is given by: gji(τ ) = m X k=0
fki,j sin 3(2k + l)τ, (A3)
where l is 0 (1) for j even (odd). For the three bond lengths with 8 ≤ i ≤ 10 and the three bond angles with 11 ≤ i ≤ 13, gi j(τ ) is given by: gji(τ ) = m X k=0
fki,j cos[(2k + l)(τ − li4π/3)], (A4)
where fki,j are fitted parameters, l is 1 (0) when j is even (odd), and liis i − 8 for the three bond lengths and i − 11 for the three bond angles. For the angle q14= β1, gi
j(τ ) is given by: gji(τ ) = m X k=1
fki,j sin(2k + l)τ, (A5)
where fki,j are fitted parameters and l is −1 (0) when j is even (odd). At last, for the angle q15 = β2, gij(τ ) is given by:
gij(τ ) = m X k=0
where fki,j are fitted parameters and l is 1 (0) when j is even (odd).
Appendix B: Exact bending-torsion-rotation Hamiltonian
When using a reference configuration characterized by rigid linear NCO group and C3v methyl group, the fol-lowing expressions can be obtained for the nonvanishing inverse inertia tensor components:
µtt= 4(c − p0t)(1 − t2)/Dt, µyy = (c + p0t)/Dt, µty= 2d √ 1 − t2/D t, µτ τ = [(c2− d2− p2 0− 2Iz2d)(1 − t2)/Iz2 + 2c(1 + t2) − 4tp0]/Dτ, µxτ =p2(1 + t)[d − c + p0− t(d + c − p0)]/Dτ, µzτ =p2(1 − t)[d − c − p0+ t(d + c + p0)]/Dτ, µxx= 2(1 + t)(c − p0)/Dτ, µxz = −2√1 − t2d/Dτ, µzz= 2(1 − t)(c + p0)/Dτ, (B1) where: Dt= c2− d2− p2 0t2, Dτ = (c2− d2− p2 0)(1 − t 2), c = I1+ Ix2+ [(m1+ m2)(m3+ m4+ 3mH)r12 + (m1+ m2+ m3)(m4+ 3mH)r22]/M, d = I1− I2 x+ [(m1+ m2)(m3+ m4+ 3mH)r21 − (m1+ m2+ m3)(m4+ 3mH)r22]/M, p0= 2(m1+ m2)(m4+ 3mH)r1r2/M, r1= [m1ra+ m2r(CαN)]/(m1+ m2), r2= [m4r(CN) + 3mHrd]/(m4+ 3mH), ra= r(CO) + r(CαN), rd= r(CN) + r(CH) cos β, I1= m 1m2/(m1+ m2)r(CO)2, I2 x= 3mHr(CH)2[ 1 2sin 2β + m4/(m4+ 3mH) cos2β], Iz2= 3mHr(CH)2sin2β, (B2)
with β = ∠NCαH and m1, m2, m3, and m4 being short-hand notations for mO, mC, mN, and mC
α, respectively.
Equations (B1) and (B2) lead to the following values for A and B in Eqs. (9): A = −d c2− d2− p2 0 , B = 2(c + p0) c2− d2− p2 0 . (B3)
[1] W. Worthy, Chem. & Engineering News Archive 63, 27 (1985).
[2] J. A. Duckett, A. G. Robiette, and I. M. Mills, J. Mol. Spectrosc. 62, 34 (1976).
[3] S. Cradock, J. Mol. Spectrosc. 92, 170 (1982).
[4] A. Wierzbicki, J. Koput, and M. Kr¸eglewski, J. Mol. Spectrosc. 99, 102 (1983).
[5] M. Kr¸eglewski and P. Jensen, J. Mol. Spectrosc. 103, 312 (1984).
[7] M. Kr¸eglewski, J. Mol. Spectrosc. 105, 8 (1984). [8] J. Koput, J. Mol. Spectrosc. 106, 12 (1984). [9] J. Koput, J. Mol. Spectrosc. 115, 131 (1986). [10] J. Koput, J. Mol. Spectrosc. 118, 448 (1986). [11] J. Koput, J. Mol. Spectrosc. 127, 51 (1988).
[12] R. G. Lett and W. H. Flygare, J. Chem. Phys. 47, 4730 (1967).
[13] R. F. Curl, V. M. Rao, K. V. L. N. Sastry, and J. A. Hodgeson, J. Chem. Phys. 39, 3335 (1963).
[14] J. Cernicharo, Z. Kisiel, B. Tercero, L. Kolesnikov´a, I. R. Medvedev, A. L´opez, S. Fortman, M. Winnewisser, F. C. de Lucia, J. L. Alonso, and J.-C. Guillemin, A&A 587, L4 (2016).
[15] D. T. Halfen, V. V. Ilyushin, and L. M. Ziurys, Astro-phys. J. 812, L5 (2015).
[16] F. Goesmann, H. Rosenbauer, J. H. Bredeh¨oft, M. Ca-bane, P. Ehrenfreund, T. Gautier, C. Giri, H. Kr¨uger, L. Le Roy, A. J. MacDermott, S. McKenna-Lawlor, U. J. Meierhenrich, G. M. M. Caro, F. Raulin, R. Roll, A. Steele, H. Steininger, R. Sternberg, C. Szopa, W. Thiemann, and S. Ulamec, Science 349, 497 (2015). [17] K. Altwegg, H. Balsiger, J. J. Berthelier, A. Bieler, U. Calmonte, S. Fuselier, F. Goesmann, S. Gasc, T. I. Gombosi, L. Le Roy, J. de Keyser, A. Morse, M. Rubin, M. Schuhmann, M. G. G. T. Taylor, C.-Y. Tzou, and I. Wright, MNRAS 469, S130 (2017).
[18] R. P. Hirschmann, R. N. Kniseley, and V. A. Fassel, Spectrochim. Acta. 21, 2125 (1965).
[19] J. F. Sullivan, H. L. Heusel, W. M. Zunic, J. R. Durig, and S. Cradock, Spectrochim. Acta. A: Molecular Spec-troscopy 50, 435 (1994).
[20] I. Tokue, A. Hiraya, and K. Shobatake, Chem. Phys. 117, 315 (1987).
[21] S. Cradock, E. A. V. Ebsworth, and J. D. Murdoch, J. Chem. Soc. Faraday Trans. 2 68, 86 (1972).
[22] T. Pasinszki, T. Veszpr`emi, M. Feh`er, B. Kova`c, L. Klas-inc, and S. P. McGlynn, Int. J. Quantum Chem. 44(S26), 443 (1992).
[23] D. Lauvergnat, A. Nauts, Y. Justum, and X. Chapuisat, J. Chem. Phys. 114, 6592 (2001).
[24] D. Lauvergnat and A. Nauts, Chem. Phys. 305, 105 (2004).
[25] J. H. D. Eland, Phil. Trans. Roy. Soc. Lond. A 268, 87 (1970).
[26] D.-H. Han, P. G. Pearson, and T. A. Baillie, J. Lab. Comp. Radiopharm. 27, 1371 (1989).
[27] B. Mat´e, G. Molpeceres, V. Tim´on, I. Tanarro, R. Escrib-ano, J. C. Guillemin, J. Cernicharo, and V. J. Herrero, MNRAS 470, 4222 (2017).
[28] X. Tang, G. A. Garcia, J.-F. Gil, and L. Nahon, Rev. Sci. Instrum. 86, 123108 (2015).
[29] L. Nahon, N. de Oliveira, G. A. Garcia, J.-F. Gil, B. Pilette, O. Marcouill´e, B. Lagarde, and F. Polack, J. Synchrotron Radiat. 19, 508 (2012).
[30] B. Mercier, M. Compin, C. Prevost, G. Bellec, R. Thissen, O. Dutuit, and L. Nahon, J. Vac. Sci. & Technol. A 18, 2533 (2000).
[31] G. A. Garcia, B. K. de Miranda, M. Tia, S. Daly, and L. Nahon, Rev. Sci. Instrum. 84, 053112 (2013). [32] J. C. Poully, J. P. Schermann, N. Nieuwjaer, F. Lecomte,
G. Grgoire, C. Desfranois, G. A. Garcia, L. Nahon, D. Nandi, L. Poisson, and M. Hochlaf, Phys. Chem. Chem. Phys. 12, 3566 (2010).
[33] F. Merkt, A. Osterwalder, R. Seiler, R. Signorell, H. Palm, H. Schmutz, and R. Gunzinger, J. Phys. B 31, 1705 (1998).
[34] E. B. Wilson, J. C. Decius, and P. C. Cross, Molecular vibrations (McGraw-Hill Book Company, Inc., 1955). [35] A. Kapur, P. G. Mezey, and R. Steer, Chem. Phys. Lett.
78, 81 (1981).
[36] H.-J. Werner, P. J. Knowles, G. Knizia, F. R. Manby, and M. Sch¨utz, WIREs Comput. Molec. Sci. 2, 242 (2012).
[37] L. H. Coudert, J. Mol. Spectrosc. 154, 427 (1992). [38] L. H. Coudert, J. Mol. Spectrosc. 165, 406 (1994). [39] L. H. Coudert, J. Mol. Spectrosc. 181, 246 (1997). [40] R. Lanquetin, L. H. Coudert, and C. Camy-Peyret,
J. Mol. Spectrosc. 195, 54 (1999). [41] L. H. Coudert, Mol. Phys. 96, 941 (1999).
[42] L. H. Coudert, J. Mol. Spectrosc. 330, 112 (2016). [43] J. T. Hougen, P. R. Bunker, and J. W. C. Johns, J. Mol.
Spectrosc. 34, 136 (1970).
[44] M. A. Mekhtiev, P. D. Godfrey, and V. Szalay, J. Mol. Spectrosc. 180, 42 (1996).
[45] L. H. Coudert, B. Gans, G. A. Garcia, and J.-C. Loison, J. Chem. Phys. 148, 054302 (2018).
[46] P. T. Ruhoff and M. A. Ratner, Int. J. Quant. Chem. 77, 383 (2000).
[47] F. Duschinsky, Acta Physicochim. URSS 7, 551 (1937). [48] A. Capobianco, R. Borrelli, C. Noce, and A. Peluso,
Theor. Chem. Acc. 131, 1181 (2012).
[49] T. Baer, Annu. Rev. Phys. Chem. 40, 637 (1989). [50] R. Signorell and F. Merkt, Faraday Discuss. 115, 205