MITNE-182
CORE DESIGN FOR A SMALL HTGR
by
Arnaldo A.T. Ribeiro David D. Lanning
Department of Nuclear Engineering
MASSACHUSETTS INSTITUTE OF TECHNOLOGY 138 Albany Street
Cambridge, Massachusetts 02139
CORE FOR A
by
Arnaldo Aloisio Telles Ribeiro
Submitted to the Department of Nuclear Engineering on
October 23, 1975 in partial fulfillment of the requirements for the degree of Doctor of Philosophy
ABSTRACT
A conceptual design for a small (300 Mith) High Temperature Gas-Cooled Reactor (HTGR) total energy system was made to provide both heat and
electricity to large U. S. Army bases by 1935. The major emphasis was on the nuclear design but thermal hydraulics and vessel internals were also discussed.
The economic ground rules for the fuel cycle cost calculation are quite different from those of commercial plants: the Army will not pay carrying charges on their fucl, will not receive credit for bred U2 3 3 and will pay consumed U2 3 5 after irradiation. Under those conditions the lowest fuel cycle cost corresponds to the longest possible batch.
The High Enrichment (HE) and Low Enrichment (LE) fuels were selected, among other possible options, for a more detailed investig.ation based on practical reasons; the HE fuel consists in a mixture of uranium containing 93% of U2 3 5 as the fissile material and Th2 3 2 as the fertile material; the LE fuel consists in uranium enriched in U2 3 5 (enrichments examined vary from 11 to 30%). A nuclear comparison between these two tynes of fuel under the same restrictions of maximum excess of reactivity and choice of burnable
poison was made. The HE fuel was found to have two advantages for the present type of economy: a 43.4% longer batch and a 12.3% lower average consumption of U2 3 5 per day.
The HE chosen as the fuel to use in the Army HTGR, was optimized to a 4.8 full power year-batch. The control rod (CR) requirements were minimized to approxinatcly one dollar reactivity per CR pair by optimizing the lumped burnable poison design and by using 12 extra CR pairs evenly distributed in
the replaceable side reflector. To obtain such a long batch without reaching any of the coated fuel particle failure limits some special fuel configurations had to be developed. For the Final Reference Design, FRD, the simplest and less expensive configuration was choson: a single fuel region core with the burnable poison in the bottom reflector.
Another configuration, called Parfait, consisting of having a fertile only region in the center of the otherwise single zone core and also containing LBP in the bottom reflector, was shown to permit a slightly longer batch
(A,4.5% longer) than the FRD. This is possible.because its maximum fuel centerline temperature and fast neutron flux on the coated fuel particles are lower than those of the FRD. It is probable that an optimized Parfait configuration will be more economical than the FRD, but the advantage, if any, will be marginal and for a first batch the simplest design was prefered.
3
ACKNOWLEDGEMENTS
The author wishes
to thank the expert guidance -and kindness of
his
advisor,
Professor
D.
D. Lanning.
Thanks are also due to Professor M. J. Driscoll, general manager
of
HTGR/GT project (and also reader of this thesis)
who provided valuable
assistance and discussions among other students on the project.
Computer calculations for
this work were performed at the
!IT
Information Processing Center with financial support under a research
contract between MIT and the U. S. Army.
Mrs. Virginia Miethe Forsberg
and Rachel Horton supplied assistance in
communicating with the
co:rputer
and
Cindi Ilitaras very ably handled the typing of this work.
Financial support by CNEN, Comissao Nacional de Energia Nuclear,
Brazil, is sincerely acknowledged.
-
The author is also grateful to his wife, Denise, for her encourage.mnt
and companionship and also for her help in the preparation of the figures
for this report.
TABLE OF CONTENTS ABSTRACT 2 ACKNOWLEDGEMENTS 3 LIST OF TABLES 9 LIST OF FIGURES 13 CHAPTER 1 INTRODUCTION 16 1.1 Foreword 16 1.2 Summary Description 18 1.2.1 Reactor Core 18
1.2.2 Reactor Vessel Internals 22
1.2.3 Reactivity Control Systems 22
1.3 Organization of This Report 25
CHAPTER 2 CALCULATIONAL METHODS AND EVALUATION 26
2.1 Core Design Methods 26
2.1.1 Cross-Section (cs) Sets 28
2.1.1.1 Description of the cs Sets 33
2.1.1.2 Evaluation of the cs Sets 33
2.1.1.2.1 Testing the Self-shielding Equivalence 35 2.1.1.2.2 Testing the Scattering Matrix Equivalence 39 2.1.1.2.3 Depletion Runs Without U2 38 and U2 3 9 41
2.1.1.2.4 Conclusions 45
2.1.2 -Burnup Code 46
2.1.3 Comparison with Some of General Atomic (GA) Results
on the Fort Saint Vrain (FSV) Design 46 2.1.3.1 Relative Power Density Distribution per Region
Comparison 47
5
2.1.3.3 Reactivity Variation with Depletion Curves
Comparison
56
2.1.3.4 Conclusions
64
2.2 Design Methods Outside the Core
66
2.2.1 Maximum Fast Flux in the Vessel Wall T4
2.2.2 Gamma Heating in the Vessel Wall
76
CHAPTER 3 SELECTION OF THE FUEL CYCLE TT
3.1 Model for Comparison
79
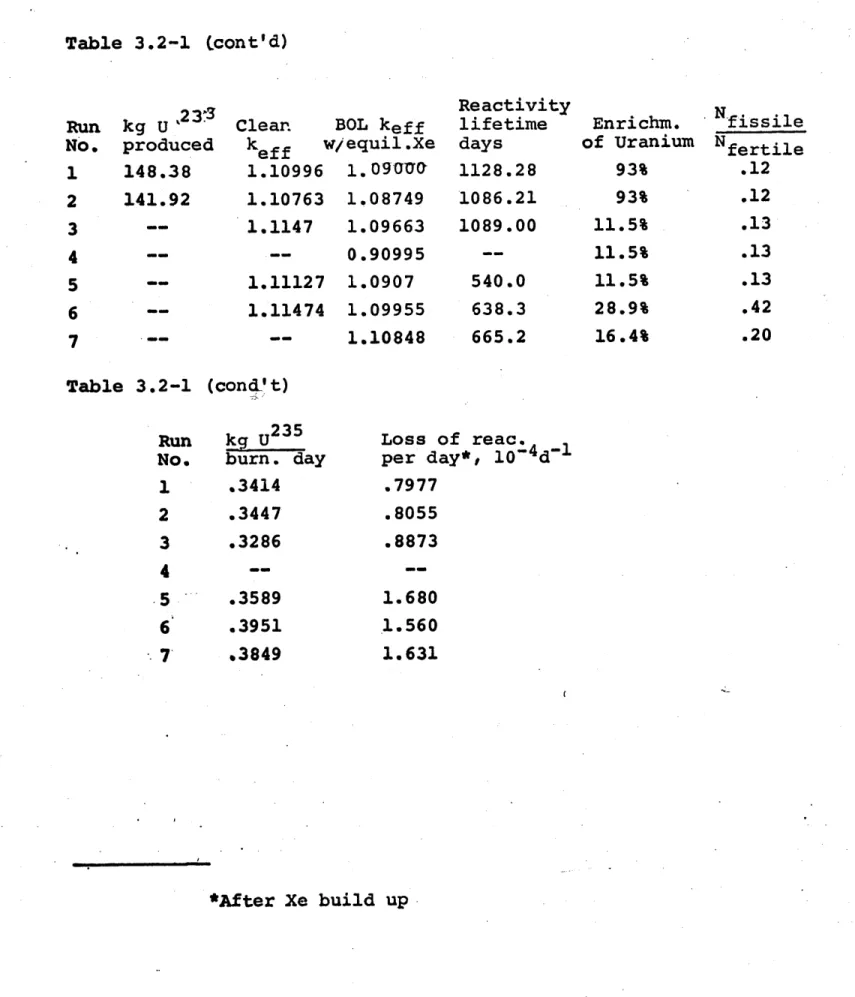
3.2 Results Obtained 82
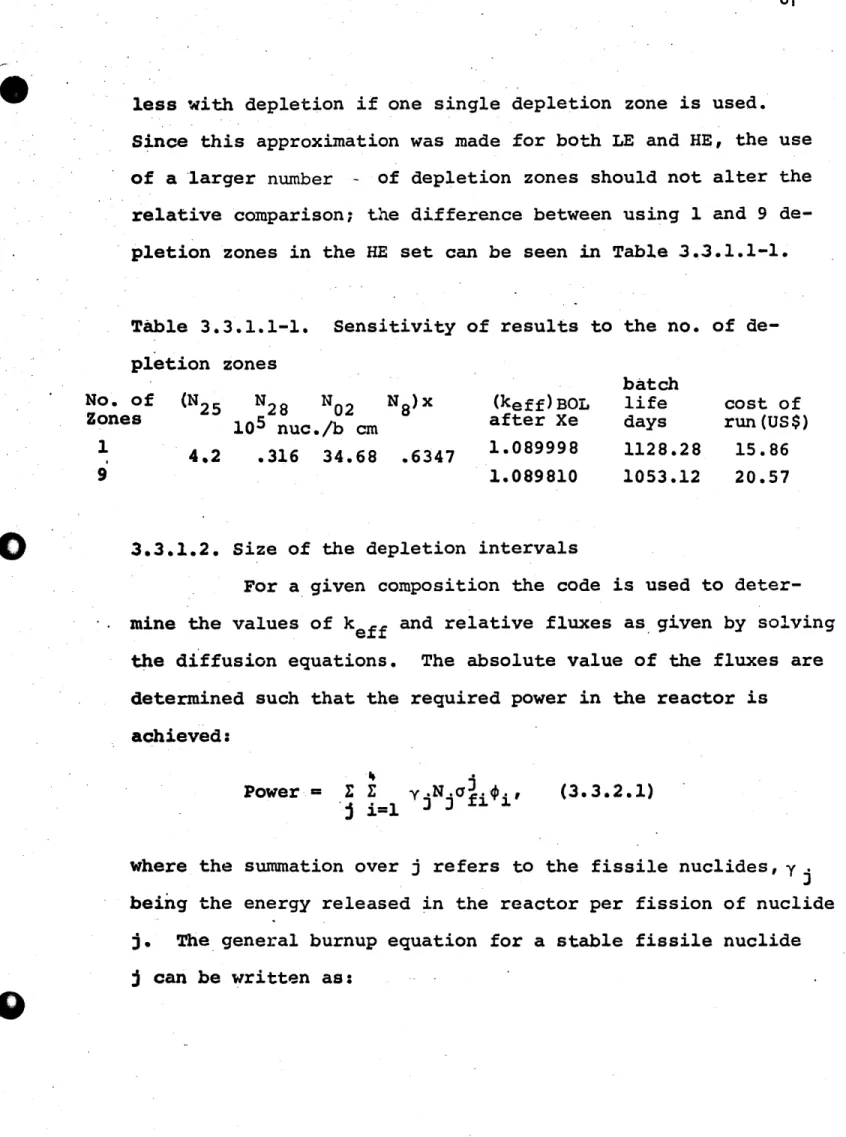
3.3 Sensitivity Studies 86
3.3.1 Individual Sensitivity Studies 86
3.3.1.1 Number of Depletion Zones 86
3.3.1.2 Size of the Depletion Intervals 87
3.3.1.3 Donscattering Matrix
89
3.3.1.4 Total Heavy Metal (1H4) Content 91
3.3.1.5 Self-Shielding Factor 92
3.3.1.6 Leakage 93
3.3.1.7 U2 3 5 and Natural B cs 93
3.3.1.8 Fission Products (FP) Build-up 95
3.3.1.9 Carbon-to-uranium (c/u) Ratio 96
3.3.2 Global Effects of the Sensitivity Studies on the
HE vs. LE Comparison 97
3.4 Fuel Cycle Economic Evaluation
101
3.5
Conclusions
116
CHAPTER 4 FUEL PARTICLES DESIGN 117
4.1 General Coated Fuel Particle Information 117
4.2 Particle Failure Mechanisms 124
4.2.1 Mechanical Failure 124
4.3 Fuel Specification 132 4.3.1 Homogeneous vs Heterogeneous Particle Systems 132
4.3.2 Coating Selection 135
4.3.3 Kernel Composition 136
4.3.4 Preliminary Particle Design 137
CHAPTER 5 HTGR/GT NUCLEAR DESIGN 142
5.1 Introduction 142
5.2 Control Rod (CR) Configuration Studies 153
5.3 Unrodded Composition Optimization 158
5.3.1 Preliminary Studies 158
5.3.1.1 Discussion of Reference Design 1 (RD1) and RD2 159
5.3.1.2 Parfait Configuration 166
5.3.1.3 Lumped Burnable Poison (LBP) Optimization 172
5.3.1.4 Preliminary Conclusion 177
5.3.2 Detailed Design Studies 177
5.3.2.1 Reactivity Lifetime and CR Requirements 180
5.3.2.2 Maximum nvt 180
5.3.2.3 Maximum Burnup 185
5.3.2.4 Maximum Fuel Centerline Temperature (T
)
1875.3.2.5 Other Considerations 188
5.3.2.6 Summary and Conclusions 188
CHAPTER 6 REACTOR VESSEL AID INTERNALS 193
6.1 Reactor Vessel Choice 193
6.1.1 Discussion 193
6.1.1.1 Safety Analysis 216
6.1.1.2 Cost Comparison 223
7
*6.1.2 Conclusions. 224
6.2 Vessel Internals 225
6.2.1 Vessel Wall Temperature and Thermal Stress 229
6.2.1.1 Temperature Distribution 232
6.2.1.2 Thermal Stress in the Vessel Wall 237
6.2.2 Reflector Design 238
6.2.3 Control Rod Drive Specifications 244
6.2.4 Core Orificing .247
CHAPTER 7 SU10MARY, CONCLUSIONS AND RECOMMENDATIONS 255
7.1
Summary and Conclusions 2557.2
Recormmendations 265APPENDIX A CALCULATIONS NECESSARY FOR THE PREPARATION OF SOME
IMPORTANT COMPUTER INPUTS 266
A.l Calculations for the Preparation of the CITATION Input
to Obtain the FSV Power Distribution per Region 266 A.2 Calculations for the Preparation of the CITATION Input
to Obtain the FSV Relative Axial Power Profile 286 A.3 Calculations for the Preparation of the CITATION Input
to Obtain the FSV kff vs Time Curve 290
A.3.1 FP Yields from Fission 290
A.3.2 Decay Constants and Nuclide Chain Specifications 292 A.3.3 CITATION Resonance Shielding Correlation 296
A.3.3.1 FSV Depletion Runs Comparison 29T
A.3.3.2 HTGR/GT Reference Design 298
APPENDIX- B COMPUTER CODES EMPLOYED 301
B.1 CITATION 301
B.2 ANISN 432
B.3 2DB 435
APPENDIX C SOME TRIALS TO ADJUST LE cs TO REPRODUCE HE RESULTS
IN RUNS WITHOUT Th2 3 2 AND U2 3 8
444
APPENDIX D SYMBOLS AND ABBREVIATIONSBIOGRAPHICAL NOTE 451
9
LIST OF TABLES Table Number 1.2-1 2.1-1 2.1.1-12 2.1.1.1-12. 1.1. 1-2
2.1.1.2.1-1 2.1.1.2.3-1 2.1.1.2.3-1 2.1.1.2.3-2 2.1.1.23-3 2.1.3.2-12.1.3.2-2
2.1.3. 3-1
202-1 2.2-2 3.2-1 3.3.1.1-1 TitleComparison of FSV and HTGR/GT Core Design Parameters
Steps in a Core Design
Thermal Group cs's Changed for the Different c/u
Energy Structure of the HE and LE 4-group cs sets
Nuclides in the HE and LE cs sets N/S/4V for FSV and Dragon
Downscattering cs check up
Depletion Results without U2 3 8 and Th2 3 2 Percent Absorption in LE and HE runs without U2 3 8 and Th2 3 2 after 770 days (Initial
Conc. of Table 2.1.1.2.3-1)
Depletion Results without U2 38, Th2 3 2 and Natural B
Radial PowcrIstribution and k
Comparison with GA Values from ig. 2.1.3.1-1 Nuclide Atomic Densities per Zone in
Fig. 2.1.3.2-2, 1o-5 atoms/bcm
Power Production in the Upper and Lower Halves of the FSV Core
Nuclides Atomic Densigies per Zone in Figure 2.1.3.3-2, 10' atom/bcm
Energy Structure of the 22 Neutron Groups and 18 y Groups used in the ANISH Runs HTGR/GT Composition and Neutron Source for the ANISN Calculation of the Neutron and Fluxes in the Vessel Wall
HE vs. LE Comparison
Sensitivity of Results to the No. of Depletion Zones
19
27
31
34
34
37
40 42 5155
55
6o
68
7183
87
3.3.1.5-1
3.3.1.
5-2
3,
3.1.7-1
3.3.1.9-1
3.3.2-1 3.4-1 3.4-23.4-3
3.4-4
3.4-5
3.4-7
3.4-8
4.1-1
4.2.2-1
4.3.4-1
4.3.4-2
5.1-1
5.2-1Sensitivity of HE Results to a 25% Error in a02
Sensitivity of LE Results to a 1.2% Decrease in a2 8
a3
Comparison of Several Modified LE Runs with HE
Sensitivity to Carbon-to-Uranium (c/u) Changes in the HE cs Sets
HE cs Set Evaluation in Ref. 32 Ground Rules for Economic Analysis Fuel Cycle Parameters for High and Low Enrichment Fuels
Fuel Cycle Parameters.
Payment Schedule for Government-Owned Basis
HTGR Fuel Processing Costs as a Function of Unit Rating
HTGR/GT Fuel Cycle Costs for High and. Low Enrichment Fuels
HTGR/GT Fuel Cycle Parameters after Optimization
HTGR Fuel Processing Costs
Fuel Particle Parameters and Design Limits in Several HTGR Designs
Velocity of Migration and Required Buffer Layer Thickness for Several T% Values and a 4.8 years Residence Time
Average Burnup Calculation for the HTGR/GT Coated Particle Design Specifications for Dragon and for the HTGR/GT
Average Values of the Fast Flux in the Core for Several Cases
Summary of the CR Configuration with
N
2 5 = 2.92, "128 = 0.220, No2 = 36.06 and NB = 0.4417 (10-5 atoms/bcm units) 9293
94
97
99
102 105108
109
110 111 113 114 120 131139
141148
155
502-2
5.3.1.1-1
5.3.1.1-2 503.1.1-3 503.1.2-1 5.3.1.2-25.3.1.2-3
503.1.3-1
5.3.2-1 5.30.2-2 5.3.2.2-15.3.2.3-1
5.3.2.4-16.1.1-1
6.1.1-2 6.1.1.1-1 6.2-1 6.201-1 6.2.1.1-1 6.2.2-1Summary of CR Configuration with N
=
0.1218 x 10~ atoms/bcm and N given in the table.Atoms Densities (in 10-5 atoms/bcm) per Zone in RD1, RD2 and PARFl
Point Power Density (w/cc) in the RD1 Central Column)
Comparison of T for RDi as Calculated by Eqs. 5.1-7 and .1-10 and as Computed by HEATING-II
PARF2 Composition in 10-5 atoms/bcm Units PARF2 Power Density Distribution in w/cc PARF2 T Profile in the Hottest Channel at BOL and after 1330- days
LBP Configurations for N2 5 4.200 x 10⁻⁵ atoms/bcm
Final Reference Design (FRD) Input Characteristics
FRD Trials
Maximum First Group Neutron Flux Averaged in Time (max. ave. *
)
for FRD6, FED7 and FRD8Maximum PD Averaged in Time (max.ave.PD) for FRD6, FRD7 and FRD8
T Profile Calculation for FRD6, FRD7 a d FRD8 at the Hottest Channel at BOL HTGR Plant Parameters
Summary Description of Small HTGR's
Factors affecting the HTGR/GT Blowdown Accident Maximum Allowable Stress Values in Tension for Carbon and Low-Alloy Steel, in Pounds per Square Inch, Class UCS
Properties of Low Allow Steel SA 302 Gr.B Determination of Y Power Density at Internal Vessel Wall from ADISN Output Data
Parameter Values for Conditions in the Core and Reflector 11
155
161167
169
169
171175
179
181183
186
189
197
217 222 226233
234 241A.1-1 A.1-2 A.1-3 A.1-4 A.1-6 A.l-7 A.3.1-1 A. 3.2-1 A. 3. 3. 1-1 A.3.3.2-2 C-1 C-2 C-3
Adjusted Fuel Loading, Initial FSV Core
FSV Depletion Input and Results Obtained by GA with SCANAL
LBP Specifications for FSV Design that Produced Fig. 2.1.3.1-1
Four Group CR Homogenized Absorption es Values of ni and T
Atom Densities per Region in FSV Radial Power Distribution and k ff
Comparison with GA Values from 'ig. 2.1.3-1 Stable and Long Lived Fission Products (FP) Yields from Fission
Decay constants in sec 1
aa as Calculated by GA Equation and CITATION Resonance Shielding Correlation Calculation of aax and N* for 3 Groups of Zones of Fig. 2.1.3.3-2.
Some Important cs from the LE and HE sets Depletion Results for LF2 Without U2 3 8 and
Thz3 2, Using the Natural B Absorption cs as Given by Eq. C-1
Neutron Spectrom at BOL for Several Compositions and cs's
va25/a25 for LE and HE
267
269
271 272276
280 282 291295
299
299
445
445
447
447
LIST OF FIGURES
Figure Number Title
1.2.1-1 Horizontal Section Through the HTGR/GT Core
1.2.1-2 Fuel Element Design
1.2.2-1 HTGR/GT Core Arrangement
2.1.1-1 Effective Uranium-235 Thermal Fission Cross Section
2.1.1.2.1-1 Effective Thorium Absorption Cross Section in the Resolved Energy Range (17.6 to 961 ev) 2.1.3.1-1 FSV Relative Power Distribution per Region 2.1.3.1-2 FSV Fuel Region
2.1.3.1-3 FSV Core Cross Section View
2.1.3.2-1 FSV Rodded Axial Power Distribution at BOL, 13 Control Rod Pairs Completely Inserted 2.1.3.2-2 FSV Core Representation in RZ Geometry 2.1.3.2-3 FSV Relative Axial Power Distribution
Obtained at MIT
2.1.3.3-1 FSV k vs Time Curve for the Unrodded Core 2.1.3.3-2 FSV Core Representation in RZ Geometry for
CITATION Depletion Runs
2.1.3.3-3 FSV kef vs Time Curves Obtained at MIT 2.1.3.3-4 Chain Specifications for Pm, Sm and En 2.2-1 Typical Charpy-V Notch Impact Data for
Irradiation A-302 B Steel
2.2-2 Effect of Irradiation Temperature on Transition Temperature Increase for an A-302-B Reference Steel
2.2-3 HTGR/GT One Dimensional Representation for
the ANISN Input Preparation
2.2.1-1 Fast Flux Distribution in the Vessel Wall for the 20% Porosity Reflector Case
13
20
21
23
32
38
48
49
50
53
54
5T
58
59
61
62
70
75
3.1-1
3.3.1.2-1 4.1-14.1-2
4.2.1-1 402.2-1 5.2-1 5.3.1.1-15.3.1.1-2
5.3.1.1-3
5.3.1.1-4
5.3.102-1503.1.3-1
5.341.3-2
5.3.2-1
5.3.2.1-1
5.3.2.4-1
Model for HE and LE Fuel Comparison Error in U-235 Fuel Requirements due to Finite Number of Time Steps in Depletion Calculation
Typical Dimension and Compositions of a coated fuel particle
BISO and TRISO coating Characteristics Coated Particle Mechanical Performance Diagram
Kernel Migration Coefficient, KMC, as a Function of Temperature for Several Fuel Compositions
HTGR/GT 1/4 of Core Representation in XY Geometry for the Preparation of a CITATION Input
HTGR/GT RZ Representation for the CITATION Input to RD1, RD2 and PARFl
Effect of LBP in the Bottom. Reflector on, the Core Fuel Centerline Temperature
Keff versus Time Curves for RD1, RD2 and PARF2 Model to Illustrate the T Grofile
Calculation for RDl Using qs. 5.1-7 and
5.1-10
HTGR/GT RZ Representation for the CITATION Input to PARF2
HTGR/GT Core in RZ Geometry for the LBP Optimization Runs
Unrodded kerf versus Time Preliminary Curves HTGR/GT RZ Representation for the FRD
CITATION runs
Unrodded k versus time curves for FRD6, FBD7 and F9
Curves of TL at the Hottest Channel for FRD6, FRD7 and FRD3
80
90
118
122
125
129
154
160
163
165
170
178
182
191
15
6.1.1-1
Vertical Section of Peach Bottom
196
6.1.1-2
The FSV Reactor Arrangement
215
6.2-1
Coolant Flow in the HTGR/GT
228
6.2.1-1
Radial Temperature Profile in the
Insulation and Vessel Wall
231
6.2.4-1
HTGR/GT Radial Power Profiles as Used in
Ref. 8T
249
6.2.4-2
FRD8 Radial Power Profiles at the Hottest
Row
252
A.1-1
Composition 13 Location on the FSV Core
268
A.1-2
FSV Core Representation in XY Geometry for
CITATION Input
274
A,3,-3
Dimensions of Regions at the Core-Reflector
Interface in FSV XY CITATION Representation
275
CHAPTER I INTRODUCTI CN I.1 Foreword
Since June of 1974, MIT has been engaged in a sponsored research to develop a conceptual design of a small (,ZOO MIth) High Temperature Gas-cooled Reactor (IITGR) total energy system for the U. S. Army. The
ground rules of the conceptual design state that the system is to start supplying both heat and electricity for large Army bases by 1985. This thesis project constitutes the part of the design research dealing with the reactor and with emphasis in the nuclear design. The design is
described in sufficient depth to permit its use by the contracting agency as the basis for discussion with a reactor vendor.
As explained in Chapter 5 of the final report dated May 1975 (Ref.82), it was decided at the outset to specify Fort Saint Vrain (FSV) type fuel
for the LITGR/GT(*) unit. The same practical reasons leading to this decision, i.e., commercial procedure and industrial base helped narrowing the options for the fuel-cycle and particle design. An essential feature of this ITGR/GT nuclear design is the fact that the Army does not pay
carrying charges on their fuel; the optimum refueling interval becomes the longest possible, because, that minimizes shut down periods and consequently the fuel cycle cost of the plant.
By using nuclear methods and cross sections developed and validated
by GA for. the FSV core (modified to account for the H1TGR/GT smaller carbon-to-uranium ratio) a reference design was developed for a 300 MTth HTGR batch
(*)Iligh Temperature Gas-cooled Reactor/Indirect cycle Gas-Turbine (see Ref. 32).
core with enough reactivity for
4.8
full power years (6
calendar years
assuming a 0.8 load factor).There follows a summary description of' the HTGR/GT reference design and the organization of this report.
arrangement and fuel element
are of the same basic design as in FSV.
Table 1.2-1 gives a comparison of the important design and performance
parameter in FSV and in the HTGR/GT.
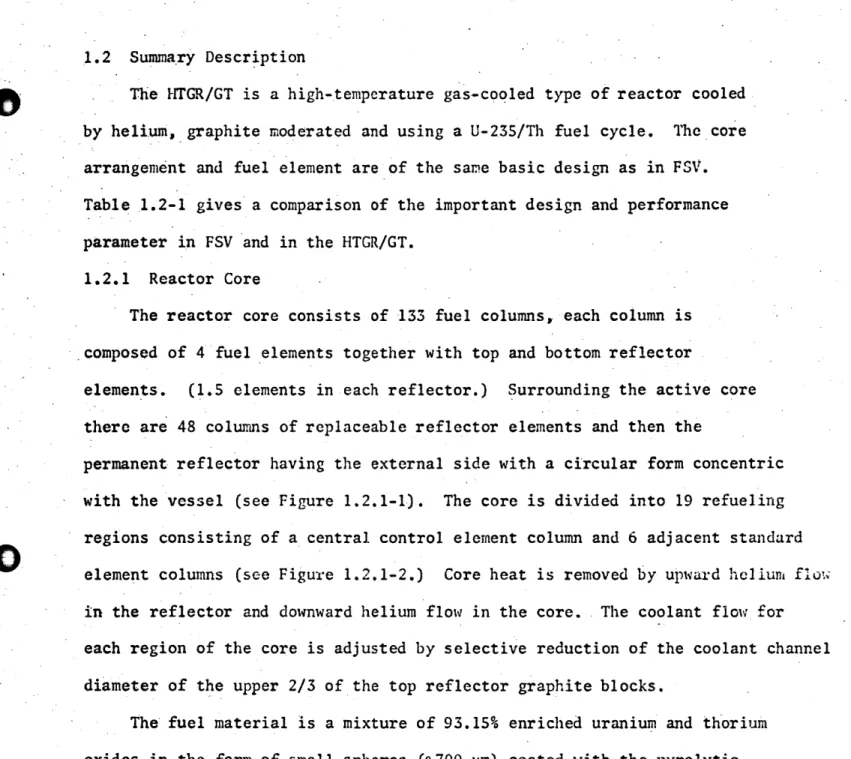
1.2.1 Reactor Core
The reactor core consists of 133 fuel columns, each column is
composed of 4 fuel elements together with top and bottom reflector
elements. (1.5 elements in each reflector.)
Surrounding the active core
there are 48 columns of replaceable reflector elements and then the
permanent reflector having the external side with a circular form concentric
with the vessel (see Figure 1.2.1-1).
The core is divided into 19 refueling
regions consisting of a central control element column and 6 adjacent standard
element columns (see Figure 1.2.1-2.) Core heat is removed by upward helium
flow
in the reflector and downward helium flow in the core. The coolant flow for
each region of the core is adjusted by selective reduction of the coolant channel
diameter of the upper 2/3 of the top reflector graphite blocks.
The fuel material is a mixture of 93.15% enriched uranium and thorium
oxides in the form of small spheres (n.700 ym) coated with the pyrolytic
carbon and silicon carbide. The fuel particles are bonded together with a
graphite binder to form fuel rods. The fuel rods are stalked and sealed
in individual fuel holes in the graphite elements. The number of fuel
and coolant holes in the elements is summarized in Table 1.2-1 and the
matrix arrangement is shown in Figure 1.2.1-2.
19
TABLE 1.2-COMPARISON OF FSV AND HITGR/GT C
Reactor core output, .I(Th) Core dimensions, dia/ht,ft Number of fuel elements/columns Primary coolant flow, 10 lbs/hr Primary coolant inlet pressure, psig Avg. coolant temp., reactor inlet, *F Avg. coolant temp., reactor outlet, *F Core orifices
21
Maximum fast fluence(E>0.18 Mev)10 nvt Avg. power density, watts/cc
Fuel life, full power years Number of refueling regions Element (hexagonal prism):
across flats/length, in
Fuel holes per element, std/control Fuel hole diam., in
Coolant channels per element, std/contro Coolant channel dia., in'
Reflector thickness, cm. top/bottom/side
Max. fuel burnup, W1D/T
Max. fuel centerline temperature, *F
1
ORE DESIGN PARAMETERS FSV 851 19.5/15.6 1482/247 3.39 0 688 762 1445 37 variable 3 fix 8 6.3 4.8 37 Ba HTGR/GT
300
14.3/10.4
532/133 .8 x 2 = 1.6 394 953 1500 ed orifice zones 8 6.34 4.8 tch refueled 14.17/31.2 210/120 0.5 108/57 0.625 118.9/118.9/135.9 118.9/118.9/73.2 100,000 106 x10"
2300 2100(tdPLACEA8LG RtFL6~CTc
CONTROL ROD PAIR
F/6. /.2./-|
H76 /6r coes
010
ii
C
$UEL#R~b~iW ROLEt 'W14.17
'
.
FVV-L 1NAMbD/N60Q0
0
0 0 0 00000
O0 0 0 P0/SO0 PCISONCQNe PO'E4vfiriC~qL SeCrION TNRou6N.
sLocA
SAWV$N-Iff-C P&SIRSWC4/0 #I~~o#V70T4 S-/O T1.6 81.oc M0
r~) H
P/ 6. 1.2.
C4RM5Nr DSSI*Alreflector and boronated shield, and the core lateral restrain structure (see Figure 1.2.2-1).
Each refueling region is supported by a single graphite core support block (see Figure 1.2.2-1), which is, in turn, supported by
three graphite posts. The top and bottom ends of the posts have spherical seats to allow for difforential horizontal movement.
The permanent side reflector is composed of graphite blocks shaped to make the transition from the removable hexagonal reflector blocks to the circular form of the thermal shield, insulation and vessel walls. The reflector's function is to reduce core neutron leakage and the fast
flux and gamma exposure of the reactor vessel.
The thermal shield is a metal-clad boronated graphite assembly. immediately surrounding the permanent side reflector; its function is to reduce the thermal neutron flux to the reactor vessel. The insulation function is to- maintain the steel vessel wall temperature below 700*F.
The core lateral restraint structure has evenly spaced spring assemblies which span the thermal shield and the vessel walls. The spring assemblies keep the mass of graphite in the core, the core support floor, and the permanent side reflector firmly located in the core cavity. They also diminish the effects of seismic impact loads.
1.2,3 Reactivity Control Systems
Reactor control is provided by 62 control rods, (CR), operated in pairs by 31 control rod drives. The drives are located above the center
23
sib$ ROE6Pl.c-rOe 'oYeX&O19
TOP R~REFCT~t-l. H16 // a 0 T 70-T/OA' rYPC#9Z F4E6MCH T -Cot?&c'9 6QL<: Sa~e PosT s(trg /Afs*E'R7" CoeE SUPPORT? 840C*'s A' r c/ -e mNE-7N
FIC'. /..Z.Z-/
The flexible cables and drumm employed in FSV are not adequate in a steel vessel design where blowdown conditions are much more severe than in PCRV design and the higher coolant velocities could damage the CR driven by flexible steel cables (see Section 6.2.3). Each individual CR is composed of articulated segments, each consisting of a metal
container filled with boron carbide dispersed in a graphite matrix. A manually actuated reserve shutdown system, utilizing boronated graphite spheres, is provided for back up shutdown capability. The spheres, which arc contained in hoppers located in the refueling
penetrations, are released into a channel in the control element column
by rupture discs actuated by gas pressure. The reserve shutdown system is sufficient by itself to shut down the hot operating reactor to room temperature without the use of control rods.
25
1.3 Organization of this Report
This thesis project constitutes the part of the HTGR/GT design
research dealing with the reactor and with emphasis in the nuclear
design. It is organized in the following manner:
Chapter 1:
This report is introduced.
A summary description
of the final design is given.
Chapter 2:
The codes and calculational methods
used are
introduced
and evaluated.
Chapter 3: A model is established for comparison between the
High Enriched Uranium (HE) and Low Enriched
Uranium (LE)
fuel bat'ches
.The resul'ts favoring
HE are checked against possible errors; sensitivity
studies are made.
Chapter 4:
The possible particle failure mechanisms and the
HTGR/GT performance requirements are discussed.
An accessment for a possible particle design is
attempted.
Chapter 5:
The nuclear design of the core is described and
discussed in greater detail.
Chapter 6:
Steel and prestressed concrete reactor vessel (PCRV)
are compared.
The internals design
are
discussed.
Chapter 7: Conclusions and Recommendations.
CHAPTER 2
CALCULATIONAL METHODS AND EVALUATIONS
The major emphasis of this thesis research project was on the core design; for that reason this chapter is divided in two sections: the
first dealing with methods for the design of the core and the second with methods used outside the core.
2.1 Core Design Methods
The core design of a nuclear reactor is not a straightforward matter. It requires several interrelated steps in an iterative manner. Ideally one could identify the steps as in Table 2.1-1 (over simplified), but in practice not all the iteration can be included in order to speed up the results and be able to produce a reference design in a one year time required. For the HTGR/GT core design the following steps were made
(organization by sections inside brackets).
1. Several fuel type possibilities were examined; the High Enrichment (HE) with thorium as a fertile fuel and Low Enrichment (LE) with U2 3 8 as the fertile fuel were selected for further investigation (see Chapter 3).
2. Two 4 group cs sets were obtained (see Section 2.1.1), one for HE and another for LE studies.
3. Two burnup codes were used at the initial stages of the HE vs LE comparison: CITATION (Ref. 10) and 2DB (Ref. 22). CITATION was found to be prefered (see Section 2.1.2).
The abstracts and some input examples for those codes can be found in Appendix B.
27
TABLE 2.1-1
STEPS IN A CORE DESIGN
1. Identify suitable fuel cycles.
2. Obtain a cross section (cs) set for each of the fuel cycles.
If using a small number of groups, 4 for instance, the cs sets will be quite sensitive to nuclides concentration (iterative), fuel rods size etc.
3. Choose a burnup code.
4. Establish a model for comparing the fuel cycles
5. With the help of the developed cs set and burnup code analyse
the fuel cycles with the established model.
6. Study the sensitivity of results to possible errors in the-cs sets or changes in the model. Decide in favor of one of the fuel cycles for more detailed analysis.
7. Optimize the core design for the chosen fuel observing the performance limits of the coated fuel particles (see Chapter 4).
the same initial fissile inventory 11E was shown to produce a higher reactivity lifetime (see Chapter 3) and chosen for more detailed analysis.
5. Some detailed calculations were made to compare the
calculational methods with GA methods and experimental results. The FSV HTGR core design was used for the comparison and the GA results were reproduced within a very small error by using
the 4 group HE cs set and CITATION (see Section 2.1.3).
The successful completion of this step was taken to be proof that the calculational methods could be used for the detailed HTGR/GT core design optimization (Chapter 5).
2.1.1 Cross Section Sets
Ideally a cs set for each fuel type should have been obtained, but in practice that would have been too time consuming. In the HE case the only code available at MIT, the GGC-3 (Ref.101) is written for a UNIVAC machine and is not operable at MIT's IBM (several months would have been necessary to debug the code). In the LE case there are several codes available to obtain few group cs set: LEOPARD (Ref. 88), LASER (Ref. 89) and ANISN (Ref. 79). These codes can not be used for HE fuel because the resonance region for Th2 32 is different from that of U2 3 8 and the energy
structure in them, chosen for good reproduction of U2 3 8 neutronic properties, is not adequate for Th2 3 2,
29
Thanks to the cooperation of personnel from Dragon and GA "right from the shelve" LE and HE cs sets were available. Those cs sets were not completely appropriate to the IITGR/GT design; they were obtained for the fissile contents (or c/u ratio) typical of 1 year refueling intervals. Nevertheless they were acceptable for a preliminary design and the HE vs LE comparison described in Chapter 3 was carried with them. This approach was chosen forthe most efficient use of the given time.
The HE fuel proved better than the LE one as expected from a
previous bibliographic survey (Refs. 12, 48, 51 and 52) and the comparison is shown to be meaningful in section 2.1.1.2 , despite its anavoidable inconsistencies.
The comparison was made then with:(a) the cs sets, at operating terperature, typical of- 1000 i WIe Dragon Project for LE and FSV (c/u=4000) for HE, see Section 2.1,1.1;(b) use of unselfshield natural B burnable poison in both cases; (c) unrodded single zone representation of the core in RZ geometry.
After the choice of the HE fuel, the following improvements were made on the HE cs set:
1. Correction for the !!TGR/GT lower than FSV c/u ratio
The range of c/u ratios needed for the HTGR/GT batch studies goes from about 1200 to 2200. By inspection in the HE s.ets for c/u = 5000,
and c/u = 4000 it was observed that the changes in cs for groups 1, 2 and 3 (fast groups) is very small or non-existant for all nuclides except for Th in the 2nd group, but in this only case the change was caused by
and c/u = 4000 sets (changing the self-shielding factor);no changes. were thought to be necessary then for groups 1, 2 and 3. It was also observed
that there is an approximately 5, decrease in the thermal group cs (group 4) with the 20% decrease in c/u ratio (from 5000 to 4000) due to the spectrum hardening.
At first without available information a new set of thermal
group cs at operating temperature was obtained by linear extrapolation to c/u = 1370 (see Table 2.1.1-1) and some runs with sensitivity purposes - were prepared with those extrapolated cs (Chapter 3).
Some time later Dr. Marshall was consulted about this procedure and he offered to send an additional cs set for the range of c/u ratio needed for the HTGR/GT batch studies. No changes were necessary for groups 1, 2 and 3 and the changes for group 4 are summarized in Table 2.1.1-1. The
a25 could always be taken for any c/u value from Fig. 5 of Ref. 26 f4
(ieproduced here as Fig. 2.1.1-1). The cs used in the detailed design described in Chapter 5 were those recommended in Dr. Marshall's letter.
2. Use of lumped burnable Doison (LBP)
The B10 cs are used instead of those of natural B and a depletion varied self-shielding factor is applied (Section 2.1.3 and Chapter 5).
3. The control rod (CR) homogenized cs for FSV
The CR homogenized cs for the two types of CR used in FSV were obtained from GA (see Section 2.1.3) and used in some CR configuration studies described in Section 5.2.
C
C
fisdion U235 capture U2 3 5 fission U2 3 3 capture U233 capture nat ,B capture Th232 capture B10 135 capture Xe capture 149 (*) By linear Ref. 38 cs at C/U=5000 193.409 36.5109 236.089 27.6037 295.187 2.68306 1490.91 9.65579x10⁵ 2.79655x10⁴ oper. temp. C/U=4000 184.431 34.9264 233.738 28.1339 284.048 2.56462 1434.64 8.94178x10⁵ 2.60679x10⁴ Our estimate hot C/U=13~1 160.828(*) 30.7607 227.557 29.5278 254.764 2.25324Dr. Marshall's letter for C/U=1800
room temp. oper., temp.
186. 158. 34.35 29.93 33.39 29.81 2.600 1457 1.028x10⁶ 2. 892x104 2.190 1257 .6645x106 1.987x10⁴
this value is 151 barns TABLE 2A1.1-1
THERMAL GROUP CS'S CHANGED FOR THE DIFFERENT C/U
Os. ,w. S 1% 'Ii ~2 'EI It,
~
'Sew~
U.) 59t.)MIODERATOR 409oo'\
Flo.
2.1.1- 1
C9R8lom?0w-veANiub1
A-om
beWsItaY Riarlo
i 'g1,9
uFrecrive
UP901
3
LAJ
I')
TftIgtlAL
pISSlON'
Ci~oXS
S~cl-io4'
7.1I
r-* .6
.1.4
~2.2
L-.2.0
I-1.4 L
5000
r#iEqm*t.33
The following is a description and an evaluation of the two cs
sets
as used in the comparison in Chapter 3.
The sensitivity of
results
to
errors in the sets is also studied in Chapter 3.
2.1.1.1
Description of the cs sets
HE
cs set:
The HE cs set (Ref. 38) is a 4 group set for 2 c/u ratios (5000 with
(N
rd
=1.25 x
10-
atoms/bcm, typical of Fulton and 4000 with (NThrod
=1.5 x 10⁻³
atoms/lb
c
,typical of FSV at 300*K (room) and at 1060*K
(operating).
The
structure of the groups is compared to that of the LE
set
in Table 2.1.1.1-1 and the nuclides included are compared to those
included
in the LE set in Table
2.1.1.1-2.
The set was generated at GA
by the code GGC-5 using basic data from a
GAM data tape for fast
group
and
a GATHER data tape for the thermal (Ref. 26).
LE cs set:.
The LE cs set is a 4 group set for a typical mid-cycle composition
for the 1000
1,11
dragon project at operating temperature. The energy
structure of the groups and the nuclides included are summarized respectively
in Tables 2.1.1.1-1 and 2.1.1.1-2.
2.1.1.2
Evaluation of the cs sets
For a meaningful comparison between IE and LE the two respective cs
sets must be equivalent .or near equivalent.
The sense of the word
"equivalent" employed here will become clearer as the reader progresses
through this section.
TABLE 2.1.1.1-1
ENERGY STRUCTURE OF THE HE AND LE 4-GROUP
CS SETS HE E
>
.183 MeV 17.6 eV ( E < .183 MeV 2.38 eV < E ( 17.6 eV E < 2.38 eV LE E>
.183 Mev 961 eV < E < .183 MeV 1.86 eV < E < 961 eV E ( 1.86 eV TABLE 2.1.1.1-2NUCLIDES IN THE HE AND LE CS
Category Fissile Fertile Intermediate Other Structural Fission Products
Common nuclides Only i
2.35 239 241 232 U , Pu , Pu U , I 238 240 232 U , Pu Th , 239 233 236 242 237 10 U , Pu ,N ,nat B B C, Si, CREF ----95 99 103 131 135
Mo ,T , Rh ,Xe ,Xe NSAG23 133 143 15 147 148 Cs , Nd , Nd ,Pm. , Pm NSAG25 149 150 151 152 153 Sm ,Sm , Sm ,Sm ,Eu 154 155 Eu ,Eu n He 233 U2 3 4 Pa2 31 Only in LE 0,Dummy mat. 83 95 Kv ,Zr dummy 97 101 Mo , Ru 105 Pd105 Pd108 109 Cd13 131 133 Cs134 136 141 13 Xe ,Pr ,"r 144 146 -147 Nd ,Nd ,Sm 148 , 15 % 1% Sm ,d ,-d 157 3 Cd ,F" U~ ~ chain 410 Group 1 2 3 4 SETS
35
In the LE fuel most of the fast absorption is in the U2 3 8 resonance region and in the HE fuel it is in the Th2 3 2 resonance region. For that reason the cs for those two nuclides are-treated quite differently in the LE and HE cs sets. On the other hand if one performs a depletion calculation in a batch not having U2 3 8 and Th2 32 the results should be the sane if the two sets are equivalent.
With regard to U2 3 8 and Th2 32, their absorption cs are multiplied by a self-shielding factor (U2 3 8 in the LE and Th2 32 in the HE cs sets). The method used to determine the self-shielding factors must be shown to be equivalent in the two sets (see Section 2.1.1.2.1). The other point where an equivalence can be checked is the scattering matrix,
in which case Age theory consistency was tested. The results and comments for the performed tests are summarized in the subsections that follow.
2.1.1.2.1 Testing the Self-Shielding Equivalence
The equivalence test that follows is based on a semi empirical method to predict resonance self-shielding of heavynuclides developed in
Ref. 60; from this Ref. 60, the effective resonance integral (RIeff) is given
by:-R ) -1/2
RI
eff=
[1 - f(Z,N)]RI + f(Z,N)RI o +(2.1.1.2.1-1)
Go S/4VJ
where:
f(Z,N) = .95 for U2 3 8 and Th2 32 (resolved fraction of the resonance integral),
r272 barns for U2 3 8 )
RI = ' Infinite resonance integral
77 barns for Th2 3 2) NR' -1/2
1 + = self-shielding factor applicable to the resolved part of the resonance integral,
R 3800 barns for pseudo resonance parameter,
N = nuclide number density (U238 or Th2 3 2) in the fuel rod, S = external area of the fuel rod, and
V = volume of the fuel rod
The values of RI eff and N/S/4V for FSV and Dragon are calculated in Table 2.1.1.2.1-1.
It can be easily shown that the resonance integral in a lethargy interval du is given by 64u. The self-shielding factors used in the LE and HE cs sets can then be checked against the values calculated in Table 2.1.1.2.1-1:
a) LE: The resolved resonance region of U2 3 8 is from 1.36 eV to 961 eV (Au = 6.25) which corresponds to g7roup 3 in the LU
238
set; the U abs. cs for this group (From R1f. 39) is
10.171 barns .'. Resolved part of RIeff = (10.171 barns)(6.25)
= 63.57 barns.
b) HE: The resolved resonance region of Th2 3 2 is from 17.6 eV to 961 eV (Au = 4) which corresponds to part of group 2 in the HE set; the Th2 3 2 abs. cs in this region can be taken
from Fig. 3 of Ref. 26 as 8.75 barns (see Fig. 2.1.1.2.1-1): Resolved part of
RT
= (3.75 barns )(4) = 35 barns.The values of RTIff for the resolved part of the resonance region used by GA and Dragon are larger than the ones given in Table 2.1.1.2.1-1 as calculated by the method in Ref. 60. The ratios of calculated values
37
Table 2.1.1.2.1-1 N/S/4V for FSV and Dragon
FSV Dragon
N, atoms/barn cm (T2 3 2 or U2 3 8) 1.5 x 10⁻³ 1.355 x 10⁻³
D, Fuel pin diam., in./cm .491/1.247 .551/1.4 N/S/4V = ND, atoms/barn 1.871 x 10⁻³ 1.897 x 10⁻³ Resolved part of RIeff, barns 29.36 53.87
RO~oqP
vosi
CROSS SEcT/ow /N?wf
r~'6so~vEt.~
u~ER6~' R~qMGf(/7~6
70'I~IeV)
10 '100 Avez 5TrICAN rMORqIVit #110" zewsiry (Atrovs/s cm) N JzQ a 10
Fort TEIIfP&EATr&EQ (Oft)
,ocoo
2
L
10.0
I, 'I ~8 0~~ '0 V 'a I., I, l..9.0
l
1.06.0
ok
S.039
are 63.57/53.87 = 1.18 for Dragon and 35129.36 = 1.192 for FSV. This comparison indicates that the self-shielding methods used by GA and Dragon are equivalent.
2.1.1.2.2 Testing the Scattering Matrix Equivalence
In a 4 group structure, only downscattering from group i to group i + 1 is considered in the scattering matrix. In this case Fermi Age Theory yields:
i,1i + 1 /hui asi (2.1.1.2.2-1)
Since C = .153 for carbon independently of fuel type or group, it can be written
ii+
1 Aul/asi)LE
ii +1
Aui/asi)HE
. (2.1.1.2.2-2)This equivalence is not verified for groups 2 and 3 (see Table 2.1.1.2.2-1). The reason is that Age thcory is not valid in energy ranges of strong
absorption. The LE resonances in group 3 and the LIE resonances in group 2 decrease the relative scattering probability making (ai,i + lAui/asi) < .153. In, group 1, that includes the source, (a1,2 Aui/as1) > .158 but the LE and
HE values are equivalent. The equivalence of the total effect of groups 2 and 3 can be approximately checked by collapsing them into a single group called (2+3) scattering to group 4:
AU1 a 1,1+1 a1,1 4.406 .1950 2.656 5.249 .1372 4.466 6.247 .0999 4.610 11.496 .0641 4.597 -- -- 4.700
aF Si Si (a 1 1,1+1U/a,ilAU i/ar Si
2.851 .3014 4.603 .1565 4.710 .1325 4.661 .1580 4.700 --AU 1 4.406 9.249 2.001 11.250 .1967 .0626 .3664 .0658 a1, 1 2.668 4.605 4.383 4.617 2.865 4.668 4.750 4.683 1,1+1 U / Si .3025 .1240 .1544 .1580 4.614 4.614 TABLE 2.1.1.2.2-1 DOWNSCATTERING CS CHECK UP LE 1 2 3 2 + 3. 4 HE o0
41
dE
a
(E)$,(E)dEi
a (E)--
0A.+a
A
2+3
s
2+3
s
E
0s2 AU
2 +3
3
(2.1.1.2.2-4)
s(2+3),4
d
AU2 + AU3
12+3 ()dJ2+3 E2 3
a(2+3) ,(2+3)= ~
as(
2+3) - '7(2+3),4(2.1.1.2.2-5)
The conclusion is then that the scattering matrices are equivalent
in the LE and
HE sets.
It is important to mention that a
mistake was found in the
HE
scattering matrix in Ref. 38.
In this
reference there is a complete
scattering
matrix for graphite
including upscattering
from group4 to 3;
in
Ref. 26
it was said that in
a 4 group structure GA did not use upscatterina.
Asked about this inconsistency
by the phone, Dr.Davison from
GA informed
that Ref. 38 was in error. For the reasons to be explained in Appendix B
an effective downscattering cs from group 2 to 3 was defined as
Ref.38
Ref.38
(2.1.1.2.2-6)
C023eff
23
+43
4
2),1
and a
4 3was eliminated. From.
the cs in Ref. 38 and using a typical
= .39:
-2
-3
-2
(a23)eff
=6.07321 x 10-
+ (4.69641 x 10-)
x (.39)
=6.25637 x 10
barns;
this is the value used in Table 2.1.1.2.2-1.
238
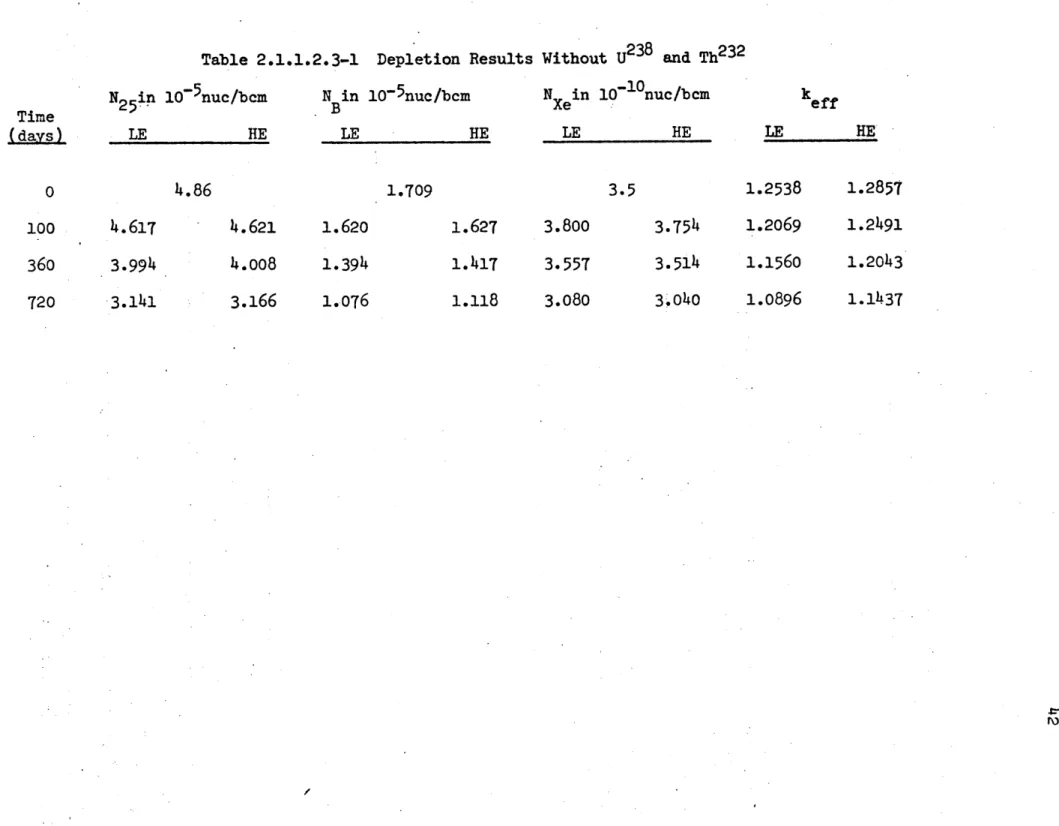
2322.1.1.2.3 Depletion runs without U
and
Th'
The use of depletion runs without U
238and
helped in the
detection of input errors in the initial' stages of the project.
The
final results of the CITATION runs are summarized in Table 2.1.1.2.3-1.
Table 2.1.1.2.3-i Depletion Results Without U2 38 and Th2 3 2 N2 5in 10-5nuc/bcm N in lo-5nuc/bcm N in lo0 nuc/bcm
LE B Xe LE __ HE LE HE LE HE
4.86
4.617
3.994
3.141 4.6214.oo8
3.166
1.7091.620
1.394
1.0763.5
1.627 1.417 1.118 3.8003.557
3.0803.754
3.514
3.0oo
LE HE1.2538
1.2069 1.15601.0896
1.2857 1.2491 1.20431.1437
Time (days) 0 100360
720This Table clearly shows that the two sets are not equivalent.
At BOL when only
U
235,
not B, C, Si and Xe are present, (kef)HE
-(eff)
=
+
0.03190; after 720 days of operation and with F.P. build up this
difference increased to
+
0.05409 despite the fact that the LE nat. B conc.
became lower than that of the HE set (the differences found in N
25and NxC
have a too small effect to be considered here).
The
use of constant with time nat. B abs. cs in
-the HE vs LE
comparison described in Chapter 3 (the B cstin the two sets were at
first thought to be averaged in time
effective valucsbut they were really
unself-shielded nat. B abs. cs) was a mistake.
If we neglect the small
abs. in B
the nat.
B abs. cs for group i is given by
B10
BNB10
0aiai = NB10 + ,
(2.1.1.2.3-1)
As B
1 0is
being depleted
it is obvious that a should decrease; the
ai
dorrect procedure, would have been to calculate
a
ai
from E3q. (2.1.1.2.3-1)
10and use always N
310 and a
in any depletion calculation.
The effect
of this mistake in the keff vs time curve can be seen in Fig. 2.1.3.3-3.
For the HE vs LE comparison this error is of little importance since both
types of run had it.
In
Table 2.1.1.2.3-2 the percent absorption
238
232
in each nuclide in the HE and LE runs without U
and Th
is shown.
It is probable that the nat.
B
absorption cst in the LE set are slightly
high (explaining (keff)LE<(keff)HE at BOL and (NB)LE
<(N
3)j
with
depletion) and that some differences in the FP treatments are responsible
for- the higher keff decrease rate with time in- the LE runs.
The depletion
238
232
runs without U
,Th
and nat. B (see Table 2.1.1.2.3-3)
present
TABLE 2.1.1.2.3-2
238 232
PERCENT ABSORPTION IN LE AND HE RUNS WITHOUT U AND Th AFTER 990 DAYS (INITIAL CONC. OF TABLE 2.1.1.2.3.-1)
% absorp. LE 57.49 2.90 0.79 21.63 0.85 0.40 1.69 1.26 % absorp. HE 60.68 2.81 0.69 22.46 0.79 0.43 1.84 1.60 2.25 0.76 FIS PRO-40 All others Total abs. in FP 0.33 10.55 16.03 7.94 12.14 TABLE 2.1.1.2.3-3 238 232
DEPLETION.RESULTS WITHOUT U ,Th AND
-5
N 25in 10 nuc/bcm LE .4000 N in 1010 xe, HE LE3.5
.2020 3.191 nuc/bcm HE LE k f HE 1.216168 1.198740 3.037 1.082805 1.108994 U235 U236 NP237 BORON CARBON SILICON XE148 SM149 XE133 NSAG25 0 Time (days) 0 NAT. B. .100
.. 2020i45
Even though the cs sets differ, as shown in Chapter 3, the difference favoring HE is larger than the inherent differences between the sets. Thus sufficient information was obtained to choose the HE fuel and
proceed with the HE set detailed adjustment, described in Section 2.1.3, for the final nuclear design described in Chapter 5. Nevertheless
several trials to adjust the LE cs to reproduce HE results were made. Some of those trials are important for the sensitivity studies and are described in Appendix C.
2.1.1.2.4 Conclusions
The.self-shielding of the fertile materials was found to be equivalent in LE and HE within the uncertainties of the method employed. The
scattering matrix can also be considered equivalent with due allowance for Fermi Age Theory lack of precision in the presence of neutrons sources or sinks.
The runs without U2 3 8 and Th2 3 2 and those without U2 3 8, Th2 3 2 and
nat. B can not be considered equivalent in the LE and HE sets. In part this inconsistency can be attributed to the fact that the spectrom in those
runs is very much different from the spectrum used to calculate the HE and LE cs sets. In fact, even for the complete runs the cs sets are not
completely adequate because the c/u ratio had been decreased in relation to that of the original sets to increase the reactivity lifetime. Anyway the difference found between the sets is smaller than the difference favoring the HE fuel.
2.1.2 Burnup Code
The burnup code completely adequate to our problem and operable at MIT is CITATION (Ref. 10). Because 2DB (Ref. 22) is an easier code to use and requires less memory it was decided to analyze the possibility of its employment.
Although the 2DB code is a code specifically written for fast reactor burnup calculations it could be used with some minor input tricks (see
Appendix B) in the preliminary static runs to determine range of compositions for the IITGR/GT. In the depletion runs there was a large difference between the 2DB and CITATION results. The reason was that 2DB uses a lumped
fictitious fission product, not having any provision for yields from fission. No input trick could be found to compensate for the absence of regular
fission products and the idea of using 2D was abandoned. CITATION was the code used in all burnup calculations included in this report.
2.1.3 Comparison with Some of GA Results on the FSV Design
After having established the calculational methods it is necessary
to determine how well they can be expected to calculate the power distribution and keff of the rodded core and the unrodded keff variation with depletion. The tools to be used are: CITATION, the four group .1E cs set (with
homogenized CR cs) and the CITATION resonance shielding correlation
(N'S = 10 in Section 000 for the LBP). It was decided to check these methods by trying to reproduce some of GA calculations for the FSV design;
specifically GA reference design 12 calculations were used for this check up. The calculations necessary to the CITATION input preparations are developed in Appendix A.
47
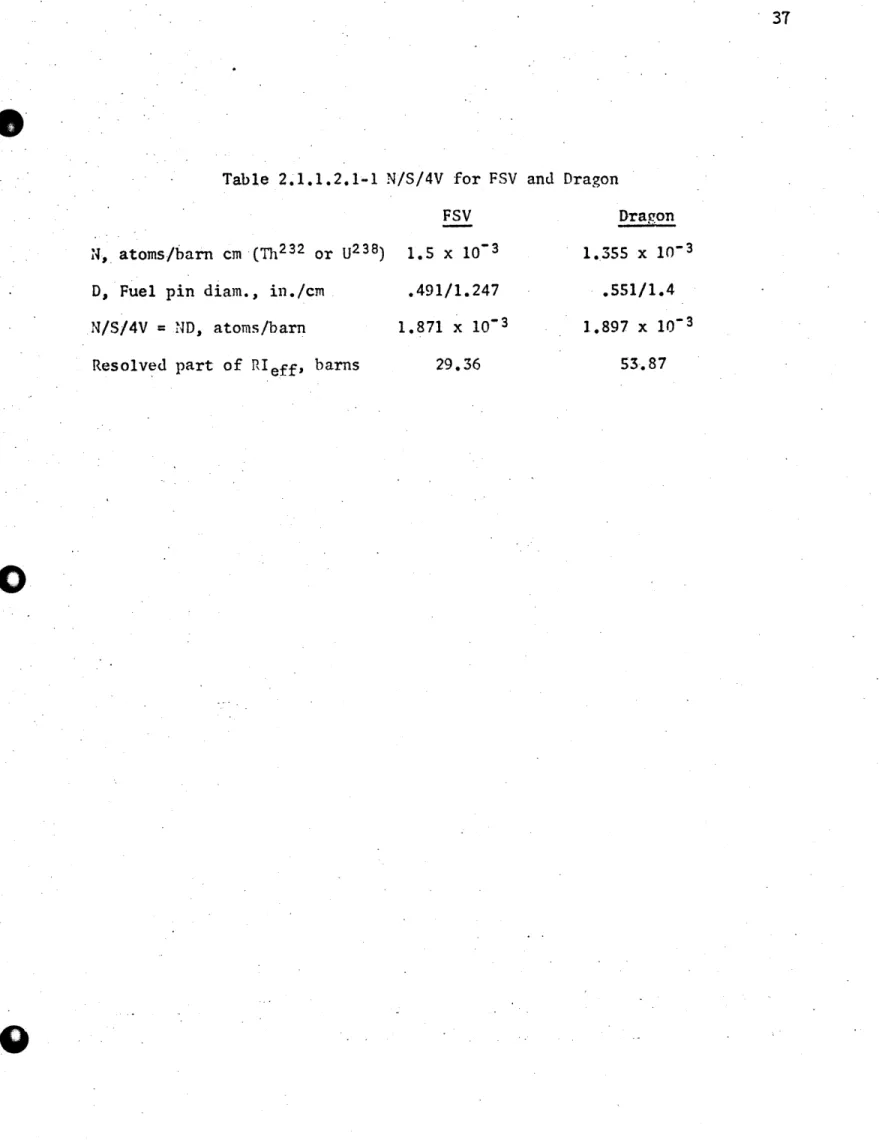
2.1.3.1 Relative Power Density Distribution per Region Comparison
The relative power density per region, represented in Fig. 2.1.-3.1-1, was obtained by GA for one certain 1M leading, CR configuration and lumped burnable poison (LBP) distribution as specified in Appendix A.l. Each
interior hexagonon in this figure represents a fuel region composed of seven hexagonal prisms as shown in Fig. 2.1.3.1-2. A more detailed cross sectional view of the FSV core, which has been used as the bases for the calculations, is shown in Fig. 2.1.3.1-3. It was possible to obtain the relative power density distribution for 3 different assumptions relative to the LBP (see Appendix A.1); the results are compared to those of GA in Table 2.1.3.1-1.
2.1.3.2 Relative Axial Power Profile Comparison
For exactly the same core description originating Fig. 2.1.3.1-1 the relative axial power profile as determined by GA is shown in Fig. 2.1.3.2-1.
The FSV core was represented in RZ geometry for a CITATION input as in Fig. 2.1.3.2-2. The appropriate compositions and dimensions were determined in Appendix A.2 and are summarized in Table 2.1.3.2-1.
The most important results in the computer output are: 1. kefg = .99474 (the corresponding xy value for LBP2 was
keff = 1.0187 as in Table 2.1.3.1-1)
2. The average power densities in each zone. Knowing the volumes of each zone the power produced in the upper and
lower halves of the core can be determined and compared with GA's value from Table A.1-2 in Table 2.1.3.2-2.
Re Y
-r CR c**Y7WO& jRb INseRTWO
BOTTOM
~RtJlva
P04VE49 bessiryps v R('a4r/ Vc
DI S 7R12(/ TION
~ri?
POAIERe
49
OANE CCNrRql_ coNr~o( L6?;V 120 Post. motL6- ,7 Sycooe-Ap CHAIVI5Ls
SIX~DZ9C~4Tsrq I a~qb et-EmeNrs: vo & NO4ES yts,Wto coo.tqv- cqi,1ut..s ic
DURNABfiLf POISONl ROD
PRI O CONTROL ROOS
#MERt(NC :i~vrDow' cN49NN6fiL
,rsv
Co#E
CR~OSS
sc
CrIc~
Vicki
#V/* 6.J./. 7. / .TABLE 2.1.3.1-1
RADIAL POWER DISTRIBUTION AND k COMPARISON eff
FIG. 2.1.3.1-1
WITH GA VALUES FROM
keff Relative power in internal region 2 3 4 5 6 7 8 9 10 11 12 13 14 15 16 17 18 19 Rating: G=good agreement LBPl 1.0092 .85 G 1.71 G 1.32 G 1.12 G 1.06 G 1.67 G 1.65 G 1.10 G 1.74 G .74 G-F .87 G 1.64 F-B 1.34 G 1.01 G-F .63 F 1.64 G 1.24 G .90 F .97 G 14G, 2G-F less than 10% misfit 2F, 1F-B F = fair, from 10% to 20% misfit B = bad, misfit larger than 20% LBP2 1.0187 .86 G 1.75 G 1.34 G 1.10 G 1.05 G 1.70 G 1.70 G 1.09 G 1.75 G .73 G-F .87 G 1.60 F 1.32 G 1.01 G-F .63 F 1.66 G 1.27 G .92 G-F 1.00 G 14G, 3G-F 2F LBP3 1.00962 .87 G 1.73 G 1.33 G 1.11 G 1.07 G 1.70 G 1.68 G 1.11 G 1.75 G .73 G-F .87 G 1.57 F 1.31 G 1.01 G-F .64 G-F 1.66 G 1.29 G .92 G-F .99 G 14G, 4G-F 1F
51
GA 1.0039 .93 1.70 1.30 1.11 1.12 1.68 1.70 1.03 1.68 .82 .87 1.37 1.27 1.12 .71 1.53 1.25 1.01 1.01Table 2.1.3.1-1 (Continued) Relative power in periphery regions: 20 21 22 23 24 25 26 27 28 29 30 31 32 33 34 35 36 37 Ratings in periphery Total ratings LBP1 .79 F-B .78 G .57 G-F .56 F .49 F .67 G .93 B 1.45 F .47 G-F .53 F .53 F-B 1.06 G .59 G 1.09 G .69 G-F .42 F .34 F 1.01 G 6G; 3G-F; 2F-B; 1B 6F LBP2 .76 F .76 G .58 G-F .55 F-B .50 G-F .63 G .88 B .1.40 G-F .46 G-F .53 F .55 F 1.06 G .58 G 1.11 G .72 G .42 F .35 F 1.00 G LBP3 .77 F .77 G .58 G-F .55 F-B .50 G-F .63 G .85 F-B 1.36 G .46 G-F .53 F .55 F 1.06 G .58 G 1.11 G .72 G .43 F .35 F 1.01 G-7G; 4G-F; 5F 8G; 3G-F; 1F-B; 1B 2F-B GA .64 .77 .64 .67 .55 .61 .69 1.28 .53 .62 .64 1.08 .54 1.09 .77 .49 .40 .96 5F 20G; 4G-F; 8 F 21G; 7G-F; 22G; 7G-F; 6F 3F-B; 1B 7F; 1F-B; 2F-B 1B
f
Fsv
: ovbof 0 ,9K/iU Powe1R aisTRiBV7orlIq Cox areo4 Rob P.94/RS Co"1P67*E/LY /NVSeR rEO*
J-0
0
0.79
,F449Cr1OV 0P C04'5
0.
#Ar vot wiTH~
4f