How can an international company wishing to
establish a business or intending to invest in
Brazil hedge itself against exposures to currency
exchange, interest rate and commodity price
risks?
Diploma thesis for the achievement of the HES Diploma
by :
Aurèle MAJOR
Diploma thesis counselor:
Arnaud WALLE, Professor
Geneva, August 16, 2013
Geneva School of Business Administration (HEG-GE)
Business Administration
Declaration
This Bachelor’s project has been realized in the framework of the final exam of the Geneva School of Business Administration (HEG) in order to obtain the degree of Bachelor of Sciences in Business Administration. The student accepts the confidentiality agreement. The author, the Bachelor’s project Supervisor, the juror, and the HEG, without compromising their worth, exclude any responsibility concerning the use of the conclusions and recommendations made.
« I declare that I wrote this thesis myself using the referenced sources.»
São Paulo, August 16, 2013
Acknowledgements
I would like to thank my supervisor M. Arnaud Walle for assisting me in writing this bachelor’s thesis. He has always been most available even though we were living in two continents apart. Furthermore, I’d like to thank M. Ricardo Rosa, M. George Ohanian, M. Leandro Tatekawa de Camargo, M. Ricardo Merrighi and M. John Liu for having dedicated their invaluable time to share their perspectives on risk management in Brazil.
Executive summary
This thesis is presented in order to obtain the Bachelor’s degree HES.
This thesis seeks to understand how multinational firms who wish to settle themselves in Brazil can hedge exposures to currency exchanges, interest rates and commodity prices. The high volatility of the country’s financial markets and the international attention it has received these last years, both make it an interesting laboratory to examine the question.
In the first part, we analyze Brazil’s transitional phase between developing and developed statue and its large endowment in natural resources. These two factors are what can propel high economic growth and investment opportunities in the nation. The flipsides of Brazil: its cumbersome bureaucratic processes, its highly volatile macroeconomic variables, its lack of infrastructure and education are also studied.
In second part, we see that hedging risk exposures can create firm value by lowering deadweight losses. That is by reducing: (1) financial constraints, (2) expected costs of financial distress, (3) taxes or (4) agency costs. We learn that the Brazilian environment gives higher incentives for firms to reduce the two formers and that these strategies imply what risk exposures a firm should hedge and to what extent.
Furthermore we examine how firms hedge internationally and in Brazil. We observe that the majority of firms hedge to reduce expected costs of financial distress and to a lesser extent financial constraints and accounting noise.
Finally, we learn that firm characteristics are more important in determining how a firm should hedge than the country the corporation is settled in.
Table of contents
Declaration ... i
Acknowledgements ... ii
Executive summary ... iii
Table of contents ... iv
List of tables ... vi
List of figures ... vii
Introduction ... 1
Limitations ... 2
First Part ... 3
1. Context: Economy of Brazil ... 3
1.1: Brazil, an emerging country? ... 3
1.1.1 Introduction ... 3
1.1.2 GDP composition and country resources ... 3
1.1.3 Demographics ... 5
1.1.4 Inequality ... 6
1.2: Brazil, a South American powerhouse? ... 8
1.3: Growth and volatility in Brazil and emerging economies ... 10
1.4 Custo Brasil, Lucro Brasil & Foreign investment ... 13
1.4.1 Custo Brasil - Comparison to others countries ... 13
1.4.2 Lucro Brasil ... 16
1.4.3 Foreign investment ... 17
Second Part ... 19
2. Theoretical framework – Benefits of hedging ... 19
2.1: Introduction ... 19
2.1.1. Definition of hedging and risk exposures ... 19
2.1.2. Can hedging create firm value? ... 19
2.2: Difference between hedging firm value, cash flows and reported earnings ... 20
2.3: Hedging to reduce expected costs of financial distress ... 21
2.3.1 Costs of financial distress ... 21
2.3.2 Hedging and expected costs of financial distress ... 22
2.3.3 Magnitude of bankruptcy costs ... 23
2.3.4 How to hedge to reduce expected CFD ... 25
2.4: Hedging to reduce agency conflicts ... 25
2.4.1 Introduction to agency conflicts ... 25
2.4.2 Debt overhang – underinvestment ... 26
2.4.3 Empire building or the free cash flow problem – overinvestment27 2.4.4 Asymmetrical information and hedging ... 27
2.6: Hedging to reduce taxes ... 31
2.6.1 Taxes – progressive tax structure ... 31
2.6.2 Taxes – tax shield and optimal capital structure ... 33
2.7: Costs of hedging ... 36
2.8: Empirical evidence: hedging and firm value ... 37
3. Hedging – how and why firms hedge in reality ... 38
3.1: Introduction ... 38
3.2: Studies ... 39
3.2.1 Study one ... 39
3.3.2 Study two ... 39
4. Interviews with foreign subsidiaries settled in Brazil ... 44
4.1: Key elements ... 44
5. Hedging financial risks in Brazil – putting everything together ... 47
5.1: Recommendations ... 47
5.1.1 Identifying the hedging strategy that will maximize firm value .. 47
5.1.2 How to hedge? ... 49
5.1.3 Other stages outside of the scope of this paper ... 49
Conclusion ... 50
Bibliography ... 52
Appendix: Suggested articles to help calculating benefits of strategies ... 54
1: Costs of financial distress ... 54
List of tables
Table 1: Openness BRIC/other countries ... 16
Table 2: Risk Shifting Example ... 22
Table 3: Risk Shifting Example 2 ... 22
Table 4: Variables That Affect Indirect Financial Distress Costs ... 24
Table 5: Debt Overhang Example ... 26
Table 6: Hedging Progressive Tax Structure ... 32
Table 7: Empirical Evidence Firm Value And Hedging ... 38
Table 8: Most Important Risk ... 40
Table 9: Goals/Objective Of Risk Management Program ... 41
Table 10: Assumptions Future Price Distribution ... 43
Table 11: Primary Hedging Motives and Benefit Assessment ... 48
List of figures
Figure 1: Energy Supply Structure ... 5
Figure 2: Inequality In The World ... 6
Figure 3: South America’s Economic Linkages With Brazil ... 8
Figure 4: The Importance Of Brazil’s Spillovers ... 9
Figure 5: World Real GDP Growth ... 11
Figure 6: Brazil's Inflation Rate And GDP Growth, 1945-2005 ... 12
Figure 7: Costs Mature Markets Vs High Growth Markets ... 13
Figure 8: Firm Value And Costs Of Financial Distress ... 23
Figure 9: Hedging And Debt Overhang ... 28
Figure 10: Free Cash Flow Problem And Hedging ... 29
Figure 11: Cost Of Capital Brazil Vs Rest ... 31
Figure 12: Firm Value And Optimal Debt Value ... 34
Figure 13: Underlevered Vs Overlevered ... 35
Figure 14: Estimated Costs Of Hedging ... 37
Introduction
Over the last decade, the high growth potential of Brazil has caught the interest of many foreign firms. Yet high growth also comes at a steep price. One of these is the strong volatility of Brazil’s macroeconomic variables. Foreign firms wishing to settle themselves in the country will have to deal with the local currency, interest rates or commodity prices. Hence, they can be susceptible to severe financial risk exposures. These can threaten them to bankruptcy, create cash shortfalls or even be the source of unpleasant reactions coming from stakeholders.
One might then suggest implementing a hedging policy. However, hedging has had its share of controversies.
The first one stems from the use of derivative contracts. For instance, in 1994 Orange County went bankrupt due to making a significant loss in a position it had taken on interest rates derivatives. This was the biggest municipal bankruptcy in history.
The second controversy, related to the problematic of this paper, is whether hedging truly creates firm value or not. A famous example is when Chris Culp and Merton Miller, in the Journal of applied corporate finance (1995), stated:
“We need hardly remind readers that most value-maximizing firms do not, in fact, hedge”
International companies who wish to establish a business in Brazil will evidently be interested by the question. Moreover, if hedging doesn’t increase firm value then how one should hedge becomes irrelevant.
Hence, the aim of this paper is to give a critical overview of how an international firm settled in Brazil can hedge its financial risks in a value maximizing way.
Limitations
A certain number of limitations are made in this paper:
First, currency exchanges, interest rates and commodity price risks are all comprised under the same component: financial risks. This paper does not distinguish them in any significant way. Rather, it only considers the fact that they directly impact cash flows, firm value or earning accounts.1
Second, when this paper suggests to what extent a firm should hedge it does not take into account the costs of hedging.
Third, this paper does not explain how to calculate risk exposures.
Fourth, the exact way in which some hedging strategies can be mutually exclusive is not examined thoroughly. This is due to the fact that the literature on the subject is relatively scarce.
Scope of this paper
The title of this paper states the word “how”. Due to its broad use it can be understood in various ways.
In this paper it is interpreted from a corporate finance point of view. Hence, How a firm can hedge is defined as: should a firm hedge its cash flow, firm value or earning account risk exposures and to which extent?
The “hedging mechanics” or in other words how a firm should use financial instruments to hedge is outside of the scope of this paper.2
Furthermore, this paper uses the word “investor” as meaning an international company who wishes to establish a business or who intends to invest in Brazil.
1
These three variables are explained in more details in section 2.2 2
Some parts mentions the instruments firms use, but only as a mean to see how sophisticated their risk management program is.
First Part
1. Context: Economy of Brazil
1.1: Brazil, an emerging country?
1.1.1 Introduction
Brazil is the seventh biggest economy in the world, right behind the United Kingdom. Being a contender to the BRICS, it is considered as a fast growing major economy along with Russia, India, China and South Africa. It is neither a developed country nor a developing country, but somewhere in-between, in other words an emerging one. A characteristic of the ladder is its transitional phase – politically, economically, demographically and socially – as we will see is the case with Brazil.
The fact that developed countries have gone through similar phases can help comprehend where Brazil is heading to. This point being particularly important for potential investors as it offers them an extra tool for constructing better forecasts.
Furthermore, these transitional phases open a window for greater productivity, hence promising growth rates. The investor may also benefit from the establishment of new markets and the diversification of its investments. Brazil also contrary to many other high growth markets has a stable democracy and operates in a free market.
Even if emerging countries such as Brazil may offer greater opportunities they more often than not entail greater risks and costs. These may be due to political risk, variances in taxation, legal barriers, language barriers, exchange rate, interest rate and commodity price risks. The last three, touching the essence of this paper’s problematic, will be dealt in a more throughout manner.
1.1.2 GDP composition and country resources
The Brazilian GDP composition by sector for 2012 is the following: 5.4% in agriculture, 27.4% in industry products and 67.2% in services. The nation is self-sufficient in food and its exports are well diversified. It’s also the world’s 24th biggest exporter. It’s a
leading exporter in beef, sugarcane, coffee, soybeans, ethanol, frozen chicken but also of iron ore and steel.3
Brazil has a very large endowment of resources and a great amount of unused arable land (more than twice as much as the USA according to USDA). It has the largest and most bio diverse rainforest. In the first decades of its foundation its resources were always considered hard to exploit compared to some other colonies (i.e. Canada and USA) because of Brazil’s tropical climate and unique topography (i.e. lack of navigable rivers flowing directly to the sea). Today with the technological advancements, the situation has drastically changed. What has been seen as disadvantages in the past can almost be seen as a gift today, for they have preserved Brazils’ riches to be better exploited today.
But the reader might be asking himself, and rightly so, what are these riches? And what role will they play in future international policies between Brazil and other countries?
To name a few, Brazil has 15% of the fresh water4 including the biggest flow of renewable water on the earth5. Its vast territory and varied climate allow for agriculture and livestock farming on significant scales and for a wide range of products. It also has an estimated 70 to 100 billion barrels of oil reserves making it a net exporter of it6. Many countries are already experiencing stresses on water, food and oil availability. With the added hypothesis of global warming persisting and the accelerated pace of the population growth, the situation is projected to worsen.
Under the most optimistic estimations, oil peak should arrive in 20207. Many economists believe that after an oil peak, several economies suffer due to the energies increasing in price. Countries with infrastructures highly dependent on oil and at cheap prices should be more susceptible to these economic costs. This is especially true for occidental nations where their oil use per capita is very high compared to developed countries who have a high portion of coal in their BTU consumption.8 Western countries could thus have greater difficulties in substituting oil for alternative energies.
3 https://www.cia.gov/library/publications/the-world-factbook/ 4 http://news.nationalgeographic.com/news/2010/06/100604-brazil-watershed-protection/ 5 http://www.ec.gc.ca/eau-water/default.asp?lang=En&n=51E3DE0C-1 6 http://www.brasil.gov.br/energia-en/pre-salt/new-reserves/br_model1?set_language=en 7 http://www.thenational.ae/business/industry-insights/energy/oil-demand-peak-by-2020-if-co2-is-cut-aggressively 8 http://www.futurepundit.com/archives/006832.html
Figure 1: Energy Supply Structure
Brazil on the other hand has been focusing itself heavily since the 1970s oil crisis to substitute its oil use for alternative energies. As the above chart shows, it is a leader in renewable energies. Eighty-five percent of Brazil’s electricity is produced with hydroelectric power plants and the country positions itself as one of the leader in the biofuels industry. It is said by the UN-Energy that Brazil’s “sugarcane ethanol is the most successful alternative fuel to date” this being due to its tropical climate and topography.
Additional alternative energies where Brazil has “natural” advantages are wind and solar power. Indeed it is considered as having one of the highest solar incidences on earth and according to the Global Wind Energy Council “the most promising country in the world in terms of wind power”. Even though these energies don’t have a high use in Brazil’s energy matrix, they have the potential to take greater portions in the future.
1.1.3 Demographics
Other than its resources, Brazil is now in a key phase of its demographical development. The proportion of the working age (15 to 64 years old) is higher than that of the dependent age (less than 15 and more than 64 years old). This term is conned by economists as the demographic dividend. Indeed having the largest segment of the
population of productive working age generates more wealth and tax collections – ceteris paribus – than a dependent population, thus stimulating growth. This demographic bonus is set to be short lived for Brazil (15-20 years9). According to a study by Professors Cássio Turra and Bernardo Queiroz of the University of Minas Gerais, this dividend, until it lasts, should potentially yield 2.5% of additional GDP per year.10
1.1.4 Inequality
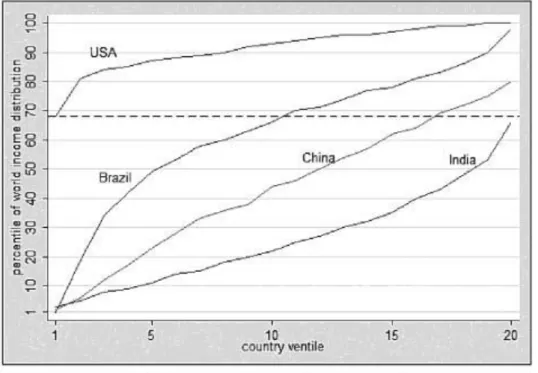
Inequality in Brazil is strong (Gini index of 51.9 in 2012). The book “The have and Have-Nots” from World Bank economist Branko Milanovic shows a graphic that illustrates this fact very well.
Figure 2: Inequality In The World
On the vertical axe we have the percentile of world income distribution by percentile and on the vertical the country ventile (cluster of 5 percentiles). As we can see the 5% poorest (1st ventile) Brazilians are about as poor as anybody on earth. On the other hand the richest (top ventiles) Brazilians are among the richest in the world.
9 http://www.indiabrazilchamber.org/en/?p=2033 10 http://www.kpmg.com/BR/PT/Estudos_Analises/artigosepublicacoes/Documents/Investment%20in%20Br azil/Investment-Brazil-11.pdf
By contrast the 5% poorest Americans (1st ventile) are richer than almost 70% of the citizens worldwide. Meanwhile the richest Americans (top ventiles) are among the richest in the world.
Brazil thus is a sort of miniature version of the world as it covers nearly all the income groups worldwide.
A study by the IMF demonstrates that there is a positive correlation between greater income equality and greater GDP growth11. Moreover, strong inequality hinders social stability which may have negative side-effects such as higher crime rates, lower human capital (lack of access to quality education), lack of trust in society, social tensions etc.
In Sean Williams paper “Why is Brazil an Emerging Market Economy?” it is argued that if an important proportion of the population does not have the financial means to fully participate in the economy then the ladder will be inefficient. Indeed it would deprive the population from the necessary capital to make investments (i.e. opening a business). He then follows by saying “Currently, the top 10% of the [Brazilian] population accounts for 43% of total consumption, while the bottom 10% makes up only 1.1%.”.
A study by World Bank economists showed that “a 10 percent drop in poverty levels, other things being equal, can increase economic growth by one percent. In turn, a 10 percent increase in poverty levels lowers the growth rate by one percent”12. What’s interesting to note is this has a propensity effect: GDP growth reduces poverty, which increases consumption which in turn increases GDP and the cycle continues. Being that Brazil has put on many efforts to reduce poverty (i.e. Bolsa Familia) and as the real GDP of Brazil is forecasted to grow this trend should persist.
Furthermore researches show that an increase in real income affects the household’s consumption basket. With an increase of real income a household will allocate a smaller proportion of his budget to physiological needs and more to the others. As inequality is reduced in Brazil, people will be entering new markets for the first time. Affinity for certain brands or products won’t be as high as accustomed consumers. This gives a greater opportunity for new companies and products to enter the consumption scene.
11 http://www.imf.org/external/pubs/ft/sdn/2011/sdn1108.pdf 12 http://web.worldbank.org/WBSITE/EXTERNAL/COUNTRIES/LACEXT/EXTLACOFFICEOFCE/0,,content MDK:20819439~pagePK:64168445~piPK:64168309~theSitePK:870893,00.html
With the added fact of Brazil’s strong demographics, it will take a longer time for a market to reach a maturity or declining phase.
1.2: Brazil, a South American powerhouse?
BRIC countries stand out from other emerging economies because of their large territory size, strong demographics, big market and resources wealth. Another important factor is that they are regional economic superpowers. This is the case for Brazil in South America.
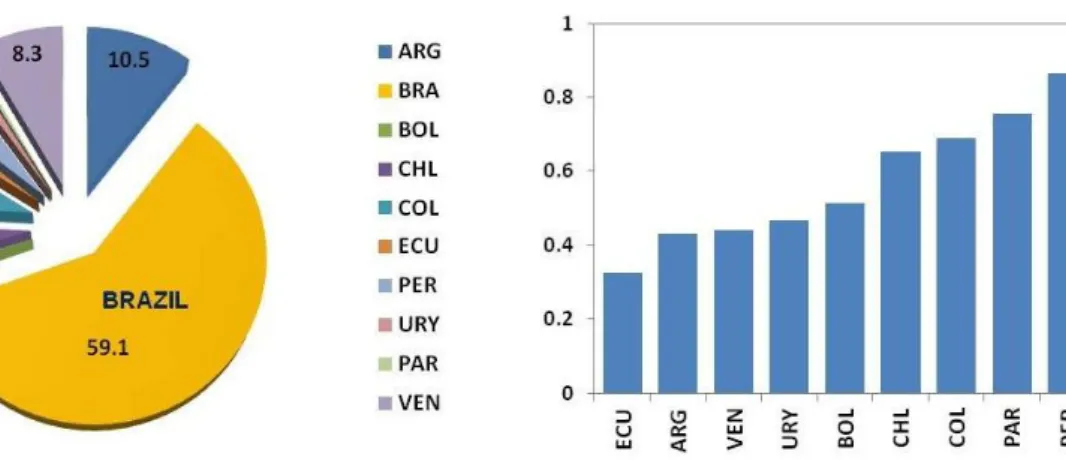
Figure 3: South America’s Economic Linkages With Brazil
13
The above graphic shows that Brazil accounts for almost 60% of South America’s GDP. As we see, many South American countries have a strong correlation of their GDP cycle with Brazil’s. A paper by the IMF argues that this could be due to the fact that Latin American countries have economic activity this is dependent on that of Brazil. Or, that their economic activity including Brazil’s is just highly affected with international conditions (price fluctuations and global demand).
13
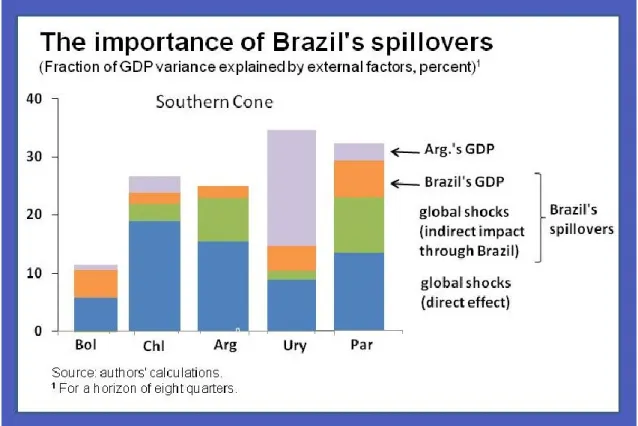
As we see this correlation is especially true for the southern corn countries. For this reason, these countries are the ones that are the most susceptible to spillover effects from Brazil. Meaning that if an event affects Brazilian’s economy, whether started internally or from global influences, it will directly influence the economy activity of southern corn countries (see graphic below). This can be explained by their high levels of exports to Brazil in percentage of their GDP.
Figure 4: The Importance Of Brazil’s Spillovers
14
It’s noteworthy to mention that not only is Brazil a South American powerhouse but it is also considered as a highly regarded place to do business in the region. A recent survey by Ernst & Young showed that “almost 7 out of 10 business leaders declaring the country [Brazil] as the most attractive place to establish operations”.
A report from the IMF also indicates that Brazil beats all other South American countries in terms of the quality of infrastructure and technological development. If we add the fact that Brazil has a large domestic market (demand), huge untapped natural
14
resources, stable economic and political landscape it’s no surprise why Brazil attracts a considerable amount of foreign investment.
1.3: Growth and volatility in Brazil and emerging economies
A factor that is much looked upon by foreign investors is the growth prospect of the countries they wish to invest in.
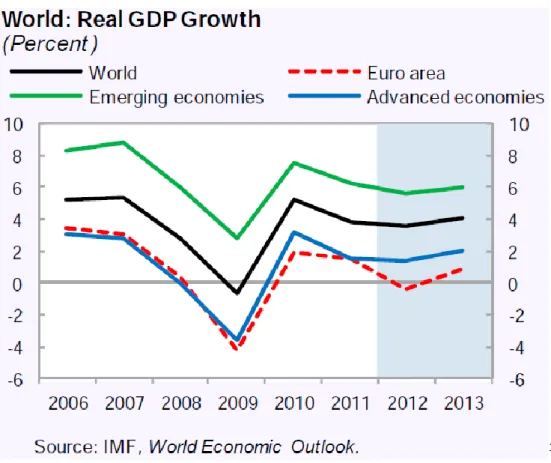
In the graphic below, we can see that emerging economies real GDP growth outreach those of the rest of the world giving foreign investors potentially superior returns on investments. Over the last decade, the BRICS have almost increased by twofold their share of global output and are responsible for 20% of world GDP. Of course as studies show emerging economies usually highlight higher volatility (in absolute terms) than advanced countries. Some examples are business cycles, GDP growth, inflation rate, interest rates and currency fluctuation.
Figure 5: World Real GDP Growth
15
Nowadays, Brazil is stable macro economically but it has not always been this way. Situations can change fast and thus need the investor’s full attention. A brief understanding of Brazil’s economic history will better our understanding of where the country is heading and why hedging financial risks correctly has all of its importance.
15
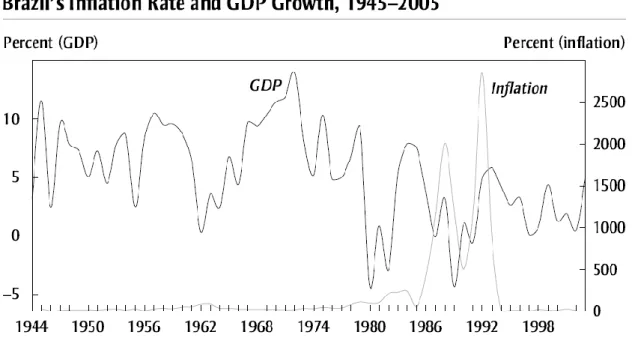
Figure 6: Brazil’s Inflation Rate And GDP Growth, 1945-2005
Between 1913 and 1980, Brazil had the highest growth on average in the Americas. This was notably due to increase pricing in commodities and industrial production aided by the government. By 1983 Brazil defaulted on foreign debt, giving an immediate break to its growth. The country was now experiencing a decline of 4% GDP and an inflation rate of 211%. Brazil has had a history of volatile and high inflation. In the 1970s the inflation averaged 30%, from 1980 to 1988 it averaged over 200% and during 1989-1994 averaged 1’400%.16 By looking at the graphic above we can even see that the inflation broke the 2500% bar near 1992.
These last years Brazil has had a controlled inflation (near 6.5%17) thanks to the “Real plan” it introduced in 1995. This plan which dealt with the hyperinflation put forth among others a new currency and enacted a series of fiscal and monetary policies.
Today Brazil’s country risk is evaluated as being low and it’s political and financial risks as being moderate.18
16 http://ebook.law.uiowa.edu/ebook/sites/default/files/Brazil%20-%20Sean-1.pdf 17 http://fr.global-rates.com/statistiques-economiques/inflation/indice-des-prix-a-la-consommation/ipc/bresil.aspx 18 http://www3.ambest.com/ratings/cr/reports/Brazil.pdf
As for the situation of its main macroeconomic variables they are as followed: the inflation remains more persistent than in other emerging countries. Brazil has high nominal interest rates and has had one of the strongest real interest rates in the past decade. Last but not least, its currency is considered as being highly overvalued19. This sets out the pace of what international investors have to deal with when investing in Brazil.
Concerning the GDP, Brazil has lately been famous for being one of the last countries to enter the subprime crisis and one of the last to leave it in 2010 with a GDP growth of 7.5%.20 At that time many economists and journalists saw Brazil as a new superpower with undeniable growth. With Brazil’s disappointing 0.9% GDP growth rate in 201221
, the hip for Brazil has largely decreased.
What is sure is that Brazil is no country for beginners. Even though it has all the potential for achieving high growth as seen earlier, history and currents events have shown this to work in sharp cycles. The international media might let its appraisals come and go like the wind but companies wanting to invest in Brazil should have their perspectives based on long term strategies.
In the next section will analyze what is famously called the “Custo Brasil” and the “Lucro Brasil”. We will also conclude this part by talking about Brazil’s worldwide role in foreign investments.
1.4 Custo Brasil, Lucro Brasil & Foreign investment
1.4.1 Custo Brasil - Comparison to others countries
Custo Brazil is a term used to describe the set of structural, bureaucratic and economic problems that make doing business in Brazil relatively more expensive than other developed or emerging countries. Having high growth opportunities can be interesting but one must ask himself up to what costs are they worth it. At the end what really matters is the margin.
19 http://www.theguardian.com/business/economics-blog/2013/jul/25/brazil-real-economic-crisis-pope-francis 20 http://www.cbsnews.com/video/watch/?id=7143554n 21 http://www.brasil.gov.br/para/press/press-releases/march-2013/brazil-sees-0.9-gdp-growth-in-2012/br_model1?set_language=en
Figure 7: Costs Mature Markets Vs High Growth Markets
The graphic above compares Brazil’s costs associated with businesses compared to other markets and countries. As we see Brazil undergoes slightly lower costs compared to the other mature countries but much higher ones compared to the high growth countries.
An article of Joseph Leahy from the Financial Times states “This is the condrum business face: Brazil is a high-growth market in terms of opportunities for revenue expansion but it is on average a low-margin market in terms of profitability, particularly for companies in the start-up phase.”22
Much of this can be explained by the fact that Brazil has elevated costs of labor and due to its high indirect and direct tax burdens. There’s often a misconception that Brazil’s labor is cheap. Brazil has the most expensive and least productive hourly wage of all the BRICS countries.
This lack of productivity is according to an article of The Economist in great part due to Brazils’ labor law.23 The ladder is a set of 900 articles in the constitution that goes into great details about how relationships between employees-employers should be
22
http://www.ft.com/intl/cms/s/0/89e9e40c-5991-11e1-abf1-00144feabdc0.html
23
regulated. This creates a lack of flexibility for negotiations because almost everything is set in stone.
Furthermore, employees receive indemnities if they get laid off without just cause, encouraging them to wait to being given their cards rather than resign. A lazy employee or a bankrupt employer does not constitute just cause. Labor courts also usually take the side of workers.
Brazil is ranked number 126 out of 186 economies on a World Bank report concerning the ease of doing business.24 The Custo of Brazil is essentially the reason why the country has such a low rank. And this is not only due to labor costs.
To give some examples it takes on average 119 days to open a new business in Brazil compared to 14 days in China and 12 in India. Its tax code and tax burden is also cumbersome. The World Bank report mentioned above ranked Brazil 150th in terms of ease of paying taxes. This index’s calculation comprises the time and total tax rate and the number of annual payments.
A report from the World Economic Forum “The Global competitiveness Report 2011-2012” makes several in depth analysis on other strength and weaknesses for Brazil that have major impacts when doing business in the country. For this we will directly look at how Brazil scores in the indexes (out of 139 countries) rather than over concentrate on the process.
Brazil has “one of the worlds’ largest internal markets (10th) and sophisticated business environment (31st)” giving companies lots of opportunities for economies of scales. Not to mention the fact that Brazil having only one official language and a well unified culture makes the marketing process much easier than it would otherwise.
Brazil “has one of the most efficient financial markets (40th) and one of the highest rates of technological adoption (47th) and innovation (44th) in the region. “.
Concerning Brazil’s weaknesses it scores a rank of 104th for its lack of infrastructure, 115th for its macroeconomic imbalances, 126st for its rigid labor market (confirming what has been said above) and 115th for its poor education system. Brazil currently has, contrary to western countries, a shortage of qualified labor which can be problematic for employers.
24
The positive note of these weaknesses is that the country still has a long way to go and hence the potential to continue bringing positive growth.
An important subject that hasn’t yet been touch upon concerns Brazil’s economic openness.
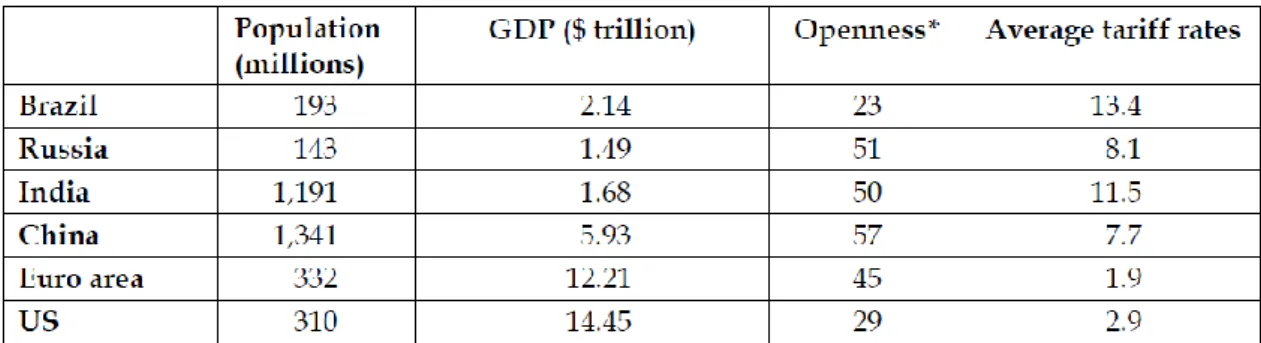
Table 1: Openness BRIC/other countries
The table above shows a comparison of BRIC countries, Euro area and USA economic openness. As we can see Brazil is a relatively closed economy, having a very low sum of imported and exported goods and services as a percentage of GDP. Brazil even seems less open than the USA, which is widely considered as being a relatively closed economy. By contrast other BRIC countries have a completely opposing strategy on economic openness. Brazil also has the highest average import tariff rates which could be an explanation for its low weight of trade. These import tariffs of course make imported products less desirable by Brazilian consumers.
1.4.2 Lucro Brasil
In the last section we saw how the high costs in Brazil can threaten an international’s firm’s margin when investing in the country. What we haven’t seen is how these companies can use Custo Brasil to work in their favor.
In 2011 journalist Joel Leite coined a term called Lucro Brasil (Profit in Brazil). Brasil has some of the most expensive cars and electronics world-wide. These high prices are often justified by the retailers and producers because of the nations’ structural problems and high taxes. Lucro Brasil is a term used to explain that even though the
former and the ladder justify higher price, many times they’re used to hide abusive margins. Most Brazilian consumers aren’t aware of this.
As we saw earlier Brazil is a country that covers nearly all income groups worldwide. The country being in a high growth state has a great number of “nouveau riche”. According to an article of the Forbes magazine, the elite parts of the population often see high prices products as being high status or exclusive.25 This makes them quite unsuspicious of inflated prices.
Another way that Custo Brasil can advantage foreign companies is if they implement plants locally. By doing so they are protected by other foreign companies trying to export the goods to Brazil thanks to the import tariff. They also enjoy similar protections as the Brazilian companies do.
1.4.3 Foreign investment
According to the United Nations Conference on Trade and Development, Brazil is the world’s number 5th most attractive destination for foreign direct investment for the year 2012 until 2014.26
As we saw earlier Brazil is a relatively closed economy. Quite the opposite is true for foreign direct investments (FDI). The country is the 2nd most used destination in terms of FDI value and the 5th in terms of FDI projects according to an Ernst & Young report.27
Compared to many countries, Brazil does not discriminate against foreign investors. Indeed, you won’t find any maximum or minimum level entry for foreign investments. All the profits may be transmitted abroad.
Many efforts have been made to facilitate foreign investment in Brazil. Disclosure requirements to be listed on Brazil’s market exchanges are in compliance with those found for other international exchanges. This transparency gives the investor more certainty concerning the financial instruments he’s purchasing.
Yet, a substantial part of Brazil’s growth is driven by commodity exports. This attracts several foreign investors but has the downturn of making the Real appreciate relative to
25 http://www.forbes.com/sites/kenrapoza/2012/08/11/brazils-ridiculous-80000-jeep-grand-cherokee/ 26 http://www.brazilchamber.no/?page_id=570 27 http://www.ey.com/GL/en/Issues/Business-environment/2012-attractiveness-survey---Brazil---Capturing-the-momentum
other currencies. In turn Brazilian exports become less attractive due to increases in price.
An important consideration for foreign businesses is the openness of the society in general. In Brazil, diversity being of color, religion or nationality is usually well embraced and not shamed upon. This can be particularly important for foreign investors wishing to relocate employees in Brazil especially when the ladder has a shortage of qualified labor.
As we’ve seen through the first part of this paper Brazil’s role in the world economy has seen significant evolutions. Many economists believe that the nation is prone to continue following this path in the future. The different transitional phases encoring in Brazil and its large endowment of natural resources offer the investor a harem of opportunities he can exploit. This also ensures him that if government policies are on the line, the country still has extensive possibilities of growth ahead of it.
Nonetheless, growth often entails greater risks, being operational, structural or financial. This paper is concerned principally by the financial aspect of risks an investor is liable to. Thus, in the following part we will analyze how a multinational corporation settled in Brazil – hereinafter termed as MNCB – can hedge its exposures to currency exchanges, interest rates and commodity price risks.
Second Part
2. Theoretical framework – Benefits of hedging
2.1: Introduction
2.1.1. Definition of hedging and risk exposures
The book An Undergraduate Introduction to Financial Mathematics (2006) defines hedging as:
“The practice of making a portfolio of investments less sensitive to changes in market variables.”
In the case of this paper the market variables are currency exchanges, interest rates and commodity prices.
2.1.2. Can hedging create firm value?
The Modigliani and Miller (1958) paradigm is based on the assumptions that there are no transaction costs, no agency costs and no taxes. The theorem posits that financial policies and hence hedging strategies are irrelevant – they cannot increase firm value. Indeed, in this perfect market, risk-neutral shareholders would already be able to easily eliminate specific risks through a well-diversified portfolio.28 These would also include the firm’s exposures to currency rates, interest rates or commodity prices risk.
The main contribution of Modigliani’s and Miller’s (1958) model has not been to show that the assumptions hold true. Rather, it has been to help scholars show how hedging can create firm value: namely by reducing agency costs, taxes, costs of financial distress (CFD) and costs of financial constraints.
We will see how various hedging strategies can reduce these deadweight losses.29 However, some will be mutually exclusive. The firm will hence have to choose a
28
In finance theory specific or idiosyncratic risks are those that can be eliminated through a well-diversified portfolio – they are specific to the firm. The risk that remains after diversification is called systematic risk or nondiversifiable risk.
29
primary one which will define also how it should hedge and can potentially add secondary ones. The chosen strategy will depend on the corporation’s characteristics and the environment it operates in.
Section 2. is structured as followed. First, we will analyze the different types of variables that are subject to hedging. Second, we will examine what hedging strategies can maximize firm value, how each respective one should be applied and which strategy will be most beneficial depending on the firm.30 Third, the costs of hedging will be discussed. Fourth, empirical evidence attesting whether hedging creates firm value or not will be presented.
2.2: Difference between hedging firm value, cash flows and
reported earnings
Corporate finance theory suggests that there are three different variables subject to hedging: cash flows, accounting earnings and firm value. Each one is used in a different context depends on the firm’s hedging strategy.
Cash flow hedging is simply alleviating the risk exposures31 that affect cash movements – or in other words cash inflows and cash outflows. Cash flow hedging serves to reduce the probability of liquidity insolvency or cash shortfalls.
Accounting earning hedging is mitigating the risk exposures that affect earnings. They may differ quite substantially from cash flows. Earnings are calculated by the difference between the revenue received and the costs (i.e. labor) incurred for the relevant sale of the good or service. The sum of cash inflows and outflows would equal the earnings if the revenue (inflow) would be incurred at the same time as the costs (outflow). But this rarely happens, if ever. This is why principals of accrual accounting were created; the actions of the firm and his client will seldom have the same exact timing as the cash movements. When a firm hedges the volatility of its cash flows it is directly seeking to lower the volatility of its cash movements. Hedging reported earnings is primarily used to reduce accounting noise or to alter the perception of outsiders on the firm’s financials.
30
The appendix details articles that can be useful to quantify the benefits and costs of the different hedging strategies
31 When a firm calculates its risk exposures, it shouldn’t include those that are already “naturally hedged”
Firm value hedging is mitigating the risks exposures of the assets’ and liabilities’ worth. Ammon (1998) explains this through the example of an interest-bearing fixed asset. As we know changes in interest rates should have a direct impact on the value of that asset. Yet, as the interest payments are fixed, cash flow volatility stays intact. The company could in this case hedge firm value by using a financial instrument – for example an interest rate swap – that transforms the fixed rate asset into a floating rate asset. Firm value hedging serves to reduce the probability of balance sheet insolvency.
2.3: Hedging to reduce expected costs of financial distress
2.3.1 Costs of financial distress
There exist two types of CFD: The direct ones and the indirect ones. The former is of bureaucratic source. It includes the payments to courts, lawyers and accountants at the state of bankruptcy. The indirect costs encompass two main causes. The first is the reactionary effect of stakeholders32 – they might demand higher benefits to compensate the increased risks or even decide to abandon the corporation. For instance: credit line policies can become inflexible and expensive; employees might look for employment else-where or become discouraged; suppliers may refuse to deliver the ordered goods et cetera.
The second indirect CFD is related to agency problems. Financial distress may create a conflict of interest between shareholders and bondholders. Such a situation incites managers, who act in shareholders’ interest, to invest in suboptimal projects.
Following is a simple example to demonstrate this conflict in a quasi bankruptcy state:
Let’s imagine a firm has 15’000 R$ in liquidity and a debt with a 16’000 $R face value. The maturity date is set for the period t+1. If the company stays in this situation until t+1 it will go bankrupt. Shareholders won’t receive anything in this situation; the remaining assets will be used to pay back the bondholders.
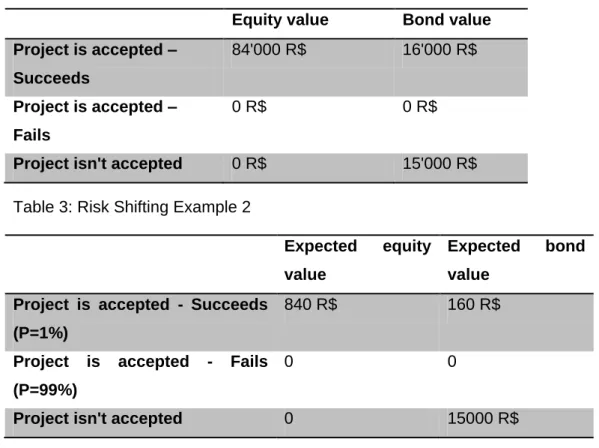
Let’s now suppose that the management acts in the shareholders’ interest and has the possibility to invest in a very risky project that costs 15’000 R$. If the project succeeds, it will give a payoff of 100’000 R$ immediately – probability of occurrence: 1%. If it fails, it will earn nothing – probability of occurrence: 99%. The following table details the different possible scenarios:
32
Table 2: Risk Shifting Example
Equity value Bond value Project is accepted – Succeeds 84'000 R$ 16'000 R$ Project is accepted – Fails 0 R$ 0 R$
Project isn't accepted 0 R$ 15'000 R$
Table 3: Risk Shifting Example 2
Expected equity value
Expected bond value
Project is accepted - Succeeds (P=1%)
840 R$ 160 R$
Project is accepted - Fails (P=99%)
0 0
Project isn't accepted 0 15000 R$
As we can see stockholders are better off if the project is accepted. If they don’t pursue the project, the expected equity value will be 0 R$. This excessive risk taking not only reduces bondholder wealth but impedes on firm value as a whole. In finance, this agency conflict is called the risk shifting problem.
2.3.2 Hedging and expected costs of financial distress
The expected CFD is calculated as the probability of bankruptcy multiplied by the estimated costs if financial distress were to occur. Hedging enables a firm to lessen the first component. The following graphic will be used to illustrate this point:
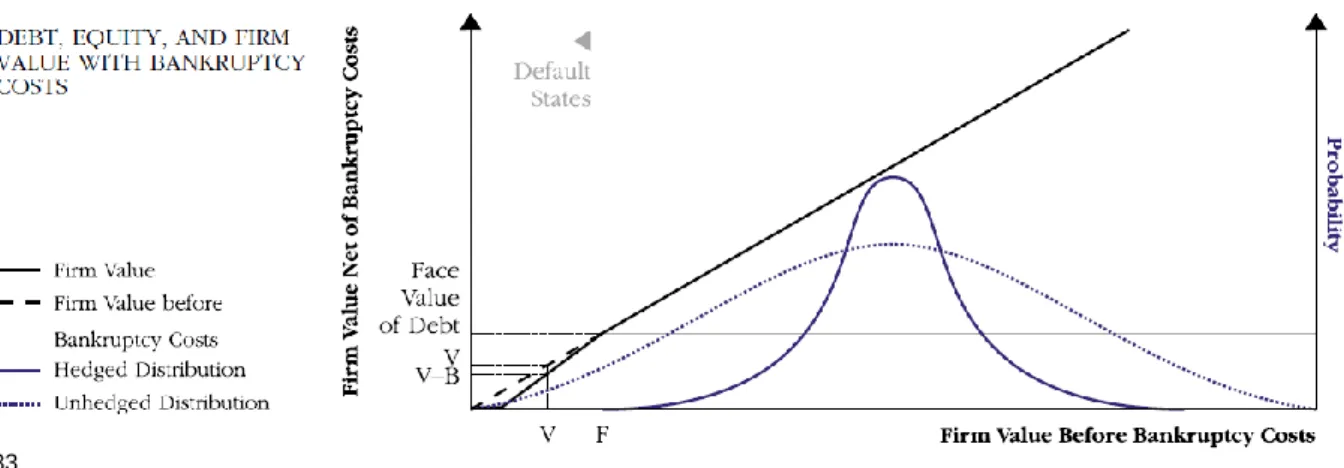
Figure 8: Firm Value And Costs Of Financial Distress
33
As we can see the unhedged distribution has fatter tails than the hedged one. This is due to the fact that hedging reduces firm value volatility. To see how this works, it’s important to think in terms of financial risk exposures. Indeed, when they are left unhedged, upward and downward price movements have more impact on firm results. In the case of this graphic, if the corporation doesn’t hedge it has a probability of default that is significant. This is can be seen by how the unhedged distribution goes below the face value of debt. By hedging, the firm reduces the probability of bankruptcy and hence the expected CFD. Hedging increases firm value by the amount of expected costs that were reduced.
2.3.3 Magnitude of bankruptcy costs
As we’ve seen direct CFD are those that that stem from legal expenses. The indirect ones encompass the firm overinvesting in risky projects and the stakeholders’ reactionary effects. What we haven’t answered yet is: how significant are these costs for the company? And do they vary depending on the characteristics of the firm and its stakeholders? The answers to these questions are important. They will help us understand why some firms will benefit more than others from reducing expected CFD.
Empirical studies have shown direct costs to be relatively small compared to the indirect ones. The former is estimated to vary between 1-10% of firm value [See Hotchkiss et al. (2008]. The total costs are estimated to rise as high as 31% of firm value [See Kortweg (2007)]. As it can be observed, CFD can become very significant.
33
A number of studies have been interested in what factors magnify indirect CFD. They have shown that firms or stakeholders exhibiting certain characteristics are more likely to have lower levels of leverage than their counterparts [See among others Titman and Wessels (1988), Shantanu, Dasgupta and Kim (2007) and Korteweg (2007)]. These empirical studies reaffirm the significant role financial distress costs play in shaping a corporation’s financial policies. The following non-exhaustive list illustrates factors that have been shown to influence CFD:
Table 4: Variables That Affect Indirect Financial Distress Costs
Variables that affect indirect financial distress costs
Reason
Customers (+) Number of rivals Clients can switch to a
competing brand with greater ease.
(+) Product sold is durable or unique These often require after-sales services, spare parts or warranties – hence clients want to be assured the firm is solvent before purchasing anything.
(-) Number of clients The consequence of a customer
leaving is more significant to sales reduction and they often have higher expectations.
Employees (+) Degree of human capital is specialized
Workers have or will gain job specific skills. FD34 is of concern as alternative jobs may be hard to find.
Suppliers (+) Dependence of supplier on firm (often the case for unique or durable goods)
Suppliers are more concerned of a client's solvency if purchases amount for a big portion of their sales.
Capital structure
(+) Intangibility of assets Asset sales in situation of FD may suffer larger discounts if these are intangible assets.
34
(+) Proportion of liabilities to assets Increases the probability of FD. (+) Volatility of cash flows and firm
value
Increases the probability of FD.
Industry (+) Rest of industry is in financial distress
Asset sales in situation of FD may suffer from large discounts if the entire industry is financially distressed.
Opportunitie s
(+) Large growth opportunities (often measured by high R&D expenses)
Excessive risk taking problem has more chances of occurring.
Based on this table we can see how depending on the characteristics of the firm and the stakeholders, distress costs are either accentuated or attenuated. Obviously the higher CFD are, the more we would expect a firm to use hedging as motive to reduce them.
Alemeida and Philippon (2008) also show how CFD are linked to economic distress and have a systematic risk component included. This would suggest that Brazil’s country risk is to a certain extent incorporated in the CFD.
2.3.4 How to hedge to reduce expected CFD
If the firm finds that reducing expected CFD is its hedging value maximizing strategy, then it should hedge firm value or cash flows to the extent that it minimizes the probability of default [See Ammon (1998) and Smith (2008)]. Firm value hedging will reduce balance sheet insolvency. This avoids that the value of debt outweighs the value of assets. Cash flow hedging will reduce liquidity insolvency. This avoids that the firm lacks internal funds to pay its obligations. Evidently, the capital structure of the company will play an important role in how it applies this hedging strategy. For example a firm that is highly leveraged will very likely be more concerned of balance sheet insolvency than liquidity insolvency. At the end firms will want their current assets to cover their current liabilities and their fixed assets to cover their fixed liabilities.
2.4: Hedging to reduce agency conflicts
Each firm is composed of several different groups of influences. In corporate finance these groups can be summarized by: the owners in the case of a privately held company or managers for publicly owned companies; internal stockholders; new stockholders (potential buyers); bondholders and the other stakeholders.
Conflicting interests can arise as each party wants to maximize its wealth. This can hinder firm value in several ways. The one relevant to our discussion is when it forces the firm to pursue suboptimal project investments. In other words when a firm underinvests in positive NPV projects or overinvests in negative NPV projects.35 In the following sections we will analyze different cases of agency problems. Later, we will see how they can be reduced with hedging. The factors that contribute to agency costs will as well be discussed. During the text it will be assumed that management is acting on behalf of shareholder’s best interest, except if mentioned otherwise.
2.4.2 Debt overhang – underinvestment
The debt overhang problem arises when a firm declines positive NPV projects because the amount of underwritten debt needed to finance the project is too large [see Myers (1977) and Mayers and Smith (1987)]. The explanation is that shareholders would be paying the expenses to take on the project. Yet, the payoff wouldn’t exceed the nominal value of the debt. Shareholder wealth would be transferred to the bondholders.
The following example illustrates this situation:
Let’s imagine the firm has contracted a debt of 15’000 R$ and has 0 R$ of liquidity. The company has an opportunity to invest in a project. It gives a guaranteed immediate payoff of 18’000 R$ and costs 4’000 R$ – hence a firm value adding project of 16’000 R$. Following table shows the different scenarios and their respective outcomes:
Table 5: Debt Overhang Example
Expected equity value Expected bond value Project is accepted -1000 R$ 15000 R$ Project is refused 0 R$ 0 R$
35 Schweser notes CFA level 1 book defines Net present value (NPV) as: “the sum of the present values of
all the expected incremental cash flows if a project is undertaken. A positive NPV project is expected to increase shareholder wealth, a negative NPV project is expected to decrease shareholder wealth, and a zero NPV project has no expected effect on shareholder wealth.”
As we can see a firm acting on shareholders’ interest will refuse the project. The overall NPV is positive but calculated on the shareholder’s perspective it is negative. If we suppose the firm has 4000 R$ of liquidity it would still not do the project. Shareholders would be better off receiving that money in the form of dividends. Indeed, the project would make them earn 3’000 R$ while the dividends 4000 R$. Until the cash flows are superior to the earning the NPV project gives to shareholders, the debt overhang problem will persist.
The debt overhang problem is likely to be more severe for firms with significant growth and investment opportunities as the foregone gains will be higher. Moyen (2007) shows that loss from operations due to the overhang problem varies between 2.6-5.0% of firm value.
2.4.3 Empire building or the free cash flow problem – overinvestment
In this case we will presume that managers act on their own interests and not on those of shareholders.
The empire building problem arises when the firm contracts a substantial amount of free cash flow. In other words the amount of cash flow exceeding what is needed to finance a project. In such a situation, managers may be tempted to use this free cash flow to maximize their own pecuniary and non-pecuniary benefits [see Blanchard, López-de-Silanes and Shleifer (1993)]. That is, to invest funds in negative NPV projects solely as a means to firm expansion.
Indeed it is shown that there is an important correlation between the size of the firm and the salary of a manager [See Sung and Swan (2008)]. Also, one of the managers’ most important assets is his reputation. By pursuing an empire building strategy, managers can enrich their human capital while increasing the prestige around their undertaken function.
2.4.4 Asymmetrical information and hedging
To reduce the debt overhang and risk shifting problems, the bondholders may be tempted to impose specific restrictions or covenants. These would serve to monitor the firm’s decisions. However, this may reveal itself quite costly. Furthermore, bondholders may be suffering from an asymmetry of information. It might become unclear for them whether the firm is facing a debt overhang or a risk shifting problem. In either of these
cases, the firm will suffer a deadweight loss. We will now proceed to seeing how hedging can reduce the latter.
As we have seen many agency conflicts are the source of debt issues. Risk exposures increase the variability in profits and firm value. But this not all – leverage is also impacted. Indeed a variation in firm value affects its worth in proportion to debt value. This agency concept is illustrated in the following graphic:
Figure 9: Hedging And Debt Overhang
36
Here, firm value is impacted by oil price movements. The dotted lines represent firm value in a perfect market. The grey area represents the dead weight losses. When the price rises, firm value falls and leverage increases – exacerbating agency problems. Notice how the light grayed area is wider than the darker one. Indeed, hedging risk exposures lowers leverage variability – and consequently expected agency costs.
The next graphic illustrates the same concept but for the empire building problem:
36
Figure 10: Free Cash Flow Problem And Hedging
37
By hedging the company reduces the volatility of its free cash flow, attenuating its upward potential. Managers are now less likely to pursue overinvestment strategies for the sole reason of expanding the company. Again, notice how the light grayed area is wider than the darker one. Hedging reduces this agency cost and consequently increases firm value.
As we can observe hedging to reduce expected agency costs will be quite similar to reducing expected CFD. These two strategies are not mutually exclusive. Rather they are complementary. For example, a firm might be primarily concerned of its balance sheet insolvency but still decide to hedge cash flows due to concerns of an empire building problem.
However, a drawback of this hedging motive is that the literature does not specify to which extent the firm should hedge its cash flows. Hence, we will consider it as a secondary motive to hedging.
2.5: Hedging and financial constraints
Firms are said to be financially constrained when they lack internal funds to finance their needs and that external capital comes at a high cost. Such a situation hinders firm
37
value. Indeed, a corporation might not be able to finance all of its investments. Furthermore, expensive external capital will negatively affect the NPV of its projects.
Due to market imperfections, seeking funds from external capital is almost always more expensive than internal funds. But, some firms have a much more expensive cost of capital than others. Usually lower proportions of collateral assets and higher amount of external capital already used increases the cost of capital. Other factors such as information asymmetry between external parties and the firm may also be significant.
Some firms may find that hedging to reduce financial constraints is their value maximizing strategy. If such is the case their end goal is to reduce their demand of external capital. Hence, they should hedge cash flows to minimize the probability that internal funds fall below the total volume of positive NPV projects [See Ammon (1998)]. However, firms will want to hedge their risk exposures differently depending on the correlation between their cash flows and their investment opportunities. If both are strongly negatively correlated, the firm may want to over hedge its exposures. Indeed, the demand for funds (investment opportunities) will be severely misaligned with the supply of funds (cash flows). Overhedging will exploit the risk exposure to lower cash flows when they are unnecessarily high, and increase them when they are too low. The opposite holds true as well. If cash flows are strongly correlated to investment opportunities the firm may want to only partially hedge its risk exposures [See Froot, Scharfstein and Stein (1993)].
Firms that are small have high growth opportunities and a low proportion of collateral will usually profit the most from this hedging motive. Indeed, smaller firms tend to generally have increased volatility in their cash flows and tend to be riskier [See Beck et al (2005). High growth firms tend to have higher opportunity costs of abandoning or not starting their investment projects [See Li (2011)].
Another interesting point worth examining is how hedging can diminish the cost of capital:
Cost of debt
Chen and King (2013) analyze a sample of 2'612 American firms from 1994 to 2009 to see the effects on the cost of debt for hedgers. For investment grade rated firms they find a lower cost of debt for hedgers compared to non-hedgers of 19.2 basis points. For speculative grade issuers they find a lower cost of debt for hedgers compared to
non-hedgers of 45.2 basis points. This seems to show that hedging not only reduces specific risk but also the systematic one.
Cost of equity
Gay, Lin and Smith (2007) analyze a sample of 1’541 non-financial firms in 1992-1996 and 1’384 non-financial firms in 2002-2004. They find that derivative users have a lower cost of equity of between 20 to 90 basis points compared to non-derivative users.
The following graphic shows the cost of capital across the BRIC and a few European countries:
Figure 11: Cost Of Capital Brazil Vs Rest
38
Because most foreign subsidiaries settled in Brazil will be either American or European firms, their cost of capital should be relatively higher than their parent company. The paper of Crisóstomoa, López-Iturriaga, Vallelado (2012) argues that the low degree of shareholder protection and the high interest rates in Brazil are important factors for explaining this relatively higher cost of capital. The results of their study also suggest that Brazilian corporations may face higher financial constraints compared to advanced economies.
2.6: Hedging to reduce taxes
2.6.1 Taxes – progressive tax structure
38
http://www.duffandphelps.com/sitecollectiondocuments/articles/DUF_COC_Emerging_Markets_Sept_20 10.pdf
A firm who has a progressive tax structure may benefit from hedging by increasing its after-tax cash flow value [see Stulz (1984) and Smith and Stulz (1985)]. The more concave the tax structure is, the more it is beneficial to hedge tax earnings. When facing a digressive tax structure it will on the contrary have a disincentive to hedge. This can be explained by the convexity of the tax structure; progressive taxes are concave whereas digressive taxes are convex.
Following is a simple example to illustrate this concept:
Let’s suppose there’s a progressive tax structure. Any income superior to 150’000 R$ will be taxed at a 35% rate. And any income inferior or equal to that amount will be taxed at 25%. Now let’s presume there are two possible scenarios: the first, the firm hedges all risks and the income will amount to 150’000 R$; the second, the firm doesn’t hedge and it is as likely to earn 75’000 R$ or 225’000 R$. The table underneath shows the possible scenarios:
Table 6: Hedging Progressive Tax Structure
Income>150'000 R$ taxed 25%; Income<=150'000 R$ taxed 35%
Income Taxes Expected tax
No risk (hedge) 150'000 R$ 37'500 R$ 37'500 R$ Risk (no hedge) 75'000 R$ or 225'000 R$ 18’750 R$ or 78’750 R$ 48’750 R$
As we can observe the expected taxes are higher in the second scenario with no hedging. Reducing the volatility of pretax income lowers the volatility of expected taxes as well. Firms will want to minimize the volatility of tax earnings to apply this hedging motive [See Ammon (1998)].
In Brazil the corporate tax structure is more or less linear: 15% are basic income taxes; 9% are for social contributions and an additional 10% is taxed for annual incomes greater than 240’000 real.39 Most multinationals will earn much more than 240’000 real.
39
http://www.kpmg.com/global/en/services/tax/tax-tools-and-resources/pages/corporate-tax-rates-table.aspx
They will be inclined to pay a corporate tax rate of 34% even when taxable income. Hence, we will consider it as a secondary hedging motive.
2.6.2 Taxes – tax shield and optimal capital structure
Hedging increases a firm’s debt capacity by lowering the probability of default [See Leland (1998)]. The corporation could exploit this by hedging and purposely increasing its leverage subsequently. Interest payments would serve as a tax shield, due to being deductible. The newly issued debt would serve for stock buyback. As articulated by Ross (1996) this hedging motive enables “the firm to substitute tax-benefitted risk, in the form of leverage, for non-tax-benefitted risk”. In other words risk management would function as a direct tool to substitute equity for debt while making the firm benefit from lower taxes. This would not only restructure the firm’s capital structure, but also directly have an impact on the concentration of equity ownership. Graham and Rogers (2002) calculate that the increase in debt capacity associated with hedging increases firm value by an average of 1.1%.40
As can be noted, leverage creates a tradeoff between the tax deduction gained from the accumulation of debt and the loss due to the exacerbation of expected CFD. The following graphic illustrates these concepts:
40
This gain is probably lower in Brazil. Indeed the USA (where the study was conducted) has a corporate tax rate that reaches 40% compared to Brazil’s 34%. The USA also has a lower cost of capital.
Figure 12: Firm Value And Optimal Debt Value
41
The blue line represents the firm value under the paradigm of Modigliani and Miller with no CFD. The red line represents the firm value with the existence of taxes and CFD. Firm value is maximized when the cost of capital is minimized. The intuition is to understand that lowering the cost of capital consequently increases the present value of future cash flows. This assumption holds true only when the firm doesn’t undergo any financial constraints.
Because cash flow distributions are dynamic it might not be possible to predict them at their fullest extent. A corporation, at its point of optimal capital structure might have to suddenly raise debt due to a new turn of events. Or similarly an unexpected loss would affect the value of equity. These situations would overlever the firm. For financial policy purposes, it then becomes interesting to know whether a firm is more harmed from being underlevered or overlevered. The following graphic demonstrates this:
41
Figure 13: Underlevered Vs Overlevered
This graphic was made by a paper of Graham et al in 2010. They calculate the optimal capital structure for their sample to see how leverage affects book value. As we can see in doubt of upcoming events it would be best for a firm to err on the side of a lack of leverage than an excess. Hedging strategies should then also follow this premise.
On another but similar note a survey of Graham and Harvey (2001) show that concerning capital structure, 44% of the managers report having a mostly well-defined target ratio. According to the respondents the most important factors affecting debt policy are financial flexibility (59.4%), credit rating (57.1%), cash flow volatility (48.1%), cash flow shortage (46.8%) and tax deduction (46.4%). From this study, we can see how hedging for tax incentives could be a potent tool for managers. However, financial flexibility and the limitations induced because of financial constraints have a bigger priority.
With all that has been said, we can observe that hedging for tax shield incentives is very different than the other motives already discussed. Firms will benefit most of this hedging strategy if their taxable income is constant, the CFD are low and that they don’t suffer from financial constraints. Also, they have to accept to restructure their corporate and ownership structure.