HAL Id: hal-02428406
https://hal-cnrs.archives-ouvertes.fr/hal-02428406
Submitted on 5 Jan 2020
HAL is a multi-disciplinary open access archive for the deposit and dissemination of sci-entific research documents, whether they are pub-lished or not. The documents may come from teaching and research institutions in France or abroad, or from public or private research centers.
L’archive ouverte pluridisciplinaire HAL, est destinée au dépôt et à la diffusion de documents scientifiques de niveau recherche, publiés ou non, émanant des établissements d’enseignement et de recherche français ou étrangers, des laboratoires publics ou privés.
based on U–Th dating, laminae counting and yttrium
and REE concentrations of recent carbonates in
underground aqueducts
Edwige Pons-Branchu, Eric Douville, Matthieu Roy-Barman, Emmanuel
Dumont, Philippe Branchu, François Thil, Norbert Frank, Louise Bordier,
Wolfgang Borst
To cite this version:
Edwige Pons-Branchu, Eric Douville, Matthieu Roy-Barman, Emmanuel Dumont, Philippe Branchu, et al.. A geochemical perspective on Parisian urban history based on U–Th dating, laminae counting and yttrium and REE concentrations of recent carbonates in underground aqueducts. Quaternary Geochronology, Elsevier, 2014, 24, pp.44-53. �10.1016/j.quageo.2014.08.001�. �hal-02428406�
A geochemical perspective on Parisian urban history based on U-Th dating,
laminae counting and yttrium and REE concentrations of recent carbonates
in underground aqueducts.
Edwige Pons-Branchu1*, Eric Douville1, Matthieu Roy-Barman1, Emmanuel Dumont3,
Philippe Branchu3, François Thil1, Norbert Frank1, 2 , Louise Bordier1 and Wolfgang Borst3 1- Laboratoire des Sciences du Climat et de l'Environnement (IPSL/LSCE CNRS-CEA-UVSQ, UMR 8212), 91198 Gif-sur-Yvette Cedex, France.
2- Institute of Environmental Physics, Heidelberg University
3-CEREMA: Direction territoriale Ile-de-France, 12 rue Teisserenc de Bort, 78190 Trappes *Corresponding author: email: edwige.pons-branchu@lsce.ipsl.fr. Telephone: ++ 33
(0)169823522
Abstract
Two laminated carbonate deposits from the wall of an underground aqueduct, built between the 13th and 15th century, in Paris, France, were studied to provide historical information about nearby human occupation and urban development. To obtain a robust chronology for these small (29 and 45 mm thickness) and very young deposits< 800 a based on the probable date of aqueduct construction, we adopted two methods: laminae counting and U-Th analysis. For laminae, we tested the hypothesis that their deposition is bi-annual. Concerning U-Th dating, the influence of inherited 230Th on calculated ages is discussed and detrital 230Th/232Th values for each speleothem was determined using stratigraphic constraints and found to be significantly different despite their close proximity. In these speleothems, that precipitated over approximately 300 a according to U-Th dating, the number of laminae is similar, and two laminae were deposited each year. A lamina-counting chronology was used to interpret the rare earth elements and yttrium content (REE + Y) variations measured by ICP-QMS as historical variations in water quality in relation with the anthropogenic use of these elements, with a marked increase in the REE + Y concentrations since the second half of the twentieth century. A marked negative Ce anomaly in the NASC-normalized REE trend is evidenced, and is more pronounced for post 1850s. This anomaly could be due to prior precipitation of Ce4+ before the water reached the aqueduct, related to a high organic matter content of the water in oxidizing conditions. The increase in the Ce anomaly could indicate a second source of water, from a wastewater collection system or a modern water conveyance system. We thus demonstrate the interest of using these annual carbonate deposits in urban areas as a proxy for the history of urbanization or human activities.
Keywords : urban speleothems, relative chronology, U-Th dating, urbanization impact on
water quality, Rare Earth Elements, Yttrium. Highlights:
We test the potential of urban speleothems as a natural archive for the history of the impact of urbanization on water chemistry
We compare absolute (U-Th) and relative chronologies for young speleothems
We discuss corrections for detrital 230Th for U-Th dating using stratigraphic constraints
We evidence a high REE and yttrium content in infiltration waters in Paris since the mid- twentieth century
1 - Introduction
Historical archives are useful as chronicles of urbanization, but not for geochemical or hydrological reconstructions. A few natural archives can be used for this purpose, such as dendrochronological work, which has enabled some anthropogenic pollution episodes to be determined in rivers (Saint-Laurent et al., 2011) or air contamination (Hirano and Morimoto, 1999; Nuhoglu, Y., 2006; Stravinskiene and Šimatonyte, 2008), or trace element contents in river sediments, which have been used to document the use of some metals for industrial or domestic purposes (e.g. Petelet-Giraud et al., 2009; Ayrault et al., 2010). Speleothems from natural caves have also made it possible in some cases to determine anthropogenic influences such as deforestation (Ku and Li, 1998). Our aim here is to test an innovative approach for urban history reconstruction using a geochemical record in urban secondary carbonate precipitates, or speleothems.
Speleothems are secondary mineral deposits that form by CO2 degassing or evaporation of
water containing HCO3- and Ca2+. These waters also contain trace elements dissolved from
the host rock or from the soil. In karstic systems, the content of these trace elements varies with climate or environmental changes (e.g. Hellstrom and McCulloch, 2000; Bourdin et al., 2011). In urban zones, climate variations (temperature, amount and distribution of rainfall throughout the year) will have an effect on carbonate deposits, but the principal factors influencing the variation in drip-water chemistry will of anthopogenic naturebe (e.g agricultural or industrial pollution, automotive emissions, waste products etc.). Moreover, the source of the water may not necessarily be meteoric precipitation, but also drinking water or wastewater collection systems. Furthermore, in urban areas, urbanization has an influence on water infiltration within the sub-surface aquifer through construction of impervious layers, or rerouting via artificial drainage and more. a.
Throughout history, a large number of artificial galleries have been built beneath Paris, France. One of them, in the northern part of the city, is an underground aqueduct, the Great Aqueduct of Belleville, which has been known since at least the 15th century, but may have been constructed earlier, during the 18th century. The exact construction date is not known (Bellegrand 1877, Bonamy, 1754). Secondary carbonate deposits were found on the wall and the floor of the gallery. The goal of our study was to test the use of these “speleothem-like” deposits for the historical geochemical reconstruction of the quality of the water that infiltrated into the aqueduct. We aim to use this geochemical record in a historical perspective in order to link water quality and past human activities. One of the main challenges for the use of this archive is to obtain a robust chronology of these deposits.
U-series disequilibrium methods typically used to date carbonate deposits younger than 500 ka, but the technique is challenging to use on very young (< 1 ka) samples, because of the low concentration of 230Th ingrowth from decay of 234U decay, leading to difficulties in accurate measurement and correction for inherited 230Th (Hellstrom 2006; Hua et al., 2012). In this paper, we present the study of two flowstones sampled in one of the galleries of the Belleville aqueduct. We discuss the choice of appropriate values for 230Th/232Th in the detrital phase, using published values or stratigraphic constraints. We then compare radiometric ages with laminae counting in order to discuss the origin of the lamination observed in the studied samples and the annual laminae deposit hypothesis. Finally, we use the chronology of the flowstones to reconstruct the temporal evolution of REE and Y in the Parisian subsurface groundwaters over the last three centuries.
The study site is located in the Mallassis plateau, in the northeastern part of Paris (Figure 1). In this plateau, permeable and impermeable sedimentary levels of the Oligocene period alternate, allowing the existence of two independent groundwater aquifers. The more superficial level flows within fine well-sorted sand (Fontainebleau sands) and the other, through limestone (Brie limestone). These groundwaters were first drained in the 1100s by religious communities to meet their needs and help them provide care for the sick. In the 1200s (or early 1300s), the City of Paris began the construction of its own network of drains to supply public fountains. Over centuries, these water supply systems were improved to finally form a very diffuse and well-developed network of drains (called "pierrées") and aqueducts, which is known as the "Northern Spring" (Figure 1). Although this groundwater stopped being used as drinking water during the 1800s, many vestiges still remain today. The network built by the City of Paris is well preserved, and most of the great aqueduct of Belleville, a 1050 m long gallery which was the main collector for secondary conduits, can still be explored. Despite an extensive archival search, the age of this gallery has never been determined. A commemorative plaque above the entrance to the gallery relates that 200 m of the gallery were repaired in 1457 AD, which suggests that the gallery is older (Bellegrand 1877, Bonamy, 1754). However, those repairs could have also been made on a former and less magnificent gallery.
Some of the historical manholes and the main gallery were explored during this study. In part of the aqueduct, carbonate deposits are found in the wall and the floor of the galleries. These carbonate deposits are vadose speleothems precipitated from water flowing into the aqueduct. During 2011 AD, we sampled two flowstones, Bel 0 and Bel 2, which had developed in the wall of one the main galleries, approximately 200 m apart. They are thought to have grown from water flowing from the roof of the galleries. Bel 0 and Bel 2 exhibit axial growth thickness of 29 and 45 mm, respectively. They are composed of finely laminated calcite (RX determination). Their surfaces present a dark thin layer. The samples were cut in slices along the growth axis for thin section preparation.
3-Analytical methods
3.1. U-Th dating
Sub-samples were cut using a microdrill at the base, the middle and the top of Bel 0 and Bel 2 flowstone. For both speleothems, a second sub-sample was cut laterally at the top of the sample. For Bel 0, we removed the dark fine layer in both samples. For Bel 2 we removed it for only one of them. Samples sizes for U-Th analysis were 250 to 700 mg of powdered calcite. U-Th separation and purification was performed following a procedure modified from Pons-Branchu et al. (2005) and Douville et al. (2010).
After adding a 229Th-233U-236U spike in a Teflon beaker, samples were dissolved with diluted HCl. For samples larger than 400 mg, U and Th were coprecipitated with Fe(OH)3. The
precipitate was washed with water, dried and dissolved in HNO3. The U-Th separation and
purification was performed on a 0.5 ml column filled with U-TEVA resin in 3N HNO3. The
Th fraction was eluted using 3N HCl and the U fraction using 1N HCl. The samples < 400 mg were directly separated using U-TEVA resin. If Ca and other major elements remained in the final fraction after drying, a second purification step was performed for the Th fraction. A small amount of pre-filter resin was added in the bottom of the column, above the U-TEVA resin, in order to eliminate small particles or colloids from the resin that could affect the stability of the signal during MC-ICPMS analysis.
The U and Th isotopic composition was analyzed on the Thermo Neptune Plus multi-collector inductively coupled plasma mass spectrometer (MC-ICP-MS) installed at the Laboratoire des Sciences du Climat (LSCE, France). For U and Th mass fractionation correction, we used the
exponential law (normalized to the 238U/235U isotope ratio of 137.88, Cowan and Adler 1976) and standard-sample bracketing (using as standard a mixture of our triple spike and HU-1, a commonly-used uraninite standard, assumed to be in secular equilibrium). Thorium-230 and
234
U were measured on the axial electron multiplier, in jumping mode, while 229Th, 232Th,
233
U, 236U, 235U and 238U were measured on a Faraday cup. In order to measure all the isotopes during the same sequence, we mixed U and Th fractions in sufficient proportions to be able to
measure the signal at mass 229 and 233 between 2 and 30 mV and 238U between 3 to 15 V on
a Faraday cup. Raw data were corrected for peak tailing, hydride interference and chemical blanks.
U-Th ages, initial activity ratio of 230Th/232Th (or (230Th/232Th)A0)and the
corresponding uncertainties were calculated following the stratigraphic method developed by Hellstrom (2006). It is based on a Monte Carlo simulation computed using the Octave software (http://www.gnu.org/software/octave/). For each iteration, random values are generated to simulate:
1- measured (234U/238U), (232Th/238U) and (230Th/238U) activity ratios expressed as (234U/238U)A, (232Th/238U)A and (230Th/238U)A (with Gaussian distributions centered on the
mean measured ratios with 2 represented by by 2 SEmean)
2- mean (230Th/232Th)A0 of the speleothem: (230Th/232Th)A0mean. It was chosen within a
large range of plausible values (exponential distribution of the activity ratio ranging from 0.1 to 30)
3- maximum percentage of variability of (230Th/232Th)A0 within the speleothem
(uniform distribution ranging from 0 to 100%): vmax.
4- for each sample analyzed in the speleothem, a specific (230Th/232Th)A0 within the
range defined by the mean (230Th/232Th)A0 and by the maximum percentage of variability:
uniform distribution ranging from (230Th/232Th)A0mean × (1 - vmax) to (230Th/232Th)A0mean × (1 +
vmax).
Step 4 defines the individual (230Th/232Th)A0 ratios of each simulated sample of the
speleothem. It differs from step 2 and 3 that define the global characteristic of the (230Th/232Th)A0 ratio along the speleothem, but that does not determine the specific
(230Th/232Th)A0ratio at a given depth, for a given subsample of the speleothem). Sample ages
were calculated for each iteration with the randomized values obtained at steps 1 and 4. Ages were calculated assuming that the decay of the 234U activity and the decay of the initial 230Th activity are insignificant the very recent samples considered in the present work (Cheng et al., 2000). Using activity ratios, ages are then given by:
A A A A U U Th Th U Th U Th t 234 238 230 0 232 230 238 232 238 230 / / / / Any iteration for which the calculated ages were not in the stratigraphic order or negative ages were obtained were discarded. About 106 iterations were performed, to obtain more than 103 valid solutions with positive ages in the stratigraphic order and a variability of the (230Th/232Th)A0 lower than 30% (see Result and Discussion sections for the choice of
30%). Only these valid iterations were averaged to determine the most probable ages and (230Th/232Th) A0 in the speleothem.
3.2. Laminae counting
Thin sections for Bel 0 and Bel 2, observed under optical microscope, present clear laminae for much of the surface (Figure 2b). Each section was photographed under stereo microscope (LEICA S6D) using a video camera (Sony - SSC-DC14/14P/18P). Three transects of each
thin section were photographed. Four to seven pictures cover one transect, with parts of the thin section being repeated in two images. These pictures were used for laminae counting.
3.3. Quantification of rare earth elements and yttrium (REE + Y) by ICP QMS.
Samples of 10- 20 mg of calcite were taken using micro diamond burs along the growth axis of Bel 0 and Bel 2. The powdered samples were dissolved in 0.5N HNO3 and the solutions
adjusted to 100 ppm Ca as described in Bourdin et al. (2011). The REE, Y and Mn analyses were performed with a Quadrupole ICP-MS (ICP-QMS) XseriesII Thermo Fischer Scientific at the LSCE. The analytical protocol, based on the standard addition method for Ca-100 ppm, is detailed in Bourdin et al. (2011).
Trace-grade HNO3 and Milli-Q water were systematically used for dissolutions and
dilutions. The values are given with 5% precision for Mn and light REE, and 10% for heavy REE, based on reproducibility (relative standard deviation) of the measurement of dissolved carbonates, reference JCp-1, (aragonite coral) and NIST 1640a. The accuracy of the measurements was monitored by the analysis of rock standard treated as samples: GSR6, CCH-1 and DWA. Among REE, Eu was not considered because of suspected isobaric interferences with BaO.
4-Results
4.1. U-Th results and correction for initial 230Th.
Uranium content varies between 1.56 to 3.46 ppm for the two speleothems, Bel 2 having higher U concentrations than Bel 0, and (234U/238U)A is close to equilibrium, except for
the bottom sample of Bel 2 (Tab. 1). The 232Th content is lower than 28 ng/g. The (230Th/232Th)A varies between 2.95 and 27.33 (Tab. 1). These low ratios suggest that a large
part of the 230Th measured was present at the time of the flowstone formation and was a result of in situ by the decay of 234U.
The (230Th/232Th)A0 ratios were determined with the stratigraphic method, using all samples
for Bel 0 and Bel 2. For Bel 0, it is possible to keep samples in the stratigraphic order by correcting ages with a constant value of (230Th/232Th)A0 throughout the speleothem
(supplementary information Appendix EA1a). For Bel 2, a variability of at least ±16% of (230Th/232Th)A0 is required to maintain the stratigraphic order (supplementary information
Appendix EA2a). In addition, in order to obtain modelled ages consistent with lamina ages, a minimum variability of ± 30% is required for the (230Th/232Th)A0. Following Hellstrom
(2006), we conservatively use a variability of ± 30% for (230Th/232Th)A0 throughout both
speleothems (see section 5.1). Median, maximum and minimum values of the initial ratio and U-Th ages are reported rather than mean and standard deviation, because the distributions of the values are non Gaussian (supplementary information Appendix EA1b-f and EA2b-f). The values of (230Th/232Th)A0 determined for Bel 0 and bel 2 are, 2.9 (+1.5/-1) and 4.6 (+0.9/-1)
respectively..
All ages are expressed in years (a) before 2012 (the date of sampling and analysis to be compared with laminae counting). When propagating errors, the corrected ages with high detrital content have large error bars (Table 2), but respect the stratigraphic order (Figure 2). These flowstones developed in a similar context, approximately 200 m apart and pass through the same host rock. The difference in the detrital phase, coupled with the different U content in the samples, suggests considerable heterogeneity within the host rock and surface and/or different water transfer pathways. The age of the oldest levels are 333 (+27/-50) a for Bel 0 and 802 (+751/-560) a for Bel 2. For Bel 2, at 33 mm from the top (2/3 of the sample height) the U-Th corrected age is 309 (+103/-221) a and gives the lowest limit for the base of the sample. Thus, the beginning of the growth of these two flowstones could be contemporaneous according to the U-Th dating, at around 300 – 350 a. The younger levels at 80 (+261/-80) a
for Bel 0 and 19 (+100/-19) a are consistent with actual/subactual growth for the top of the speleothems.
4.2. Dating by laminae counting
Laminae are visible for most of the two sections (see Figure 2). In approximately 10% of the sections, laminae are poorly visible or absent. For these zones, the number of laminae was extrapolated using the mean number of laminae per cm. The total number of laminae is thus 598 for Bel 2 and 602 for Bel 0. Differences between several countings for the same thin section but using several transects were used as the “count error” for both sections. This error is close to 20 laminae for both samples (17 for Bel 0 and 21 for Bel 2). The error on the laminae age, includes the counting error and the errors for the extrapolation zone, and is estimated to be 15 a.
It should be mentioned that while the number of laminae is quite constant throughout the sections, the thickness of the sections is not the same (45 mm for Bel 2 and 29 mm for Bel 0). Thus, growth rates and the mean laminae thickness vary between the two samples but are constant within a sample. The growth rates assuming annual lamination (two laminae per a, see discussion section) are respectively 0.1 and 0.15 mm/a for Bel 0 and Bel 2 with a mean laminae thickness of 48 m and 75 m.
4.3. Rare earth elements and yttrium (REE + Y) and Mn content
Eu was not considered in this study because of suspected isobaric interferences with BaO during the analysis. The REE + Y concentrations measured for Bel 2 and Bel 0 (Table 3) are higher than values previously reported for speleothems. For example, La concentrations range from 115 and 5993 ppb in this study, compared with 8 to 17 ppb in the Chauvet cave, France (Bourdin et al., 2011) and 3.9 to 570 ppb in Songjia Cave in central China (Zhou et al., 2008). The Y concentration (Table 3) ranges from 0.12 to 3.17 ppm in our study, whereas in caves from Morocco it is < 0.1 ppm for two stalagmites and < 1 ppm for another stalagmite (Wassenburg et al., 2012). For comparison, the 232Th content in these speleothems from Morocco is about 100 ppt for the richest Y speleothem, below 232Th content in Belleville speleothems.
When REE + Y is plotted against the laminae counting ages (Figure 3a), a strong enrichment in REE + Y is observed since the 1940s for both speleothems, with the maximum of REE + Y in the 1940 +/-15 AD for Bel 0 (ca 22.4 ppm) and at the last level analyzed (2004 +/- 15 AD) for Bel 2 (close to 11.8 ppm). In order to assess the potential sources of REE, the concentrations were normalized to a reference, here the North American Shale composite
(NASC, Gromet et al., 1984). NASC-normalized values are labeled REEn and are calculated
as the ratio between the measured concentration and the reference concentration: REEn=REE/REEref.
The normalized trends evidence a marked Ce depletion, with lower values for Cen than
general trends observed for REEn (Figure 4). This Ce anomaly can be quantified by comparing
the behavior of Ce with its closest neibourghs, La and Pr. Ce anomaly is defined as: Ceanomaly = 2×Cen /(Lan + Prn)
The Ce anomaly varies between 0.14 and 0.63. The mean Ce anomaly is similar in Bel 0 and Bel 2 (0.32), but the evolution with time is slightly different. This anomaly is not correlated with Mn concentrations (Figure 3b).
Bel 0 displays a REEn pattern depleted in heavy REEn (HREEn) compared to light
REEn (LREEn). For Bel 2, a major part of the sub-samples displays a depleted trend in HREE
but also a part with no depletion or a slight HREE enrichment. This depletion or enrichment in HREE can be expressed by the ratio of Prn/Ybn (LREEn/HREEn). The Prn/Ybn ratio varies
between 0.72 and 3.27, with a mean at 1.69 for Bel 2. For Bel 0, this parameter varies between 1.34 and 5.45 with a mean value at 3.40 (see Table 3).
5-Discussion
5.1. Determination of (230Th/232Th)A0 and impact on the U-Th ages.
The values of (230Th/232Th)A0 obtained for Bel 0 and Bel 2 are significantly higher than
the average crustal ratio (0.9 ± 0.5). Therefore the ages calculated with the average (230Th/232Th) crustal ratio are not in the stratigraphic order and some ages are clearly too old (Table 2). This illustrates the problems that can emerge if using this average crustal (230Th/232Th) ratio as a default value (Hellstrom, 2006).
The possible range of (230Th/232Th)A0 ratio depends on the extent of the variability of
this ratio within a flowstone. This variability may arise from heterogeneity of the rocks through which the water flows before precipitating the speleothem and/or from the occurrence of µm-size particles with distinct U-Th ratios (Marchandise et al., 2014) that can be carried and deposited by the flowing water. Bel 0 and Bel 2 developed in a similar context, approximately 200 m apart, and they are likely to have precipitated from water flowing through the same host rocks. The difference of (230Th/232Th)A0 suggests significant
heterogeneity within the host rock and/or different water transfer pathways. For Bel 2, the stratigraphic method requires at least 14% of variability of (230Th/232Th)A0. In addition, in
order to have consistent results between U-Th and counted ages, the variability of (230Th/232Th)A0 must be of at least ±30%. However, any value of the variability larger than
30% would allow to keep the stratigraphic order and to have U-Th age compatible with counted age. Hellstrom (2006) attributed a conservative variability 25% to a speleothem for which he obtained a minimum variability of 10%. Our choice of ±30% of variability for a minimum variability of 15% is in line with Hellstrom (2006). Although it is not required by the simulation, we also assume that the (230Th/232Th)A0 can vary by ± 30% in Bel 0 to
estimate the uncertainty on the ages because if there is a variability of (230Th/232Th)A0 along
Bel2, a variability may also exist along Bel 0.
When propagating errors, the corrected ages with high detrital content have large error bars (Table 2), but respect the stratigraphic order (Figure 4). Among all the analyzed samples, sample Bel 0 27-29 mm/top and Bel 2-30-34 mm brings the strongest constraints on the ages of the speleothem because they are both old and with a high (230Th/232Th) that reduces the impact of the uncertainty on the initial 230Th correction.
5.2. Chronology
Because part of the speleothems is laminated, with alternate visible white and dark layers or more and less luminescent layers, a large number of studies since the pioneering work by Allison (1926) have attempted to demonstrate that this lamination is annual or sub-annual, and that it can be used as a chronological tool as is done for dendrochronology or ice layers in icecaps. The origin of this lamination is related to the hydrological season and to the transfer of organic matter from soil (see the review by Baker et al., 2008, and references therein, e.g. Shopov et al., 1994; Baker et al., 1993, Frisia et al., 2003; Perrette et al., 2005; Boch et al. 2011) : the dark laminae are typically rich in organic matter and UV-fluorescent and generally deposited in autumn (organic matter flushing from soil), while the
white/translucent laminae, that are thicker, deposit during periods times of reduced soil organic matter input (winter, spring). Nevertheless, depending on the site location of the sample, this lamination does not have the same “tempo” in all the speleothems studied. In temperate regions such as western Europe, this lamination mostly represents two layers each year, one dark, thin, and fluorescent when observed in UV light, and another thicker, white and porous (Genty 1993; Baker et al., 1993, Frisia et al., 2003; Baker et al., 2008). In a recent study, Shen et al., (2013) compared laminae counting and high precision U-Th dating of a very high U-content speleothem from China. They demonstrated that the lamination is generally biannual, but that a small portion of the speleothem (ca 10-15%) reveals pluriannual laminae, resulting in a slight bias in age. They also demonstrated that in other parts, some hiatuses (missing laminae) can occur. In the case of urban speleothems, lamination has not yet been studied. For speleothems Bel 0 and Bel 2 that deposited in same conditions, but separated by 200 m, the first remarkable point is that they present the same number of laminae. Secondly, in each sample, the number of laminae per cm is quite constant but the growth rate differs between the two samples (0.1 and 0.15 mm/a). Thirdly, the U-Th ages confirm the annual laminae deposit.
For Bel 0, the radiometric age of the base is well constrained with a U-Th age of 1679 +27/– 50 AD and is consistent with the age determined by laminae counting 1711 ± 15 AD. For Bel 2, the U-Th age (1210 + 751/-560 AD) of the base is consistent with laminae counting for the same depth closed to the beginning of the sequence (1737 ± 15 AD at 41 mm from top) but has a larger error bar due to more extensive correction for detrital content (see Figure 5).
Cross-dating thus validates the annual lamination of these two urban speleothems. However, there are large uncertainties on the U-Th ages of these flowstones due to detrital fraction corrections. Therefore, in the following, we adopt the laminae counting as the base of our chronology. It requires determining the age of the top of the flowstone. The median age of the top of Bel 2 is young (19 a) but associated with a large range of values (0-110 a). Constraints on the top of Bel 0 are poorer. During the sampling, no water was observed on the flowstone. Nevertheless, several lines of arguments suggest that the age of the top flowstones is not more than 20 a or so: Occurrence of high REE levels must correspond to the 20th century and the highest REE concentration peak in Bel 0 (7 mm from the top or 1940+/-15 AD) is probably posterior to 1945 AD. Similar consideration hold other metals such as cadmium (Pons-Branchu, unpublished data).
The origin of the lamination could be the same as that of speleothems deposited in karst, with a difference in porosity and organic content between dark and white laminae. In an anthropogenic system (but not in an urban context), the presence of annual lamination has been demonstrated for a speleothem deposited in a tunnel in Belgium (Genty 1993). The case of urban speleothems such as Bel 0 and Bel 2 is more complex as they developed under an intensively urbanized town. Organic matter is present in urban waters that infiltrate within the soil as demonstrated by organic carbon measured in waters (unpublished data for water from this aqueduct). It also indicates that the sub-surface groundwater table that fed the aqueduct and the speleothems has flowed continuously since at least the 1700s and continues in the current context of intense urbanization. These speleothems could thus record changes is water quality since that time and be used to reconstruct the impact of urbanization by their trace element contents within laminae. These speleothems are very small (2.9 and 4.5 cm thick respectively) but the development of laser ablation analysis could be suitable for the future. One of the questions that remain open is why these speleothems started to grow at the beginning of the 18th century and not before, i.e. from the date of construction of the aqueduct (some 500 to 250 a earlier). This could be due to the maintenance of the aqueduct during its early existence, when this aqueduct was used as water supply, since historical archives report
regular cleaning of the calcareous deposits in aqueducts. Another hypothesis related to water pathways cannot be ruled out.
5.3. REE and Y content in the speleothems: Evidence for anthropogenic release in Paris.
The most striking feature of the REE and Y distribution in the Belleville speleothems is the sharp increase of the concentrations after 1940 AD. It must be clearly related to the increase of REE use by industry. The presence of these high levels confirms that the top of the speleothem has grown in the last decades and possibly until the date of sampling.
REE occur naturally in REE-phosphate minerals as in clays and Fe-Mn oxides (Marchandise et al., 2014). Monazite is a LREE-phosphate mineral used since the end of the 19th century for the Mischmetal alloy that was required for the manufacturing of gas lanterns and ignition systems for lighters and torches. The industrial use and sources of REE increased at the end of the 20th century for a large number of applications, including the manufacture of ceramics, glass and high technology products. Nevertheless, the maximum REE and Y contents are found in the Bel 0 and Bel 2 speleothems between the 1940-1955 AD and the present, with very low levels for the early period (1700-1940 AD). The increase in REY content since the middle of the 20th century could thus be due to the use of these elements for industrial purposes , with a marked episodic release within the local environment in north eastern Paris during the period 1940-1955 AD, as evidenced by the Bel 0 sequence. We note that, except for the Ce-anomaly, the REE patterns are smooth, showing no evidence for individual REE enrichment as expected for the latest use of REE in new technologies (Hatch, 2012).
Anthropogenic release of REE during the 20th century has already been observed in coastal sediments from the Santa Barbara Basin with an enrichment in LREE since the mid 20th century (early 1960s) (Olmez et al., 1991). Our study evidences a slightly earlier REE -Y input in Paris underground waters, with enrichment in LREE. In more recent studies, the anthropogenic release of REE is marked by a Gd positive anomaly, attributed to the extensive use of Gd for medical imaging (Bau and Dulski, 1996; Kulaksiz and Bau, 2007; Petelet-Giraud et al., 2009). This Gd anomaly is not observed here, due to low time resolution for the youngest ages or to the absence of medical waste in these waters.
Few studies have considered REE and Y in speleothems. They report low REE-Y concentrations and suggest that these elements are transported predominantly in the particle/colloidal phases (e.g. Zhou et al., 2012). A correlation between Mn2+ and REE3+ suggests that the factor controlling their content is the presence, on the annual time scale, of organic matter in the percolating water (higher in autumn and winter) and on a longer time scale, the importance of host rock weathering with different sources (Richter et al. 2004, Zhou et al., 2012). The REE-Y content of speleothems depends of the limestone/groundwater interaction and to the speleothem growth rate (Bourdin et al., 2011).
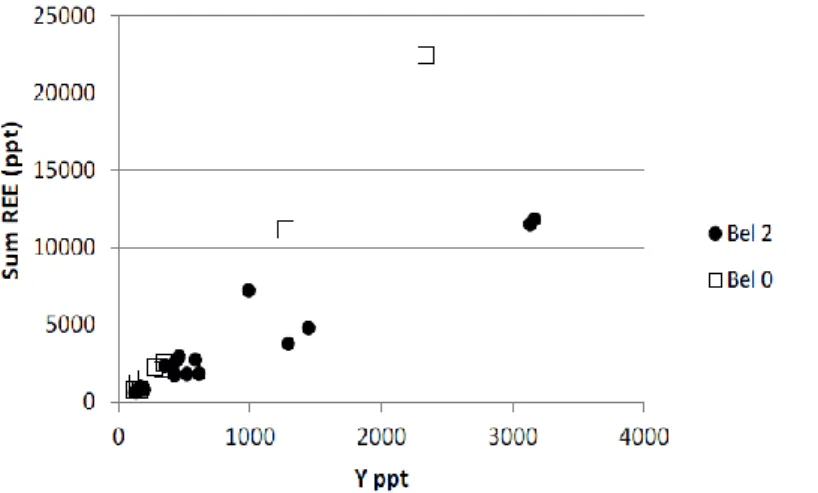
In the Bel 2 and Bel 0 speleothems, there is a marked Ce negative anomaly and a HREE depletion with respect to LREE (Figure 4 and 6a), the latter being much more pronounced for Bel 0. In the present study, there is no correlation between Mn and REE + Y (Tab. 3). This may be due to a high Mn input from anthropogenic activities with distinct sources for Mn and REE + Y. These two distinct sources are suggested by the trends observed for REE and Y (figure 7). Unlike the other REE, under oxidizing conditions, soluble Ce3+ is oxidized to insoluble Ce4+, which is easily adsorbed into Mn-Fe oxyhydroxides, organic particles or humic acids (Wright et al., 1987; Holser 1997; Pourret et al., 2008). This Ce uptake on solids particles induces a negative Ce anomaly in the water. The Ce negative anomaly recorded by Belleville speleothems suggest that Ce4+ precipitation occurred before the water reached the aqueduct. The Ce anomaly tends to increase since the 1850s AD, particularly in Bel 0 (see
Figure 6a). We would expect that the waterproofing of the urban surfaces during the 20th century should have induced a longer transfer time of water and hence more reducing waters and less Ce anomaly. Therefore, this increase of the Ce anomaly could provide evidence for a new source of subsurface water from the wastewater collection system or modern water conveyances.
In Bel 2, most of the analyzed samples display enrichment in LREE with respect to HREE. This enrichment is more pronounced for Bel 0. However, unlike the Ce anomaly, this parameter shows little no correlation with time (Figure 6b) and no correlation between the two speleothems, suggesting a different behavior of the water or of the water/host rock interaction despite their nearby location. However, these parameters do not enable the sources of REE and Y to be identified. While a fraction of the REE and Y may originate from the exchange between water and host rock, a major anthropogenic input has to be invoked to explain the high to very high concentrations measured in the more recent parts.
6-Conclusion
In this paper, we have studied two, thin, laminated carbonate deposits from a Medieval underground aqueduct in Paris, France. In order to test the potential of these archives for the reconstruction of urban history, we focused on the absolute and relative dating of these urban flowstones that develop by drip water from a sub-surface groundwater. We used stratigraphic constraints to determine the 230Th/232Th value of the detrital fraction in order to correct U-Th ages. The U-Th ages obtained demonstrate that the lamination observed within these speleothems is annual and that these speleothems both developed since the beginning of the 18th century.
Annual lamination counting can be used to establish a precise chronology that could then be applied for the reconstruction of water quality variations with time using trace elements trapped in the calcite layers. In this study, we illustrate the chronology of REE and Y content trapped within calcite layers that corresponds correspond to the anthropogenic release of these elements within water in the north eastern part of Paris; this release has been pronounced since the second half of the 20th century. A negative Ce anomaly was observed for the REE NASC normalized trend, and is more pronounced for recent times since the mid 19th century indicating a prior precipitation of Ce4+, which could be due to more oxidizing conditions. This increase in the Ce anomaly could thus indicate a second source of water since that time, from the wastewater collection system or modern water conveyance systems. We thus demonstrate the interest in using these carbonate deposits in urban areas as a proxy for the history of urbanization or human activities.
Acknowledgments:
The authors thank the “Association des Sources du Nord” (Gérard Duserre, Jean-Luc Largier, Jacques Paulic) and the Mairie de Paris (Bureau des Edifices Culturels et Historiques -
Direction des Affaires Culturelles) for access to the Belleville aqueduct, sampling facilities and historical information. A. Andriamalala and C. Constan are acknowledged for their participation in the sub-sampling and early discussion about the studied samples. Funding for this study came from the EC2CO (INSU/CNRS) program “Hydrohisteau” and “Paris 2030” Grant. We thank the 2 anonymous reviewers for their very constructive comments, and the editor for his help for the finalization of the paper. This is LSCE contribution n° 5353.
References
Allison, V.C., 1926. The antiquity of the deposits in Jacob’s Cavern. Anthropological Papers of The American Museum of Natural History, 19, 297-335.
Ayrault, S., Rianti, C., Evrard, O., Lefèvre, I., Bonté, P, 2010. Silver and thallium historical trends in the Seine River basin. Journal of Environmental Monitoring, 12, 2177-2185. Baker, A., Smart, P.L., Edwards, R.L., Richards D.A., 1993. Annual growth banding in a cave
stalagmite. Nature, 364, 518-520
Baker, A., Smith, C.L., Jex, C., Fairchild, I.J., Genty, D., Fuller, L., 2008. Annually Laminated Speleothems: a Review. International Journal of Speleology, 37 (3), 193-206.
Bau, M., Dulski, P., 1996. Anthropogenic origin of positive gadolinium anomalies in river waters. Earth Planet. Sci. Lett., 143, 245–255.
Belgrand, E. 1877. Les Travaux Souterrains de Paris, tome 3, Les anciennes eaux, Paris. Dunod editor.
Boch, R., Spötl, C., Frisia, S., 2011. Origin and paleoenvironmental significance of lamination in stalagmites from Katerloch Cave, Austria. Sedimentology, 58, 508-531.
Bonamy, P.N., 1754. Mémoire sur les aqueducs de Paris comparés à ceux de l'Ancienne Rome, Paris, Académie des Sciences.
Bourdin, C., Douville, E., Genty, D., 2011. Alkaline-earth metal and rare-earth element incorporation control by ionic radius and growth rate on a stalagmite from the Chauvet Cave, Southeastern France. Chemical Geology, 290, 1–11.
Cheng, H., Adkins, J., Edwards, R.L., Boyle, E.A., 2000. U-Th dating of deep-sea corals. Geochimica et Cosmochimica Acta 64, 2401-2416.
Cowan, G.A., Adler, H.H., 1976. The variability of the natural abundance of 235U. Geochimica
et Cosmochimica Acta, 40, 1487-1490.
Douville, E., Sallé, E., Frank, N., Eisele, M., Pons-Branchu, E., Ayrault, S., 2010. Rapid and accurate U-Th dating of ancient carbonates using inductively coupled plasma-quadrupole mass spectrometry. Chemical Geology 272, 1-11.
Frisia, S., Borsato, A., Preto, N., McDermott, F., 2003. Late Holocene annual growth in three Alpine stalagmites records the influence of solar activity and the North Atlantic Oscillation on winter climate. Earth and Planetary Science Letters, 216, 411-424. Genty D., 1993. Mise en évidence d'alternances saisonnières dans la structure interne des
stalagmites. Intérêt pour la reconstitution des paléoenvironnements continentaux, C. R. Acad. Sci. Paris, t.317, série 2, pp. 1229-1236.
Gromet, L.P., Haskin, L.A., Korotev, R.L., Dymek, R.F., 1984. The “North American shale composite”: its compilation, major and trace element characteristics. Geochimica et Cosmochimica Acta 48 (12), 2469–2482.
Hatch, G., 2012, Dynamics in the global market for Rare Earths. Elements 8, 341-346.
Hellstrom, J., 2006. U–Th dating of speleothems with high initial 230Th using stratigraphical constraintt. Quaternary Geochronology, 1 (4), 289-295.
Hellstrom, J.C., McCulloch, M.T., 2000. Multi-proxy constraintts on the climatic significance of trace element records from a New Zealand speleothem. Earth and Planetary Science Letters 179 (2), 287–297.
Hirano, T., Morimoto, K., 1999. Growth reduction of the Japanese black pine corresponding to an air pollution episode. Environmental Pollution, Vol 106 (1), 5–12. http://dx.doi.org/10.1016/S0269-7491(99)00063-9.
Holser, W.T., 1997. Evaluation of the application of rare-earth elements to paleoceanography. Palaeogeography, Palaeoclimatology, Palaeoecology, 132, 309–323.
Hua, Q., McDonald, J., Redwood, D., Drysdale R., Lee, S., Fallon, S. Hellstrom, J., 2012. Robust chronological reconstruction for young speleothems using radiocarbon. Quaternary Geochronology, 14, 67-80.
Ku, T.L.,Li, H.C., 1998. Speleothems as high-resolution paleoenvironment archives: Records from northeastern China. Proceedings of the Indian Academy of Sciences 107 (4), 321-330.
Kulaksız, S., Bau, M., 2007. Contrasting behaviour of anthropogenic gadolinium and natural rare earth elements in estuaries and the gadolinium input into the North Sea. Earth and Planetary Science Letters, 260 (1–2), 361–371
Linge, H, Baker, A., Andersson, C., Lauritzen S-E., 2009. Variability in luminescent lamination and initial 230Th/232Th activity ratios in a late Holocene stalagmite from northern Norway. Quaternary Geochronology, 4 (3), 181–192.
Marchandise, S., Robin, E., Ayrault, S., Roy-Barman M., 2014. U-Th-REE-Hf bearing phases in Mediterranean Sea sediments: implications for isotope systematics in the ocean. Geochim. Cosmochim. Acta. 131, 47–61.
Nuhoglu, Y., 2006. A new approach to air pollution determination using annual rings: Dendro-chemical elemental analysis of annual rings by SEM-EDS. Polish Journal of Environmental Studies, 15 (1), 111-119.
Olmez, I, Sholkovitz, E.R., Hermann, D. Eganhouse, R.P., 1991. Rare-Earth Elements in sediments off southern California – a new anthropogenic indicator. Environmental Science & Technology, 25 (2), 310-316. DOI: 10.1021/es00014a015.
Perrette, Y., Delannoy, J.J., Desmet, M., Lignier ,V., Destombes J.L., 2005. Speleothem organic matter content imaging. The use of a Fluorescence Index to characterise the maximum emission wavelength. Chemical Geology, 214, 193-208.
Petelet-Giraud, E., Klaver, G., Negrel, P., 2009. Natural versus anthropogenic sources in the surface- and groundwater dissolved load of the Dommel river (Meuse basin): Constraintts by boron and strontium isotopes and gadolinium anomaly. Journal of Hydrology. 369, (3–4), 15, 336–349.
Pons-Branchu, E., Hillaire-Marcel, C., Ghaleb, B., Deschamps, P., Sinclair, D., 2005. Early diagenesis impact on precise U-series dating of Deep-Sea corals. Example of a 100-200 years old Lophelia Pertusa sample from NE Atlantic. Geochimica et Cosmochimica Acta, 69 (20), 4865-4879.
Pourret, O., Davranche, M., Gruau, G., Dia, A., 2008. New insights into cerium anomalies in organic rich alkaline waters. Chemical Geology, 251, 1-4,120-127.
Richter, D.K., Gotte, T. Niggemann, S., Wurth, G., 2004. REE3+ and Mn2+ activated cathodoluminescence in lateglacial and Holocene stalagmites of central Europe:
evidence for climatic processes? .The Holocene, (5), 759-767 DOI:
10.1191/0959683604hl754r
Quigley, M.C., Horton, T., Hellstrom, J.C., Cupper, M.L., Sandiford, M., 2010. Holocene climate variability in arid Australia from speleothem and alluvial records: The Holocene, v. 20, p. 1093–1104, doi: 10.1177/095968361036950
Saint-Laurent, D., Duplessis, P., Saint-Laurent, J., Lavoie, L., 2011. Reconstructing contamination events on riverbanks in southern Québec using dendrochronology and dendrochemical methods. Dendrochronologia, 29, (1), 31–40.
Schwarcz, H.P., Latham, A.G., 1984. Uranium-series age determination of travertines from the site of Vértesszöllös, Hungary. Journal of Archaeological Science, 11, (4), 327–336. Shen, C.C., Lin, K., Duan, W., Jiang, X., Partin, J.W., Edwards R.L., Cheng, H., Tan M.,
2013. Testing the annual nature of speleothem banding. Nature Science Report. Sep 16, 3:2633. doi: 10.1038/srep02633.
Shopov, Y.Y., Ford, D.C., Schwarz H.P., 1994. Luminescent microbanding in speleothems - high-resolution chronology and paleoclimate. Geology, 22: 407-410
Stravinskiene, V., Šimatonyte, A., 2008. Dendrochronological research of scots pine (Pinus Sylvestris L.) growing in vilnius and kaunas forest parks. Journal of Environmental Engineering and Landscape Management, 16 (2), 2008, 57-64. Doi: 10.3846/1648-6897.2008.16.57-64
Wassenburg, J.A., Immenhauser, A., Richter, D.K., Jochum, K.P., Fietzke, J., Deininger, M., Goos, M., Scholz, D., Sabaoui, A., 2012. Climate and cave control on Pleistocene/Holocene calcite-to-aragonite transitions in speleothems from Morocco: Elemental and isotopic evidence. Geochimica et Cosmochimica Acta, 92, 23–47
Wright, J., Schrader, H., Holser, WT., 1987. Paleoredox variations in ancient oceans recorded by rare earth elements in fossil apatite. Geochimica et Cosmochimica Acta, 51, (3), 631–644.
Zhou, H., Chi, B., Lawrence, M., Zhao, J., Yan, J., Greig, A., Feng, Y., 2008. High-resolution and precisely dated record of weathering and hydrological dynamics recorded by manganese and rare-earth elements in a stalagmite from Central China. Quaternary Research 69 (3), 438–446.
Zhou, H., Greig, A., Tang, J., Chen-Feng You, C.F., Yuan,, D., Tong, X., Huang, Y., 2012. Rare earth element patterns in a Chinese stalagmite controlled by sources and scavenging from karst groundwater. Geochimica et Cosmochimica Acta. 83, 15, 1–18.
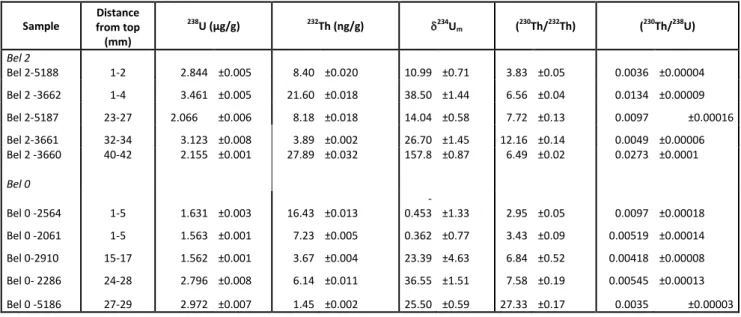
Table 1: U-Th data measured for Bel 0 and Bel 2 speleothems. 234U =
({234U/238U}measured/{ 234 U/238U}equilibrium - 1) × 1000 with 234 U/238Uequilibrium = 54.89×10 -6 (molar ratio) Sample Distance from top (mm) 238U (µg/g) 232Th (ng/g) 234U m (230Th/232Th) (230Th/238U) Bel 2 Bel 2-5188 1-2 2.844 ±0.005 8.40 ±0.020 10.99 ±0.71 3.83 ±0.05 0.0036 ±0.00004 Bel 2 -3662 1-4 3.461 ±0.005 21.60 ±0.018 38.50 ±1.44 6.56 ±0.04 0.0134 ±0.00009 Bel 2-5187 23-27 2.066 ±0.006 8.18 ±0.018 14.04 ±0.58 7.72 ±0.13 0.0097 ±0.00016 Bel 2-3661 32-34 3.123 ±0.008 3.89 ±0.002 26.70 ±1.45 12.16 ±0.14 0.0049 ±0.00006 Bel 2 -3660 Bel 0 40-42 2.155 ±0.001 27.89 ±0.032 157.8 ±0.87 6.49 ±0.02 0.0273 ±0.0001 Bel 0 -2564 1-5 1.631 ±0.003 16.43 ±0.013 -0.453 ±1.33 2.95 ±0.05 0.0097 ±0.00018 Bel 0 -2061 1-5 1.563 ±0.001 7.23 ±0.005 0.362 ±0.77 3.43 ±0.09 0.00519 ±0.00014 Bel 0-2910 15-17 1.562 ±0.001 3.67 ±0.004 23.39 ±4.63 6.84 ±0.52 0.00418 ±0.00008 Bel 0- 2286 24-28 2.796 ±0.008 6.14 ±0.011 36.55 ±1.51 7.58 ±0.19 0.00545 ±0.00013 Bel 0 -5186 27-29 2.972 ±0.007 1.45 ±0.002 25.50 ±0.59 27.33 ±0.17 0.0035 ±0.00003
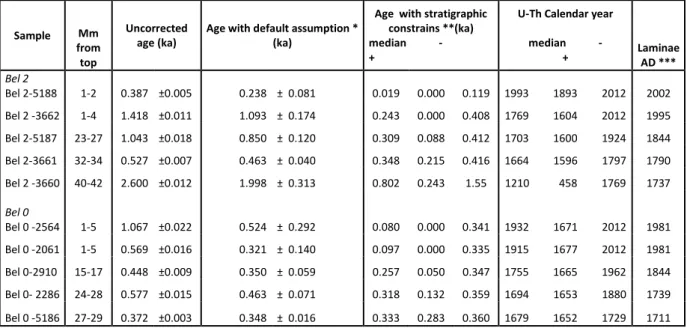
Sample Mm from top
Uncorrected age (ka)
Age with default assumption * (ka)
Age with stratigraphic constrains **(ka) median - +
U-Th Calendar year median - + Laminae AD *** Bel 2 Bel 2-5188 1-2 0.387 ±0.005 0.238 ± 0.081 0.019 0.000 0.119 1993 1893 2012 2002 Bel 2 -3662 1-4 1.418 ±0.011 1.093 ± 0.174 0.243 0.000 0.408 1769 1604 2012 1995 Bel 2-5187 23-27 1.043 ±0.018 0.850 ± 0.120 0.309 0.088 0.412 1703 1600 1924 1844 Bel 2-3661 32-34 0.527 ±0.007 0.463 ± 0.040 0.348 0.215 0.416 1664 1596 1797 1790 Bel 2 -3660 40-42 2.600 ±0.012 1.998 ± 0.313 0.802 0.243 1.55 1210 458 1769 1737 Bel 0 Bel 0 -2564 1-5 1.067 ±0.022 0.524 ± 0.292 0.080 0.000 0.341 1932 1671 2012 1981 Bel 0 -2061 1-5 0.569 ±0.016 0.321 ± 0.140 0.097 0.000 0.335 1915 1677 2012 1981 Bel 0-2910 15-17 0.448 ±0.009 0.350 ± 0.059 0.257 0.050 0.347 1755 1665 1962 1844 Bel 0- 2286 24-28 0.577 ±0.015 0.463 ± 0.071 0.318 0.132 0.359 1694 1653 1880 1739 Bel 0 -5186 27-29 0.372 ±0.003 0.348 ± 0.016 0.333 0.283 0.360 1679 1652 1729 1711
Table 2: U-Th ages for Bel 0 and Bel 2 speleothems. The ages are expressed as ka before 2012 or in calendar years (AD). *Ages are corrected using a (230Th/232Th) initial activity ratio of 1.5 ± 0.75; **Ages are corrected using (230Th/232Th) activity ratio determined by
stratigraphic constrains: (230Th/232Th)A0 = 2.9 (+1.5/-1) for Bel 0 and (230Th/232Th)A0 = 4.6
(+0.9/-1) for Bel 2. ***: the error associated with laminae counting age is ± 15 a yr.
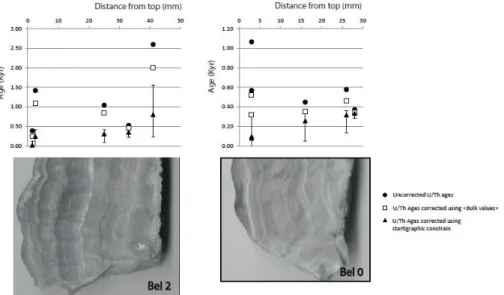
Figure 2: Polished sections of the two speleothem samples, with corrected U-Th ages using “Bulk Earth values” and U-Th ages using stratigraphic constrain to estimate (230
Th/232Th)A0 of
the detrital phase (a); detail (thin section photography) of Bel 0 sample (b).
Figure 3: REE + Y concentrations in Bel 0 and Bel 2 speleothems (based on laminae counting, with errors ±15 a).
Figure 4: REE patterns normalized to NASC in (a) Bel 0 and (b) Bel 2 speleothems from Belleville Aqueduct, Paris.
Figure 5: Absolute ages (corrected U-Th ages, triangles) and relative ages (laminae counting) for Bel 0 (open square) and Bel 2 (black circles) speleothems from Belleville Aqueduct, Paris. Figure 6: REE history in Bel 0 and Bel 2 speleothems from Belleville Aqueduct, Paris. a) Ce anomaly. b) REE/LREE ratio (here Prn/Ybn).
Figure 7: Total REE concentration versus Y concentration in Bel 0 and Bel 2 speleothems from Belleville Aqueduct, Paris.