HAL Id: tel-00586677
https://tel.archives-ouvertes.fr/tel-00586677
Submitted on 18 Apr 2011HAL is a multi-disciplinary open access archive for the deposit and dissemination of sci-entific research documents, whether they are pub-lished or not. The documents may come from teaching and research institutions in France or abroad, or from public or private research centers.
L’archive ouverte pluridisciplinaire HAL, est destinée au dépôt et à la diffusion de documents scientifiques de niveau recherche, publiés ou non, émanant des établissements d’enseignement et de recherche français ou étrangers, des laboratoires publics ou privés.
Guillaume Ereteo
To cite this version:
Guillaume Ereteo. Analyse sémantique des réseaux sociaux. Autre [cs.OH]. Telecom ParisTech, 2011. Français. �tel-00586677�
Semantic Social Network
Analysis
Ph.D. thesis
Defended on the 11
thof April 2011 by Guillaume Erétéo
Jury:
•
President : Fabrice Rossi (Telecom ParisTech)
•
Reporters : Marie-Aude Aufaure (Ecole Centrale Paris)
Pascale Kuntz (University of Nantes)
•
Directors : Michel Buffa (I3S, University of Nice - Sophia Antipolis)
Fabien Gandon (INRIA Sophia Antipolis)
•
Invited:
Patrick Grohan (Orange Labs - Sophia Antipolis)
Orange Labs
Telecom ParisTech
"I hope that while so many people are out smelling the flowers, someone is taking the time to plant some."
Remerciements/Thanks
• A Audrey, Mylène, Maman, et Papa, pour votre amour qui me permet de rêver, de créer et d’avancer chaque jour.
• A Michel Buffa et Fabien Gandon, mes directeurs de thèse et amis, pour tout ce que vous m’avez appris et d’inoubliables moments de bonne humeur.
• A Olivier Corby pour tes indispensables contributions à mes travaux et tes précieux enseignements.
• A Alain Giboin pour nos fructueuses et intéressantes discussions.
• A toutes les personnes avec qui j’ai collaboré au sein du projet ISICIL et des équipes ACACIA, EDELWEISS, KEWI et PUPE d’Orange Labs.
Abstract
The outburst of social functionalities in web-based applications has fostered the deployment of a social media landscape where people freely contribute, gather and interact with each other. The integration of various means for publishing and socializing allows us to quickly share, recommend and propagate information to our social network, trigger reactions, and finally enrich it. These shared spaces fostered the creation and development of interest communities that publish, filter and organize directories of references in their domains at an impressive scale with very agile responses to changes.
In order to reproduce the information sharing success story of the web, more and more social platforms are deployed into corporate intranets. However, the benefit of these platforms is often hindered when the social network becomes so large that relevant information is frequently lost in an overwhelming flow of activity notifications. Organizing this huge amount of information is one of the major challenges of Web 2.0 to achieve the full potential of Enterprise 2.0, i.e., the efficient use of Web 2.0 technologies like blogs and wikis within the Intranet.
This thesis proposes to help analyzing the characteristics of the heterogeneous social networks that emerge from the use of web-based social applications, with an original contribution that leverages Social Network Analysis with Semantic Web frameworks. Social Network Analysis (SNA) proposes graph algorithms to characterize the structure of a social network and its strategic positions. Semantic Web frameworks allow representing and exchanging knowledge across web applications with a rich typed graph model (RDF), a query language (SPARQL) and schema definition frameworks (RDFS and OWL). In this thesis, we merge both models in order to go beyond the mining of the flat link structure of social graphs by integrating a semantic processing of the network typing and the emerging knowledge of online activities. In particular we investigate how (1) to bring online social data to ontology-based representations, (2) to conduct a social network analysis that takes advantage of the rich semantics of such representations, and (3) to semantically detect and label communities of online social networks and social tagging activities.
Résumé
L’explosion des fonctionnalités sociales au sein des applications du Web a favorisé le déploiement d'un panorama de médias sociaux permettant aux utilisateurs de librement contribuer, de se regrouper et d’interagir entre eux. La combinaison de divers moyens de publication et de socialisation permet de rapidement partager, recommander et propager l'information dans son réseau social, ainsi que de solliciter des réactions et de nouvelles contributions. Ces espaces partagés ont favorisé la création et le développement de communautés d'intérêts qui publient, filtrent et organisent de vastes répertoires de références dans leurs domaines, avec une impressionnante réactivité aux changements.
Afin de reproduire les succès du Web dans la gestion d'information, de plus en plus de plates-formes sociales sont déployées dans des intranets d'entreprise. Cependant, l'avantage de ces plates-formes est fortement atténué lorsque le réseau social devient si grand que les informations pertinentes sont noyées dans des flux continus de notifications. Organiser cette énorme quantité d'informations est l'un des défis majeurs du Web 2.0 afin de tirer pleinement partie des bénéfices de l'Entreprise 2.0, à savoir, l'utilisation des technologies du Web 2.0, tel que les blogs et les wikis, dans un intranet. Cette thèse propose d’améliorer l’analyse des réseaux sociaux multiples et variés émergeant des usages sociaux du Web, au travers d’une contribution originale qui enrichit l’analyse des réseaux sociaux avec les technologies du Web Sémantique. L’analyse des réseaux sociaux propose des algorithmes de graphes pour caractériser la structure d'un réseau social et ses positions stratégiques. Les technologies du Web Sémantique permettent de représenter et d’échanger les connaissances entre des applications distribuées sur le Web avec un modèle de graphes richement typés (RDF), un langage de requête (SPARQL) et des langages de description de modèles (RDFS et OWL). Dans cette thèse, nous fusionnons ces deux modèles afin d'aller au-delà de l’analyse structurelle des graphes sociaux en intégrant un traitement sémantique de leur typage et des connaissances qu’ils contiennent. En particulier nous examinons comment (1) modéliser des données sociales en ligne à base d’ontologies, (2) réaliser une analyse du réseau social qui tire partie de la sémantique de ces représentations, et (3) détecter et étiqueter explicitement des communautés à partir de réseaux sociaux et de folksonomies.
Sommaire
1. INTRODUCTION ... 1
2. MOTIVATING SCENARIO ... 5
2.1 ENTERPRISE 2.0 ... 6
2.2 ISICIL:INFORMATION SEMANTIC INTEGRATION THROUGH COMMUNITIES OF INTELLIGENCE ONLINE ... 8
2.3 SEMANTIC ANALYSIS OF SOCIAL NETWORKS ... 11
3. STATE OF THE ART ON SOCIAL NETWORK ANALYSIS AND ITS APPLICATION ON THE WEB ... 14
3.1 CAPTURE,DETECT AND REPRESENT SOCIAL NETWORKS ... 15
3.1.1 Explicit Relationship Networks ... 15
3.1.2 Interaction Networks ... 17
3.1.3 Affiliation Networks... 18
3.1.4 Social Network Representation ... 20
3.1.4.1 Definitions ... 20
3.1.4.2 Notations ... 21
3.1.4.3 Using Different Types of Graphs ... 21
3.1.4.4 Representing Graphs With Matrices ... 22
3.2 SOCIAL NETWORK ANALYSIS ... 25
3.2.1 Strategic Position and Important Actors ... 25
3.2.2 Global Metrics and Network Structure ... 28
3.2.3 Community Detection Algorithms ... 33
3.2.3.2 Heuristic Based Algorithms ... 36
3.2.3.3 Evaluating a Community Partition ... 38
3.2.3.4 Partial Conclusion ... 39
3.2.4 Algorithms for Computing Centralities ... 39
3.2.4.1 Formulas and Principles ... 39
3.2.4.2 Algorithms for Computing the Betweenness Centrality ... 41
3.2.5 Datasets ... 44
3.2.6 Partial Conclusion ... 45
3.3 SOCIAL DATA ON THE WEB ... 46
3.3.1 Social Network Analysis and Online Social Data ... 47
3.3.1.1 Web mining ... 47
3.3.1.2 Synchronous and Asynchronous Discussions ... 48
3.3.1.3 Web 2.0 ... 49
3.3.2 Social Network Analysis: the Need for Semantics ... 54
4. SEMANTIC SOCIAL NETWORK REPRESENTATION ... 59
4.1 FROM DATA SILOS TO A GLOBAL SEMANTIC SOCIAL GRAPH ... 60
4.1.1 RDF: a Standard Resource Description Framework ... 61
4.1.2 Ontologies and Resource Description Framework Schema ... 64
4.1.3 An Ontology Web Language for Richer Reasoning on Data ... 66
4.1.4 SPARQL: Protocol and RDF Query Language for Querying and Accessing Data ... 67
4.1.5 Linked Data on the Web ... 71
4.2 LINKING AND ENRICHING SOCIAL DATA WITH SEMANTICS ... 72
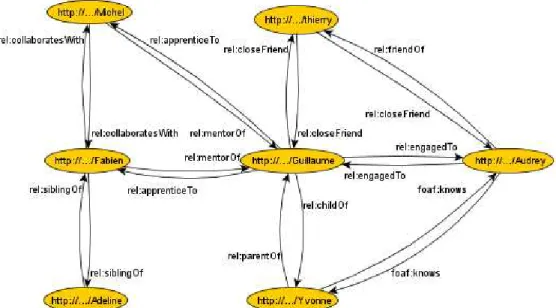
4.2.1 Representing and Querying Profiles ... 73
4.2.2 Representing Social Links and Networks ... 74
4.2.3 Representing and Linking User Accounts and Generated Content ... 77
4.2.4 Organizing and Structuring User Generated Content ... 80
4.2.5 Analysis of Semantic Social Network Representation ... 82
4.3 CONCLUSION ... 83
5. ANALYSIS OF SEMANTIC REPRESENTATION OF SOCIAL NETWORKS ... 85
5.1 ASEMANTIC WEB FRAMEWORK FOR SOCIAL NETWORK ANALYSIS ... 86
5.1.1 Wrapping Social Data with CORESE ... 88
5.1.1.1 Querying XML and Relational Databases with CORESE ... 88
5.1.1.2 Rules and Enrichment of RDF Social Network ... 89
5.1.2 Extract SNA Concepts with SPARQL ... 91
5.1.2.1 Exploit Rich Typing of Relationships ... 91
5.1.2.2 Extract Complex Relationships with Property Paths ... 92
5.1.2.3 Global Querying and Aggregating Operators ... 94
5.1.2.4 SPARQL Operationalization of Parameterized SNA Metrics ... 95
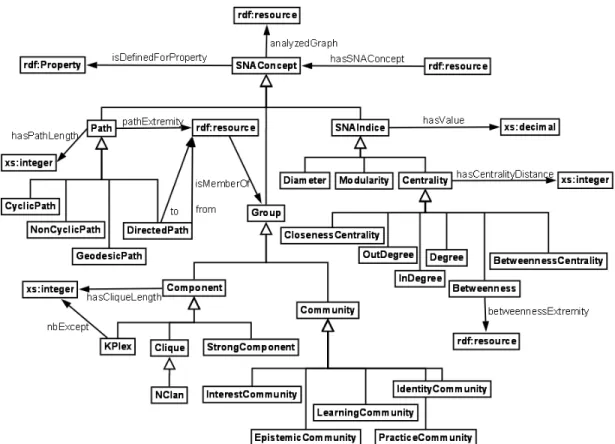
5.1.3 SemSNA: the Ontology of Social Network Analysis ... 100
5.1.3.1 SemSNA core ... 101
5.1.3.2 Strategic Positions ... 102
5.2 EXPERIMENT AND RESULTS ... 105
5.2.1 Representing and Leveraging Ipernity Relational Data with Semantics ... 105
5.2.2 Results ... 107
5.3 PARTIAL CONCLUSION... 111
6. SEMLP: WHEN SEMANTICS IMPROVE COMMUNITY DETECTION IN FOLKSONOMIES... 113
6.1 COMMUNITY DETECTION BY LABEL PROPAGATION AND FOLKSONOMIES ... 114
6.2 SEMTAGP:SEMANTIC TAG PROPAGATION IN NETWORKS ... 115
6.2.1 Semantic Tags Assignment and Folksonomy Enrichment ... 118
6.2.2 Semantic Tag Propagation ... 119
6.2.3 Computing the Modularity of an RDF Graph ... 120
6.3 EXPERIMENTS AND RESULTS ... 121
6.3.1 Dataset ... 122
6.3.2 Experiment ... 123
6.4 DISCUSSION ... 154
6.5 PARTIAL CONCLUSION... 155
7. PERSPECTIVES AND APPLICATIONS ... 156
7.1 TEMPORAL SOCIAL NETWORK ... 157
7.1.1 Temporal Semantic Network Model ... 157
7.1.2 Analysis of Temporal Semantic Social Network ... 158
7.2 LARGE SCALE NETWORK ANALYSIS ... 158
7.2.1 Iterative, Parallelizable or Distributed Algorithms ... 159
7.2.2 Approximation and Heuristics ... 159
7.3 FUNCTIONALITIES AND APPLICATIONS ... 160
7.3.1 Detecting and Highlighting Strategic Relationships ... 161
7.3.2 Managing Relationships and Strengthening Networking Positions ... 162
7.3.3 Accessible, Mobilized and Potential Social Capital ... 162
8. CONCLUSION ... 164
8.1 CONTRIBUTIONS ... 164
8.1.1 Leveraging Online Social Data to Ontology-based Representations ... 164
8.1.2 Extending Social Network Analysis to Ontology-based Representations ... 165
8.1.3 Semantic Community Detection and Labelling ... 166
8.2 PUBLICATIONS ... 166
9. REFERENCES ... 168
10. TABLE OF FIGURES ... 178
1.
Introduction
« The web is more a social creation than a technical one. » Tim Berners-Lee “Social Web” sounds like a pleonasm: user interactions and social networks are among the cornerstones of the Web. Human participation and freeform contributions are at the core of most popular web sites, creating shared spaces where people can freely gather, interact, and explicitly connect. From these usages, online communities of interests spontaneously emerge with roles and life cycles that are inherent in their members’ interactions and involvements. Guided by common interests and goals, these communities publish, filter and organize directories of references in their domains at an impressive scale with very agile responses to changes. Now, we have access to an ever-growing long tail of information and knowledge.
The main problem is no more to collect and publish resources but mainly to structure and mash them in a way that matters to people and to their communities. Consequently, intelligent agents are crawling web resources, mining and indexing them in order to provide added-value services and extended information to web users. Interested by the audience driven through such activities, content providers make explicit and available their public data through the form of API or mark-ups in their pages. The activity of these agents is made easier and easier by the growing adoption of Semantic Web technologies to capture, publish and access data with standard machine-readable formats and protocols. In particular, we are witnessing the outburst of standard semantic mark-ups inside HTML pages, thanks to their consideration by biggest web actors (e.g. Google, Facebook, Yahoo). This exponential growth of readily available semantic data foster the deployment of more and more intelligent software that consume these linked
and structured data to personalize, enrich and multiply user experiences (e.g. web augmented reality).
Intranets of organizations are progressively reproducing various web evolutions and web based social applications are progressively deployed inside companies. For instance, Wikis are used to foster collaborative editions and knowledge capture, and social networking services to increase and ease sharing between employees. Intranet users are now able to partially adapt the flow of information inside the company to their daily tasks and evolving needs. However, social web applications inside intranets are more often disconnected, and corporate information is still more structured according to the organization chart rather than to how people use it. Beyond the reluctance related to emerging and auto-organized information, data that are produced by these applications lack the semantics and interoperability to be mashed and integrated in the intranet structure. The adoption of Semantic Web technologies could greatly benefit such social intranet by turning its information into structured data and connect it. Once semantically revealed, structured and connected, social data can in turn be exploited to develop functionalities that will structure information according to the need and the use of intranet users.
In previous researches on semantic wikis [Buffa et al 2008a], we investigated how the integration of Semantic Web technologies in a wiki could enhance the experience of its users and help a community build and structure a shared vocabulary. On one hand, we used Semantic Web technologies to manipulate the inner structure of the wiki by typing its different elements with the concepts from a “wiki ontology” (“document”, “page”, “tag”, “link”, “backward link”); thus, we were able to reason on this structure, enrich it, and interoperate with others wikis. On the other hand, SweetWiki enabled its users to annotate pages with their own vocabulary that they can freely modify and restructure, through a user friendly interface (e.g. add/merge/remove concepts or declare hierarchical links). This synergy between automatically generated metadata and human contributions offers a rich structuring and interoperability of the wiki data while answering the specificities and evolving needs of the user community.
Several researches have been conducted to develop this social semantic perspective of web based applications, and we now dispose of standards to capture, to represent and to interlink socially produced and structured metadata. However, this important step toward applications that easily collect, mash and publish data, puts users and companies in front of a huge amount of social signals that need to be filtered and organized to avoid hindering their initial benefits. In particular, socially issued metadata embed an emergent structure that is inherent in user relations, interactions, and affiliations. Revealing this social structure would enable its exploitation to help filtering and organizing this huge amount of data.
This thesis investigates methods for identifying the social structure emerging from the semantic representation of online social activities. Building on top of Semantic Web technologies and classical graph theory, we propose a novel approach to take benefits of both models and conduct a semantic social network analysis. We will see how to
semantically represent, link and access online social networks, how to enable classical operators of social network analysis to consider the semantics of these networks, and how these semantics could be exploited to enhance community detection.
These researches were part of the ISICIL1 project within the PUPE team of Orange2 Labs, the Edelweiss3 team of INRIA - Sophia Antipolis4 and the Kewi team from the I3S Laboratory of the University of Nice. The ISICIL project proposes to study and to experiment the usage of Web 2.0 tools enhanced by Semantic Web technologies to assist corporate intelligence tasks. The PUPE team investigates prospective business services. The research team Edelweiss aims at offering models, methods and techniques for supporting knowledge management and collaboration in virtual communities interacting with information resources through the Web, , and collaborates a lot with the Kewi research team on these thematics.
This thesis is organized as follow:
Chapter 2 presents the scenario that motivated the realization of this thesis and the ISICIL project. The deployment of social web applications in corporate intranets promises to conduct innovative intelligence tasks, taking great benefits of a smart exploitation of the social signals emerging from free online contributions. However, in order to deal with the reactivity challenge of business intelligence, the numerous signals produced by Web 2.0 applications have to be structured and filtered.
Chapter 3 reviews the literature and definitions of the basic notions related to social network analysis and online social networks. We present the traditional methods used to capture and represent social networks, the different metrics and algorithms of social network analysis, and their application to online social networks. Chapter 4 presents how Semantic Web technologies enable us to structure, link and exchange social networking data across web sites. Semantic web technologies provide a whole stack of languages and protocols to describe resources, to define vocabularies, to query and access such representations. In particular, many vocabularies have been designed to represent persons, relationships and web based activities.
Chapter 5 presents the conceptual stack we designed to conduct a semantic social network analysis. We extend social network analysis operators using Semantic Web frameworks to include the semantics used to structure social links, and we propose a model to enrich social data with the results of the analysis.
Chapter 6 proposes a semantic algorithm, SemTagP, to label and detect communities. This algorithm not only offers to detect but also to label communities, taking benefits of the tags used by people to classify web resources as well as the
1
Information Semantic Integration through Communities of Intelligence online, http://isicil.inria.fr 2
http://www.orange.com
3
http://www-sop.inria.fr/edelweiss/ 4
semantic relations that can be inferred between tags. Doing so, we are able to refine the partitioning of the social graph with semantic processing and to label the activity of detected communities.
Chapter 7 discusses some important issues and perspectives that I would like to address in future works. In particular, we discuss the importance of considering temporal data in social network analysis, we raise the time and space complexity of our approach for scaling to very large networks, and we propose some elements to turn the result of a semantic analysis into functionalities.
This thesis is organized in order to progress from the initial scenario and problems that motivated these researches to the final technical solutions that advance its resolution. Chapter 2 and 3 define the general context of and the positioning of this thesis in respect with existing literature. Chapter 4 presents and argues the technological choices in which we ground our solution. Chapter 5 and 6 describe the contributions of this thesis and the experiments that were conducted to assess and evaluate the presented solutions. Finally, Chapter 7 presents perspectives that I consider as important evolutions of this thesis and that I would like to address in further researches.
2.
Motivating Scenario
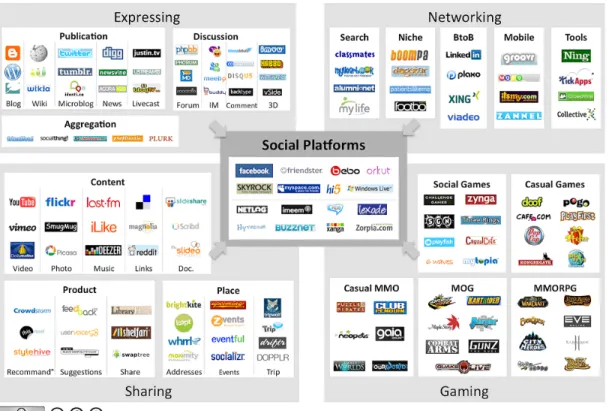
« The intranet tends to follow trends from the web and social Networking is no exception » Nielsen Norman Group Since web users are core elements of most online applications, emergent contributions and free interactions form the main content of the web. People express themselves online, connect to exchange and to stay in touch, spontaneously gather and interact on similar interests. The outburst of social applications on the web produced a dramatic shift in information sharing and content production. These applications turned the privileged professional activities of producing, publishing and distributing content into massive amateur activities, enabling anybody to contribute. Massive and free contributions on the web have made information produced, shared, and accessible at an impressive scale and speed. The freeform of these applications enabled the development of financially non profitable activities that were forsaken by professionals. For instance, authoring tools like blogs enable the creation of a long tail of numerous precious source of information to the attention of small communities, so small that they were not targeted by professional editors. Moreover, in their online publications, authors refer to other documents (produced either by themselves or by others) by the means of hyperlinks, which implicate them in the evolution of the inner structure and in the organization of the web. Users are even more involved in this organization as most of online applications, like blogs, Flickr and Youtube, introduce explicitly their users in the classification of content with freely chosen labels, named tags. Consequently, the huge amount of online content is now organized and filtered by the mass of people. As a side effect of this collaborative classification, users of these applications are able to spontaneously and massively gather on shared interests at an unexpected large scale just by using the same tags. In addition, users of these applications are provided with
advanced functionalities for connecting, interacting, and gathering. Due to the massive adoption of these practices, "online communities of interest have emerged and started to build directories of references in their domains of interest at an impressive speed and with very agile responses to changes in these domains" [Gandon et al 2009]. These communities can freely emerge and evolve to very large scales, for any purposes and in every domain.
Introducing such reactivity in the complex business processes and organizational chart of companies is an appealing opportunity to tackle the growing diversity of market and technological signals produced both internally and externally. Moreover, the generational turn over speaks up for challenging the acceptance of a corporate use of web 2.0 applications. In 2015, the generation Y, used to social medias in their daily personal activities, will represent 15% of the European population and 40% of workers in France5. This generation will ease and probably argue for the adoption of social medias in enterprises both for internal collaboration, public relationships and market insight.
In the first section of this chapter, we will discuss the benefits and the issues of introducing Web 2.0 applications inside companies, namely the enterprise 2.0. In the second section we focus on the ISICIL project in which we investigate the application of enterprise 2.0 to business intelligence. Finally, we discuss the need of understanding emergent social structures and the lack of tools to reach such goal.
2.1
Enterprise 2.0
More and more social solutions (e.g. Socialtext6) are being deployed in corporate intranets to reproduce inside corporations the information sharing success stories from the open web. This new trend is often called Enterprise 2.0, which is defined by [McAfee 2009] as follow:
Definition 1. Enterprise 2.0: the use of emergent social software platforms within companies, or between companies and their partners or customers. Definition 2. Emergent social software platforms: digital environments in
which contributions and interactions are (1) globally visible and persistent over time, (2) performed with social softwares that enable people to gather, connect or collaborate through computer-mediated communication and to form online communities (3) emergent, freeform, with patterns and structure inherent in people’s interactions.
Introducing such platforms inside an organization can provide different benefits for managing information and enhancing collaboration by enabling employees to:
• easily share and publish the content and knowledge they discover or produce.
5
http://fr.wikipedia.org/wiki/Génération_Y 6
• collaboratively filter and organize both internal and external documents and sources.
• spontaneously connect and gather on related working topics and objectives.
• easily search and find information, documents and experts
In order to achieve these benefits, [McAfee 2009] introduces the SLATES acronym that defines the features that should provide emergent social softwares:
• Search for enabling employees to find information.
• Links for strengthening the connectedness of information and fostering the discovery of new sources.
• Authoring for providing employees with an easy and non technical way of publishing information.
• Tags for enabling people to easily organize content with freely chosen labels, and enable a large scale and human classification.
• Extensions for automatically proposing the discovery of new content suggested by pattern matching algorithms.
• Signals for enabling web users to subscribe to targeted sources and topics, and to be automatically notified of new publications.
However, while the freeform of these platforms enables to collectively handle "the diversity and the mass of information sources" [Gandon et al 2009], it is also their main problem for their acceptance in a corporate context. Firstly, companies have been working for decades at limiting the number of collaborators and actions each one of their employees has to handle for optimizing individual performances. Companies are driven by well defined business processes and formal structures while emergent social software platforms are characterized by free activities and freely evolving social structures. It is one of the main reasons of the reluctance of many companies to introduce social solutions in their business practices. Secondly, some companies face strong information security and confidentiality restrictions and cannot even accept unexpected practices and interactions in their processes. Finally, some decision makers simply fear their employees will loose time and efficiency in sharing and consuming non controlled and unsupervised information. Consequently, social web applications cannot just be deployed in companies' intranets without being fully integrated in their formal organizations and their business processes. Many challenges have to be tackled to fully achieve the objectives promised by the advocate of the enterprise 2.0. All the corporate reluctances that are cited above highlight common expectations for using these tools: a better effectiveness, supervision and control of the flow of data and information.
2.2
ISICIL:
Information
Semantic
Integration
through
Communities of Intelligence onLine
In the ISICIL project, we investigate the application of enterprise 2.0 to business intelligence, with a framework that takes advantage of collaborative platforms to allow conducting innovative strategic watch. The goal is to introduce social interactions into every step of the intelligence cycle: searching, monitoring, collecting, handling, disseminating. Information produced by different sources becomes socially connected, can be quickly shared and permanently enriched with comments, tags and new related sources. Figure 1 shows how emergent social softwares are integrated in every steps of the business intelligence cycle. People are not only connecting together, they connect themselves to documents, data and information:
• Searching is no more a lonely task consisting in looking for relevant information and sources; we now collectively search information in document but also through people and expert that become one of the main sources of information. Even more, searching is sometime unnecessary, information is simply propagated to people by people.
• Monitoring is not only about monitoring document sources but about listening to human sensors, namely collaborators and expert activities.
• Collecting consists in selecting and organizing the information, a task supported by a collaborative pre-treatment of the social network which proposes its insight on sources and information, and organizes it, in particular through the means of social tagging.
• Analysing consists in synthesizing the collected information to detect and highlight weak signals, tendencies and prospective deductions. This step is crucial to support decision making and is once again preciously leveraged by the insight of the crowd and the benefit of collaboration.
• Disseminating is greatly favoured by social networks and online social applications: information and documents are better connected and are de facto easier to find while their propagation is empowered by people that are better interconnected, whatever their locations and affiliations are.
Figure 1. Business intelligence 2.0.
While this socialization of business intelligence leverages the information management and increases the cooperation, it also augments the amount of information employees are exposed to. The benefit of collaborative tools is often hindered when the social network becomes so large that relevant information is lost in an overwhelming flow of notifications. Users are facing huge objects, evolving all the time with a growing amount of information that exceeds their attention span, which is unacceptable in organizations. Moreover, it complicates the management of confidentiality and security of strategic information. Organizing this huge quantity of information is necessary for achieving the full potential of Enterprise 2.0. (1) We need to link and organize the huge amount of shared and produced data. (2) We need to reconcile the free activity of web 2.0 applications with formal processes of companies. (3) We need to reconcile spontaneous relationships and community structure that emerge through online collaboration with formal organizational charts.
In the ISICIL project, we propose to tackle these issues with a multidisciplinary approach [Gandon et al 2009] to deal with:
• the sociological and usability challenges for reconciling web 2.0 approaches with organizational charts and processes.
• the technological challenges of capturing, representing and processing the diversity of decentralized data emerging from the use of different online social applications.
We focus here on the technological issues, which are tackled with Semantic Web technologies by offering data interoperability between applications and for leveraging information processing. We need to deal with heterogeneous data (involving actors, content and relationships) that are generated and spread across the internet and intranet
networks on different sites. Semantic web technologies answer this problem with standard languages and protocols for
• describing and exchanging resources and data across applications on a network with a uniform structure.
• representing and linking the models and the domain vocabularies used to define the semantics of these descriptions.
• querying and accessing distant data describing both resources and models. These technological advances enable us to handle the indexing and the processing of the data that are produced by the decentralized and disconnected web applications. First, interoperability between applications and the exchange of data is enhanced by the use of standard languages and protocols for describing, querying and accessing data on networks. Then processing and handling the semantics and the models use to structure exchanged data is consequently eased with the standardization and the linkage of their representation.
[Passant et al 2009] argue that a Semantic Web layer on top of an enterprise 2.0 information system enable to deal with "information fragmentation and heterogeneity of data formats", "knowledge integration and re-use", and "tagging and information retrieval". Once structured and represented in a uniform way, social data can be mined and leveraged to meet enterprise requirements for (1) linking information, (2) detecting and structuring emergent process, and (3) providing insight into and from spontaneous communities and emergent collaborative structures.
The Figure 2 describes how a business intelligence conducted with emergent social software platforms can be enhanced by a semantic layer on top of all these applications:
• Searching is enhanced and better assisted with a global and more relevant search across applications, thanks to the explicit semantic of the nature, the context and the meaning of data.
• Monitoring is enhanced by a semantic based filtering and structuring of data, and augmented with related information by a semantic processing of data links.
• Collecting is assisted by suggestions of concepts for classifying content, based on the semantic inferred from emerging vocabulary. Moreover, when collecting and classifying content, users become implicated (both implicitly and explicitly) in the structuring process of their company's vocabulary.
• Anlysing will benefits of semantic perspectives on collected data and of social signals, which will enable advanced interactions and smart filtering.
• Disseminating will be supported in the targeting of relevant communities for sharing produced content, while the members of these communities will be notified of the creation of content that is relevant to their interests.
Figure 2. Business intelligence 2.0 enhanced by a semantic layer.
In order to achieve such an evolution of the business intelligence cycle we not only need to support web 2.0 approaches with Semantic Web technologies but also to tackle two important scientific challenges:
• Integrating the light classifications of resources performed by web 2.0 users with freely chosen labels and formal ontologies to get the best of both worlds. In other words the goal is to classify resources with an evolving vocabulary that is both structured and representative of users' knowledge perception.
• Reifying and exploiting the dynamic and rich social networks that are embedded in the emerging social data of web 2.0 applications, in order to foster interactions and collaborations, to help user positioning in these networks and filtering overwhelming social notifications.
While the first issue is tackled by Freddy Limpens in its Ph.D. thesis [Limpens 2010], we focus here on the analysis of the semantic representation of web 2.0 social networks.
2.3
Semantic Analysis of Social Networks
The social data that emerge in online social applications embed rich social links, between their users, that have to be revealed and reified in order to be mined and exploited. In particular, these applications enable their users to connect, interact and develop interest affiliations between each other, which enable us to build and mine the resulting social networks. However the structures of these social networks are complex to represent, due to the multiplicity of context, roles and identities, and to their distribution across applications. Each user of an application represents a person, in a particular role and a given context that constitute a fragment of its identity. Consequently, a person develops different social links, across several applications,
which are contextualized by the different fragments of its identity. An effective mining of the resulting global social network should consider such specificities and require thus an adequate representation.
In the previous section we argued that Semantic Web technologies answer the problematic of exchanging, mashing and querying data across applications. Based on these technologies, we need to reuse existing models and develop new ones, if necessary, to smartly represent people, user profiles and their different social links for revealing the online social networks they form. Once represented in a uniform structure, these social networks can then be mined for extracting the metrics that will be used for managing social data.
Social Network Analysis is particularly well suited for understanding and determining the global structure of a social network, the distribution of actors and activities, and the strategic positions and actors. The result of the network analysis can be exploited for leveraging the social experience of collaborative tools. On one hand, we can better organize and filter social data in every step of the business intelligence process. During the searching, monitoring, collecting and handling steps, the presentation of social data to the users should consider the insight of a network analysis as well for classification purposes as for information quality indicators. During the disseminating step, the network analysis metrics will help propagating the produced information toward the relevant part of the network and connect it to the targeted communities. On the other hand, the analysis can be used for strengthening the network structure in order to increase its efficiency, both locally and globally. At a local scale, the analysis can be used to assist applications' users in maintaining their relationships and developing relevant new ones that could best serve their efficiency. At a global scale the analysis could be used to stimulate new connections that would empower the whole network efficiency, such as bridging disconnected communities that would benefit from collaborating
However, social network analysis' algorithms are only based on the linking structure of the network and do not exploit the semantics that are embedded in such typed representations from which they could highly benefit. The richness and the specificities of online social networks offer many perspectives for conducting more accurate analyses. In particular, the online artifacts that mediate interactions and develop affiliations provide social networks with the purposes of the creation, the maintenance or the disappearance of social links. In addition, the semantic structuring of the vocabulary generated by the users provides social networks with the knowledge that is produced, maintained and shared by their members to support their exchanges. Social network analysis is now provided with these multidimensional representations that include not only the linking structure but also the shared knowledge of the social network.
Our objective is to leverage social network analysis metrics for handling the semantic representations of social networks, which is a necessary step for fully achieving the social evolution of the business intelligence proposed by the ISICIL project.
3.
State of the Art on Social Network
Analysis and Its Application on the Web
« When we change the way we communicate, we change the society » Clay Shirky Social Network Analysis (SNA) provides graph algorithms to characterize the structure of social networks, strategic positions in these networks, specific sub-networks and decompositions of people and activities. This domain has raised lots of interests and the outburst of social data on the web has led to the collection of the biggest social networks ever.
In this chapter, we will review (1) the traditional methods and models that are used to build and represent social networks, (2) the different metrics and algorithms of social network analysis, and (3) the applications of social network analysis to online social networks.
3.1
Capture, Detect and Represent Social Networks
A social network is made of actors that are linked by social relations. Social actors can be people, organizations, or groups of actors. A wide range of social relations exists between actors; we can group these relations in three categories:
• explicit and declared relations between humans.
• interactions between actors.
• affiliation between actors.
Explicit relations include all the relations we can define between persons (e.g. parent, sibling, cousin, friendship, love, simple acquaintance, co-worker, etc.), between persons and organizations (e.g. member, employee, etc.), and inside organizations (e.g. owner, manage, etc.).
Interactions represent all the exchanges that could be observed between actors such as a discussion, a collaboration, a meeting or any action that involves at least two actors. Some interactions actively implicate all the concerned actors, like a synchronous discussion. Others are initiated by some actors and target other actors, like a single message that has a sender and a recipient.
Affiliations correspond to any similarity between actors that links them, like, for instance, sharing the same attributes, the same interests, the same activities, the same objects, or the same organizations.
The type of social links is determinant in the construction of the corresponding social networks. While the first social networks have been collected and analyzed by interviewing people or by observing social actors, social networks have also been extracted from many sources in order to achieve different purposes and confirm varied sociological hypothesis.
3.1.1
Explicit Relationship Networks
Initially data about social networks were mainly collected with interviews, pen and paper. Social networks were built from experiment with people who declared explicitly their relationships with other persons. Today, online social network services offer huge databases of such declared relationships that are easier to collect on the web; this part will be detailed in chapter 4, for now we present examples of the famous historical social networks.
One of the most popular social networks is the university-based karate club of Zachary [Zachary 1977]. Following the appearance of different internal conflicts in the club, the social structure emerging from the evolution of social links, i.e. creation and destruction, highlighted a break-up in the social cohesion. Consequently, this karate club was divided in two separate clubs due to relationships fission. The corresponding dataset was collected with interviews about the relationships among actors with the purpose of understanding how the fission occurred in this network. By observing the
evolution of social linkage, the authors have extracted patterns that enable us to predict an upcoming break-up in a social network. The Figure 3 proposes a visualisation of the collected network. Members of the first sub-club are represented by white circles and members of the other one are represented by grey squares. We can clearly witness a difference of social cohesion between the two groups and the whole network.
Figure 3. The Zachary karate club has been divided in two clubs in 1977. Members of the first club are represented by round white nodes and members of the second one by grey square nodes.
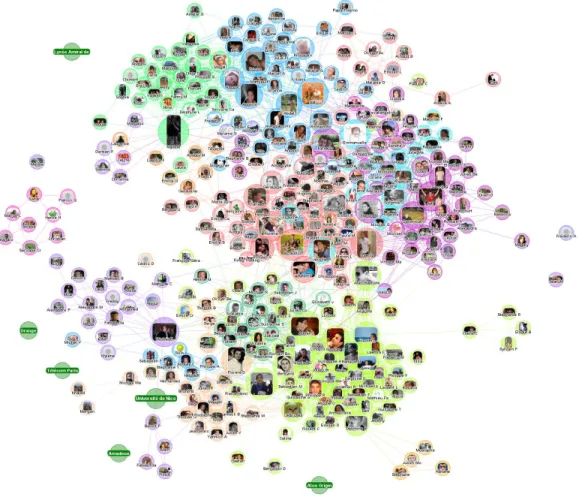
Many social networks were built from asking people to name some of their friends. Such social networks are consequently built from data such as Peter states Jack is his friend. Such methods may produce non reciprocal relationships as Peter can name Jack as its friend but not vice-versa. There are three ways to interpret such data. First we can infer that if Peter considers Jack as his friend, Jack also considers Peter as his friend, and we can define a symmetric friendship relation between Peter and Jack. Then we can also define a relationship only between persons that reciprocally declared them as friend. Finally we can simply define directed relationships and consider exploiting this specificity in the analysis. [Moody 2001] applied this interview method to build the friendship network of a U.S. school. This experiment highlighted the tendency of people to bond with people that share some attributes. He observed a clear separation between white and black individuals and between younger and older ones. The Figure 4 proposes a visualisation of this social network. The black people are on the right while the white people are on the left part of the visualisation. Similarly, we observe a horizontal division between younger and older people. The combination of age and colour attributes produces four main dense groups with poor linkage between these groups.
Figure 4. Frienship network of a U.S. school, which highlight a high tendency of children to bind with similar others.
3.1.2
Interaction Networks
Generally, social networks based on interactions are built from observation of actions, or traces of actions, involving at least two actors. Any action involving an exchange between actors is considered as an interaction and is used to set a relationship between them. The large variety of possible interactions between social actors offers many ways to detect and collect social network data.
Milgram conducted a famous experiment to measure the average distance between people in a very large social network [Milgram 1967]. people from one city of the United States were asked to send a letter to other people in a socially and geographically opposite city of the U.S. To make the letter reach its recipient, each holder of the letter had to write its name on the letter and give the letter to the person he thought was the closest from the final recipient. Milgram exploited the sequence of names on the letter to reconstitute the paths from the initial holders to the final recipients of the letters. Two persons which names are adjacent in the name list on a letter that reached its destination are linked by a “mail interaction”. Doing so, Milgram built a network from the traces on the letters, of the interactions between players of the experiment. He observed that the average paths between any two persons in the United States were of length 6. This result is also known as "six degrees of separation" (however, some criticisms of this experiment were recently published [Kleinfeld 2002]).
The U.S. College Football network is also an interaction network in which actors are football teams, namely organizations, and relations "represent regular-season games between the two teams they connect" [Girvan & Newman 2002]. Consequently, every time a game was played between two teams, a relationship was set, representing the
interaction of playing a same game. Teams are grouped into conferences, namely divisions of teams, and more games are played between teams of the same conference than between teams of different conferences. Consequently Newman observed more relationships among members of a same conference than between members of different conferences. Consequently, this network has a strong community structure and has been frequently used by researchers as a dataset for evaluating community partition algorithms.
3.1.3
Affiliation Networks
A broad range of social networks have been inferred and collected by analyzing similarities between actors. Similarities between actors are frequently a source of interactions. Moreover people that share characteristics tend to behave similarly. Similarity based relationships are more generally called affiliations.
Social network analysis has gained a lot of interest from economical sciences. In particular it is interesting to analyze how organizations and their members interact in order to understand economical mechanisms. In particular, an affiliation social network was built from the membership to the director board of U.S. industry firms and banks [Mariolis 1975]. The actors of this social network are the directors. A link between two directors is set whenever two directors are members of the same directory board. The analysis of this affiliation network highlighted many interest conflicts and showed how banks control and interlock such industry directory boards.
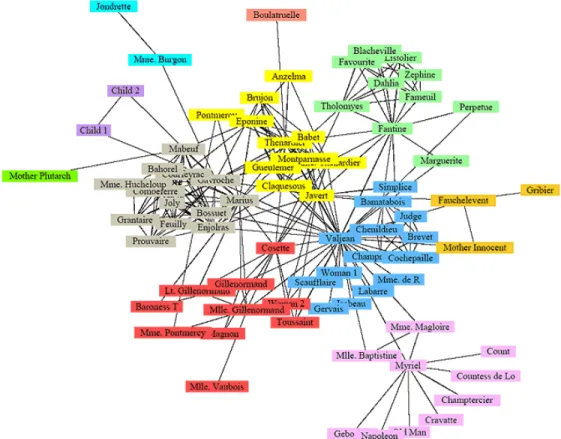
Another interesting affiliation network is the social network populated by the characters of Victor Hugo's novel "Les Miserables" [Knuth 1993]. A relation is set between two characters of the novel when they co-appear in a scene, and thus an affiliation network is built. This social network has been used in many experiments, in particular for evaluating community detection algorithms. The Figure 5 highlights a community partition of this social network.
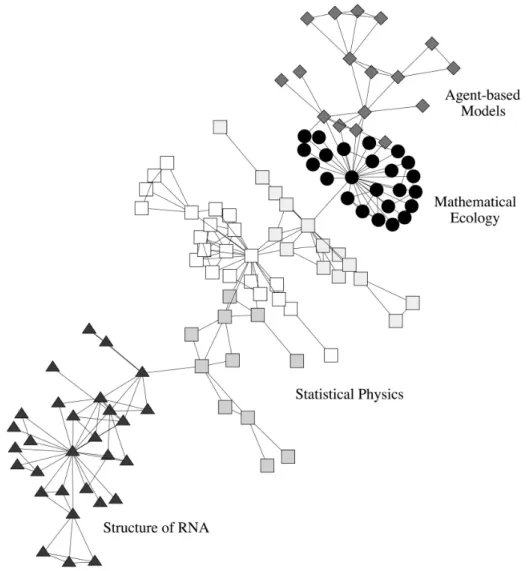
Many affiliation networks were also extracted from scientific paper databases, in order to build co-authorship networks. The actors are the authors of the papers. A relation is set between two actors who are co-authors of the same paper. These networks have been widely used to test social network analysis algorithms, in particular community detection algorithms and centrality algorithms. The Figure 6 represents the co-authorship network studied in [Newman 2006b].
Figure 5. Co-appearance social network of the characters of Victor Hugo's novel "Les Misérables".
3.1.4
Social Network Representation
In order to graphically visualize social networks, in 1930’s, Moreno systematized the first representations of social networks: the sociograms [Moreno 1933]. Sociograms consist in representing people by points and relationships by lines connecting points. These representations were also named 'web' due to their spider web aspect, this is an interesting unintentional coincidence of history. As little innovative as it may appears today, this type of visualisations offered to quickly detect some network features that are highlighted by specific visual patterns. As an example, Moreno introduced the concept of "star" for designing people having the most connections in a social network, due to the star shape formed by a point and its numerous connected lines. Sociograms were the first step for further involvement of mathematicians in social network analysis. [Harary & Norman 1953] were among the first mathematicians who made the relation between graphs and sociograms and who built mathematical models of social networks based on graph theory. In a graph, the nodes represent the actors and the edges represent relationships. [Scott 2000] proposes an historical overview of the first applications of graph theory to social network analysis in the mid of the 20th century. Today, Graph structure has been adopted as the main mathematical model for social networks in social sciences, computer science or economical sciences. Having a mathematical model enables us to better formalize the analysis of social networks, and propose algorithms to detect and compute graph patterns that characterize social organizations.
3.1.4.1 Definitions
Definition 3. Node: basic unit of a network that represents a resource, also called a vertex. In a social network we talk about actors or agents.
Definition 4. Edge: a connexion between two nodes. We also use the terms arcs or links.
Definition 5. Hyperedge: an edge than connects more than two nodes.
Definition 6. Directed edge: an edge used in only one direction, from its source node to its end node. In opposition, an undirected edge can be used in both directions and does not distinguish its extremity nodes.
Definition 7. Weighted edge: an edge with an assigned a value, called a weight, to represent the importance of this edge.
Definition 8. Labelled edge: an edge with a term used to label the relation. Definition 9. Graph: a graph is defined by a set of nodes and a set of edges. Definition 10.Hypergraph: an hypergraph is defined by a set of nodes and a set
of hyperedges [Berge 1985]
Definition 11.Directed graph: a directed graph is defined by a set of nodes and and a set of directed edges.
Definition 12. Weighted graph: a weighted graph is defined by a set of nodes and a set of weighted edges.
Definition 13. Labelled graph: a labelled graph is defined by a set of nodes and a set of labelled edges.
Definition 14.Multipartite graph: a multipartite graph is decomposed in k set of nodes, each set contains a unique type of node, with edges that connect nodes of different sets.
Definition 15. Bipartite graph: a multipartite graph with only 2 types of nodes. Definition 16. Tripartite graph: a multipartite graph with only 3 types of nodes. Definition 17. Degree: the degree of a node is its number of adjacent edges. Definition 18. Path: list of nodes of a graph, each linked to the next by an edge. Definition 19. Directed path: a sequence of directed edges from a source node to
an end node.
Definition 20. Geodesic and shortest path: shortest sequence of edges between two given nodes.
Definition 21.Diameter: the length of longest geodesics of the network.
Definition 22.Complete graph: a graph having an edge between any two pair of its nodes.
Definition 23.Connected graph: a graph having a path between any two pair of its nodes.
3.1.4.2 Notations
• A node is noted v and an edge between two nodes vi and vj is noted (vi, vj).
• A graph is noted G = (V, E) with V a set of nodes, E a set of edges, n= V the number of nodes, m= E the number of edges and, vi the ith node.
• A subgraph of G=(V,E) is noted G' = (V', E') with V'⊂V , E'⊂E | vi,vj
( )
∈E'⇒ vi∈V '&vj∈V ', n'=V' and m'= E'.• A bipartite graph is noted G = (U, V, E) with U and V two sets of nodes and E a set of edges, vi the ith node of V and ui the ith node of U.
• A tripartite graph is noted G = (U, V, W, E) with U, V, and W three sets of nodes and E a set of edges, ui the ith node of U, vi the ith node of V and, wi the ith node
of W.
• The degree of a node vi is noted d(vi).
• gij represent a geodesic between the nodes vi et vj, and|gij| represents the length
of a geodesic between vi et vj.
3.1.4.3 Using Different Types of Graphs
The famous social network of the Zachary karate club in Figure 3 is represented by a simple graph with undirected an unlabeled edges. More generally, social networks with symmetric relationships (e.g. married) are represented by undirected graphs. Inversely, directed graphs are well suited to model social networks with directed relationships (e.g. manages). For instance the interactions emerging from the sent letters in the Milgram experiment can be modelled with directed edges. In weighted graphs, weights are associated to edges to specify the intensity of the relationships, and in particular for
representing the frequency of interactions between people. In the U.S. College Football network, weights on edges can be used to represent the number of games played between teams. Labelled graphs are well suited to represent social networks containing different types of relationships (e.g. family, friends, colleague). Bipartite graphs are generally used to model affiliation networks using two types of nodes, the actors and the objects of the affiliation, and edges that always link nodes of each type. For instance in a graph representing directory boards of companies, we have 2 types of nodes, the companies and their directors, with edges linking companies to their directors. More complex social network with complex relationships involving more than two types of resources (e.g. an author, a paper, and a keyword) are represented by hyperedges producing hypergraphs.
3.1.4.4 Representing Graphs With Matrices
Definition 24. Matrix: A matrix is a rectangular table of values, in which each cell is noted aij with i and j that are the row and the column of the cell.
Matrices are popular mathematical objects for handling graphs. Usually, when modelling a graph with a matrix, the rows and the columns of a matrix represent the nodes of the graph, and the value in the cell aij in the matrix represents an edge (or an
absence of edge) between the corresponding nodes vi and vj. Generally, two types of
matrices are used for representing social networks: (1) adjacency matrices which rows and columns represent the same sets of nodes, and (2) incidence matrices which rows and columns represent different sets of nodes.
Definition 25. Adjacency Matrix: An adjacency matrix is a squared matrix in which rows and columns are labelled by the same list of nodes (the ith row and the ith column represent the same node).
Definition 26. Incidence Matrix: An incidence matrix have two types of nodes (e.g. authors and papers) with rows representing one type and columns the other one.
An adjacency matrix is well suited to represent a graph with only one type of nodes (e.g. rows and columns that represent persons). Consequently, a graph G = (V, E) with n=|V| can be represented with a matrix M with n lines and n columns. If there is no relationship between vi and vj this value is 0. If a relationship exists between vi and vj
this value is 1 in the case of a non weighted graph, and the weight of the relationships in the case of a weighted graph. In the case of a directed graph the rows and the columns represent respectively the source nodes and the end nodes of edges. A directed edge from vi to vj will be only represented by a positive value in cell aij. It is also possible to
use a negative value in the cell aji to represent a directed edge from vi to vj. The Figure 7
is an example of a matrix representing a social network built from the interaction (e.g. “collaborates with”) of 4 employees. This social network is undirected, so we have aij=
aji, i.e. the matrix is symmetric. The values that are contained in the matrix cells
represent the intensity of the corresponding collaborations. The Figure 8 is a sample of the adjacency matrix representing the Zachary karate club of the Figure 3.
Employee1 Employee2 Employee3 Employee4
Employee1 0 1 3 1
Employee2 1 0 1 0
Employee3 3 1 0 2
Employee4 1 0 2 0
Figure 7. Adjacency matrix of employees collaborating together, the value in a cell represents the number of shared projects between corresponding employees.
V1 V2 V3 V4 V5 V6 V7 … V1 - 1 1 1 1 1 1 … V2 1 - 1 1 0 0 0 … V3 1 1 - 1 0 0 0 … V4 1 1 1 - 0 0 0 … V5 1 0 0 0 - 0 1 … V6 1 0 0 0 0 - 1 … V7 1 0 0 0 1 1 - … … … … …
Figure 8. Sample of the adjacency matrix of the Zachary karate club.
An incidence matrix is well suited to represent affiliation networks with bipartite graphs. Consequently, a bipartite graph G = (U, V, E) with p=|V| and q=|U| can be represented with a matrix M with p lines and q columns. In this case the value of the cell aij represents the relation between nodes vi and uj. The principles to define weighted and
directed edges are identical to the principles of adjacency matrices, presented above. A p*q incidence matrix can be converted into two squared adjacency matrices of size p and q, one for each type of resource. The values of the cells of these adjacency matrices represent the number of shared connections in the incidence matrix. Figure 9 represents an example of incidence matrix built from the directory board of companies; rows and columns respectively represent companies and directors. The Figure 10 is the adjacency matrix of companies deduced from the shared directors of companies in the incidence matrix of Figure 9. For instance, the company 1 and the company 2 are both connected to the director 1 and the director 2. Consequently, in the adjacency matrix of companies, the value of the cells a12 and a21 is 2, and represents the intensity of the
interlock between the corresponding companies. Similarly the Figure 11 is the adjacency matrix of directors deduced from the companies shared by directors in the
incidence matrix of Figure 9. The values of the cell of this matrix represent the intensity of collaboration of the corresponding directors.
Director 1 Director 2 Director 3 Director 4 Director 5
Company 1 1 1 1 0 0
Company 2 1 1 0 1 1
Company 3 0 1 1 0 0
Company 4 0 0 1 1 1
Figure 9. Example of incidence matrix of the social network of directory boards.
Company 1 Company 2 Company 3 Company 4
Company 1 - 2 2 1
Company 2 2 - 1 2
Company 3 2 1 - 1
Company 4 1 2 1 -
Figure 10. Adjacency matrix of companies deduced from the Figure 9, each cell represents the number of directors shared by the corresponding companies.
Director 1 Director 2 Director 3 Director 4 Director 5
Director 1 - 2 1 1 1
Director 2 2 - 2 1 1
Director 3 1 2 - 1 1
Director 4 1 1 1 - 2
Director 5 1 1 1 2 -
Figure 11. Adjacency matrix of directors deduced from the Figure 9, each cell represents the number of companies shared by the corresponding directors.
Finally particular matrices are frequently used to encode the degree of the nodes of the graph that they represent. Such matrices are particularly well suited to compute structural properties of the graphs.
Definition 27. Degree Matrix: The degree matrix of a graph is a diagonal matrix with the degree of the graph's nodes on the diagonals
Definition 28. Laplacian Matrix: The Laplacian Matrix (or Kirchhoff matrix) of a graph is the difference between its degree matrix and its adjacency matrix. The value of the cells of a Laplacian Matrix is defined as follow:
∈ ≠ − = = otherwise E v v a j i if j i if v d a i j i ij 0 ) , ( nd 1 ) (
3.2
Social Network Analysis
SNA tries to understand and exploit the key features of social networks in order to manage their life cycle and predict their evolution. Much research has been conducted on SNA using graph theory [Scott 2000] [Wasserman & Faust 1994]. Among important results is the identification of sociometric features that characterize a network. SNA metrics can be decomposed into two categories; (1) some provide information about the position of actors and how they communicate and (2) others give information about the global structure of the social network.
3.2.1
Strategic Position and Important Actors
The Centrality highlights the most important actors and the strategic positions of the network. The main question of centrality is to define what makes an actor more central than another one. Different criteria have been considered to define the centrality, and the chosen criteria enable to obtain different information about the position of actors. The three main definitions of centrality are resumed by [Freeman 1979]: the degree centrality, the betweenness centrality and the closeness centrality.
Definition 29.Degree Centrality: The Degree centrality considers nodes with the highest degrees (number of adjacent edges) as the most central.
[Shaw 1954] introduced the idea to measure point centrality with its degree. It highlights the local popularity of the network, actors that influence their neighbourhood and ones who are highly visible in their community. In directed graphs the out-degree and in-degree are alternative definitions that take into account the direction of edges, representing respectively the influence and the support of the actor [Nieminem 1973]. In a directed graph, the outgoing and ingoing edges of a node respectively have this node as source and end. Consequently the out-degree and the in-degree of a node are respectively the number of its outgoing and ingoing edges. The n-degree is an alternative definition that widens the neighbourhood considered to a distance of n or less [Garrison 1960] [Pitts 1965]. The distance between two actors is the minimum number of relationships that link them. In respect with this definition the n-degree of an actor is the number of others actors he is linked to by a sequence of n relationships or less. However the n-degree is rarely used with n higher than 2 as it has been shown that
we cannot see, nor influence more distant network [Burt 1992]. The reach is equivalent to a 2-degree (3-degree in rare cases) and represents the network that an actor can see and/or influence. For instance, in the social network of Zachary karate club, the actors 1, 33 and 34 have degrees well above the rest of the network and are the most central both in terms of degree (Figure 12).
Definition 30. Betweenness Centrality: The betweenness centrality considers nodes that are more often on shortest path between other nodes as the most central.
[Bavelas 1948] introduced the idea that actors are more central when they are located on communication paths of the social network. The betweenness centrality focuses on the ability of an actor to be an intermediary between any two other actors in the network. An actor located on a geodesic path has a strategic position in the cohesion of a network and the flow of information, especially if this path is unique. For instance, an agent located on the only road connecting two groups of actors has a strong control on the communication between these groups. Consequently, a network is highly dependent on actors with high betweenness centrality and these actors have a strategic advantage due to their position as intermediaries and brokers [Shimbel 1953] [Cohn & Marriott 1958] [Burt 1992] [Holme et al 2002] [Burt 2004]. These actors have the power to choose to leverage or to lower the communication between groups and have a privileged access to information of each group [Burt 2004]. The more intermediate a node is, the more strategic its position is in the network. In a directed graph, the interpretation of the betweenness centrality is still the same but we only considered path without any change of direction. For instance, in the social network of Zachary karate club, the actors 3, 9, 14, 20, 31 and 32 are the most central in terms of betweenness, their absence or the failure of their links with one of the clubs would weaken the cohesion of the network (see Figure 12).
Definition 31.Closeness Centrality: The closeness centrality considers as most central the nodes that have the smallest average length of the roads (sequence of relationships) linking an actor to others.
[Leavitt 1951] considers the centrality as a measure of closeness in the social graph. The closeness centrality reveals the ability of a node to quickly connect with all the other actors of the network. In directed graphs, the interpretation of the closeness centrality is modified when we consider the direction of edges. The closeness centrality computed on outgoing and ingoing edges respectively represents the capacity of an actor to reach or to be reached in the whole network. For instance, in the social network of Zachary karate club, the actors 1, 33 and 34 are closer to other nodes in the network due to their high degrees and are the most central both in terms of degree and closeness.

![Figure 26. Sample of the linked schemas FOAF [Brickley & Miller 2004] and SIOC [Breslin et al 2005] (that are detailed in section 4.2)](https://thumb-eu.123doks.com/thumbv2/123doknet/13035383.382111/76.918.182.772.347.642/figure-sample-schemas-brickley-miller-breslin-detailed-section.webp)