HAL Id: cea-01765177
https://hal-cea.archives-ouvertes.fr/cea-01765177
Submitted on 11 Jan 2019
HAL is a multi-disciplinary open access
archive for the deposit and dissemination of
sci-entific research documents, whether they are
pub-lished or not. The documents may come from
teaching and research institutions in France or
abroad, or from public or private research centers.
L’archive ouverte pluridisciplinaire HAL, est
destinée au dépôt et à la diffusion de documents
scientifiques de niveau recherche, publiés ou non,
émanant des établissements d’enseignement et de
recherche français ou étrangers, des laboratoires
publics ou privés.
Feasibility of using a dose-area product ratio as beam
quality specifier for photon beams with small field sizes
Maria Pimpinella, Claudio Caporali, Antonio Stefano Guerra, Luca Silvi,
Vanessa de Coste, Assunta Petrucci, Frank Delaunay, Stéphane Dufreneix,
Jean Gouriou, Aimé Ostrowsky, et al.
To cite this version:
Maria Pimpinella, Claudio Caporali, Antonio Stefano Guerra, Luca Silvi, Vanessa de Coste, et al..
Feasibility of using a dose-area product ratio as beam quality specifier for photon beams with small field
sizes. Physica Medica, Elsevier, 2018, 45, pp.106 - 116. �10.1016/j.ejmp.2017.12.012�. �cea-01765177�
Feasibility of using a dose-area product ratio as beam quality specifier for photon
beams with small field sizes
Maria Pimpinella
a,⁎, Claudio Caporali
a, Antonio Stefano Guerra
a, Luca Silvi
a, Vanessa De Coste
a,
Assunta Petrucci
b, Frank Delaunay
c, Stéphane Dufreneix
c, Jean Gouriou
c, Aimé Ostrowsky
c, Benjamin
Rapp
c, Jean-Marc Bordy
c, Josiane Daures
c, Maïwenn Le Roy
c, Line Sommier
c, Didier Vermesse
c aIstituto Nazionale di Metrologia delle Radiazioni Ionizzanti, ENEA-INMRI, I-00123 Roma, ItalybS. Filippo Neri Hospital, UOSD Fisica Sanitaria, I-00135 Roma, Italy
cCEA, LIST, Laboratoire National Henri Becquerel (LNE-LNHB), F-91191 Gif-sur-Yvette, France
Purpose:
To investigate the feasibility of using the ratio of dose-area product at 20 cm and 10 cm water depths (DAPR20,10) as a
beam
quality specifier for radiotherapy photon beams with field diameter below 2 cm. Methods: Dose-area product was determined
as
the integral of absorbed dose to water (Dw) over a surface larger than the beam size. 6 MV and 10 MV photon beams with field
diameters
from 0.75 cm to 2 cm were considered. Monte Carlo (MC) simulations were performed to calculate energy-dependent
dosimetric
parameters and to study the DAPR20,10 properties. Aspects relevant to DAPR20,10 measurement were explored using
large-area
plane-parallel ionization chambers with different diameters.
Results:
DAPR20,10 was nearly independent of field size in line with the small differences among the corre-sponding mean beam
energies.
Both MC and experimental results showed a dependence of DAPR20,10 on the measurement setup and the surface over
which
Dw is integrated. For a given setup, DAPR20,10 values obtained using ionization chambers with different air-cavity
diameters
agreed with one another within 0.4%, after the application of MC correction factors accounting for effects due to the
chamber
size. DAPR20,10 differences among the small field sizes were within 1% and sensitivity to the beam energy resulted
similar
to that of established beam quality specifiers based on the point measurement of Dw.
Conclusions:
For a specific measurement setup and integration area, DAPR20,10 proved suitable to specify the beam quality of small
photon
1.beams for the selection of energy-dependent dosimetric parameters.
Introduction
In recent years, the use of small beams (field sizes smaller than 2 cm × 2 cm) in routine radiotherapy techniques has increased steadily. Nevertheless, small beam dosimetry is still challenging. The determi-nation of absorbed dose to water, Dw, in narrow photon beams is par-ticularly demanding, if the traditional approach of measuring Dwwith a point-like detector placed on the beam axis is followed. Even the use of high resolution detectors with sensitive volume of the order of tenths of mm3or less does not ensure a reliable D
wmeasurement in the absence of lateral electronic equilibrium [1]. When used in small field sizes, point-like detectors can exhibit large response variations (even more than 10%) depending on the detector material and construction details near the sensitive volume. These variations generally result in
underestimation (in the case of small volume ionization chambers) or overestimation (in the case of solid state detectors) of both Dw and output factors [2,3]. As a consequence detector specific correction factors[4]are required for accurate Dwmeasurement in small beams. Previous work in this field has focused on the evaluation of such cor-rection factors, either using direct Monte Carlo calculation or, experi-mentally, taking a given detector as reference, and results for the most widely used detectors have been reported in literature [1,5–14]. However, as no Dwprimary standards exist for field sizes smaller than 2 cm, discrepancies among published data are difficult to solve[15,16]. Moreover, the positioning of point-like detectors in narrow beams is also very critical for the measurement accuracy, since errors larger than 1% can occur even for uncertainties on the detector position as low as a few tenths of mm[17].
⁎Corresponding author at: Istituto Nazionale di Metrologia delle Radiazioni Ionizzanti, ENEA-INMRI CR Casaccia, Via Anguillarese 301, 00123 Roma, Italy.
E-mail address:[email protected](M. Pimpinella).
The above difficulties have raised interest in a different approach, based on measuring an integral quantity as reference quantity for small beam dosimetry, in analogy with the concept of dose-area product used for measurements in free space in diagnostic radiology[18], and ex-tending the concept to measurements performed in a material medium like in a water phantom[19–21]. For radiotherapy dosimetry applica-tion, the dose-area product (DAP) is defined as:
∫
= DAP D x y dxdy( , ) A w (1) where A is an area, in a plane perpendicular to the beam central axis, larger than the beam size at that plane, and corresponding to the active area of the detector used for the DAP measurement. A proper DAP detector should have a flat sensitive volume with cross-sectional area larger than the radiation field. Large-area plane-parallel ionization chambers (LACs) have been shown to be adequate DAP detectors[22,23]. In very small field sizes, positioning a DAP detector on the beam central axis is less critical than positioning a point-like detector. In addition, measurement of the integral dose is expected to be less detector dependent, if compared with the point-dose measurement by point-like detectors [24]. In fact, the latter requires corrections that strongly dependent on beam shape, detector type, and off-axis position in the small field. Conversely, even in the case of a composite clinical field, Monte Carlo calculations in[24]showed that differences in re-sponse among point-like detectors substantially diminish, if the de-tector signal is integrated over the whole radiation field. The Labor-atoire National Henri Becquerel (LNE-LNHB) recently developed a calorimeter for absolute measurement of DAP in small field sizes, making this quantity available for transfer from the calibration la-boratory to the user’s beam[25,26]. Then, in the scenario of a small beam dosimetry based on DAP references, defining the beam quality specifier in terms of DAP to link the calibration to the user’s beam becomes an attractive possibility.
In the present paper, the feasibility of expressing the photon beam quality in terms of a DAP ratio is explored for field diameters below 2 cm. Specifically the ratio of DAP at 20 cm and 10 cm water depths
∫
∫
= DAPR D x y dxdy D x y dxdy ( , ) ( , ) A w cm A w cm 20,10 ,20 ,10 (2)is considered in analogy with the traditional TPR20,10beam quality index [27] based on point-dose measurement. We thoroughly in-vestigated the properties of DAPR20,10in 6 MV and 10 MV small photon beams both by Monte Carlo calculation and experimentally, using LACs with different air-cavity diameters and characteristics. Two types of Linacs with different collimator systems were used. The aim of this work was: a) to verify the ability of DAPR20,10to discriminate between qualities of small beams for the purpose of selecting energy-dependent dosimetric data (i.e. ionization chamber calibration coefficient, cor-rection factors); b) to establish appropriate measurement conditions and procedures for the experimental determination of DAPR20,10as a beam quality specifier.
2. Materials and methods
Monte Carlo simulations of 6 MV and 10 MV clinical photon beams were performed in order to investigate the dependence of DAPR20,10on beam energy and field size. Moreover, Monte Carlo calculation was applied to evaluate the influence on DAPR20,10of the area over which
DAP is integrated (i.e. the detector active area). Measurement setups
with fixed source-to-surface distance (SSD) or with fixed source-to-de-tector distance (SDD) were considered. Additionally, the water-to-air stopping power ratio, sw.air, the most important energy-dependent parameter affecting ionization chamber response, was calculated at reference depth as a function of the beam energy and field size, to assess whether the sw.air values are correlated with the corresponding
DAPR20,10 values. Finally, ratios of ionization signals at 20 cm and 10 cm water depths were measured under various experimental con-ditions (beam energies, field sizes and measurement setups) by means of LACs with different active areas, and experimental results were compared to those obtained by Monte Carlo calculation.
2.1. Accelerators and photon beams
Accelerators used in this work were a Varian DHX clinical accel-erator available at San Filippo Neri Hospital in Rome and a General-Electric (GE) Saturne 43 clinical accelerator at LNE-LNHB. Since re-producibility of jaw positioning was not good enough for small beams (in some cases measurement reproducibility was larger than 1%), only beams shaped by fixed cones were considered for DAPR measurement. The Varian DHX accelerator produces 6 MV and 10 MV photon beams and it is equipped with Radionics stereotactic collimators. These are tapered conical collimators using Cerrobend (27% lead, 50% bis-muth, 13% tin and 10% cadmium) as collimating material. A Cerrobend cylinder with central conical opening is inserted into a stainless steel cylindrical housing with length of 12.5 cm and outer diameter of 7.5 cm. Using such cones and a constant 7 cm × 7 cm secondary colli-mator (e.g. linac jaws) setting, circular beams with diameters of 2.00 cm, 1.50 cm and 1.25 cm at the isocenter are produced. The beams shaped by the stereotactic collimators were used for investigating the properties of DAPR20,10by Monte Carlo simulations and measurements. For the Saturne 43 accelerator, specifically designed external colli-mators made of tungsten alloy (D185) with a length of 10 cm and a conically-shaped hole were added to produce 6 MV beams with dia-meters of 2 cm, 1 cm and 0.75 cm at the reference plane. The alignment was checked optically with a telescope. The entry and exit apertures of the collimator had to be centred on the same axis and the radial dose distribution was checked with EBT3 films. Two additional monitor io-nization chambers were mounted on the external collimator in front of the beam defined by the linac jaws. For the three small beams,
DAPR20,10 was experimentally determined setting an SDD of 100 cm and integrating the absorbed dose over a detector surface of 3 cm dia-meter.
2.2. Monte Carlo simulations 2.2.1. Varian DHX accelerator
The BEAMnrc code[28]of the EGSnrc Monte Carlo system version V4-r2-4 [29]was used for simulating the 6 MV and 10 MV photon beams produced by the Varian DHX accelerator (Fig. 1). First, square photon beams shaped by the jaws were simulated with the purpose of validating the accelerator model by comparing the calculated and measured dose distributions. The mean energy of the initial electron beam was tuned by comparing calculated and measured percentage depth dose (PDD) curves for the 10 cm × 10 cm field size. A circular, Gaussian spatial distribution was assumed for the electron beam in-cident on the target. The full width at half maximum (FWHM) of the Gaussian distribution was determined by comparing simulated and measured total scatter factors for the 1 cm × 1 cm field size, according to the procedure proposed by Francescon et al.[30]. Then, the 6 MV and 10 MV stereotactic beams shaped by the Radionics cones were si-mulated and the corresponding phase-space files (PSFs) generated. To extend the range of beam sizes studied, square fields (side 1.6 cm, 1.0 cm, 0.8 cm and 0.5 cm at the isocenter) defined by the linac jaws were also simulated. The BEAMDP program[31]was used to analyse the phase-space files and to derive the photon beam energy spectra.
The values of the EGSnrc simulation parameters are summarized in
table 1. For the BEAMnrc simulations, cutoff energies were set to
10 keV for photons (PCUT) and 700 keV for electrons (ECUT, electron rest mass included). The range rejection (RR) and the directional bremsstrahlung splitting (DBS) techniques were applied to improve the calculation efficiency of photon beam simulations [32,33]. The RR
parameter ESAVE, defined as the threshold energy below which sec-ondary electrons having ranges shorter than the nearest region boundary are stopped, was set to 2 MeV, but RR was not applied in the accelerator target. For the DBS technique, a splitting value of 1000 was used with a splitting field size extending at least 2 cm beyond the beam edge at 100 cm source distance. PSFs were scored in air at 80 cm, 90 cm and 100 cm distance from the target and used as source inputs into the EGSnrc/DOSXYZnrc, EGSnrc/DOSRZnrc and EGSnrc/SPRRZnrc user codes[34]for calculating dose profiles (PDD curves, cross-plane and in-plane profiles), DAP and sw.airvalues, respectively. For these calcula-tions, the simulation parameters were the same as for the BEAMnrc simulations except for the electron cutoff energy which was set to 521 keV (electron rest mass included). To investigate the field size de-pendency of the beam energy distribution in water, a water phantom was included in the BEAMnrc simulations at a source distance of 90 cm. Phase-space files were generated at 10 cm and 20 cm depths in water, and analysed.
2.2.2. Saturne 43 accelerator
For the Monte Carlo simulation of the GE Saturne 43 beams, two different Monte Carlo codes, EGSnrc[29]and PENELOPE[35], were used. The beam radial anisotropy was measured using EBT3 films and the PDD curves, to be used for verification of the simulation results, were measured using ionization chambers. A PTW 31014, an Exradin A1SL and a homemade plane-parallel ionization chamber were used. The Monte Carlo beam parameters (energy and spot size of the initial electron beam) were defined for the 2 cm beam diameter. Then, the same beam parameters were applied for the 1 cm and 0.75 cm beam diameters and the simulation results compared with measurements. The beam parameters chosen for a parallelized version of PENELOPE 2006 with the MPI library[35,36]and EGSnrc version V4-r2-4 simulations were rather different. For the PENELOPE calculations, the electron energy spectrum was Gaussian (6.25 MeV, standard deviation of
450 keV) and the electrons reached the target uniformly on a disc-shaped focal spot of 1 mm diameter. For the EGSnrc calculations, the electron energy spectrum was not Gaussian but based on a more re-presentative spectrum[37]and the electrons reached the target with a Gaussian spatial distribution (FWHM of 1 mm) and a maximum angular spread around the Z axis of 0.2°. The EGSnrc parameters were almost identical to those described in the previous section, except for the DBS splitting parameter set to 1500. The PENELOPE simulation parameters are summarized inTable 2. The C1 parameter is linked to the average angular deflection produced by multiple elastic scattering along a path length equal to the mean free path between two hard elastic events. The C2 parameter is the maximum average fractional energy loss between two consecutive hard elastic events. The WCC and WCR parameters are the cutoff energy losses for hard inelastic collisions and hard brems-strahlung emission respectively. DSMAX is the maximum mean free path between two hard elastic events. For variance reduction, oriented splitting for bremsstrahlung events in the target (i.e. when a particle exits a specific area, the particle is split into several equivalent particles distributed around a circle of radius defined by current particle posi-tion) and an additional splitting using the cylindrical symmetry before reaching the jaws were used. This is based on the activation of forced bremsstrahlung emission for primary electrons whose direction is within a cone with a specific half angle. When this occurs, the number of secondary bremsstrahlung photons that are emitted from primary electrons is increased. For dose calculations, another splitting is done just before the water-phantom entrance surface.
Fig. 1. Sketch of the Varian DHX accelerator model used for the simulation of stereotactic photon beams shaped by Radionics cones used as tertiary collimators: 1- target, 2-static collimators, 3- vacuum window, 4- flattening filter, 5-monitor chamber, 6- jaws, 7- stereotactic cone holder (Aluminum), 8- stereotactic Cerrobend cone. Features of the stereotactic collimators (holder and cones) are shown by the picture on the right.
Table 1
Settings of radiation transport parameters for EGSnrc simulations. Parameter Setting value
PCUT (keV) 10
ECUT (keV) 700 (BEAMnrc simulations)
521 (DOSRZnrc, DOSXYZnrc, SPRRZnrc simulations)
Electron step algorithm PRESTA-II Boundary crossing algorithm EXACT Photon cross sections XCOM
Table 2
PENELOPE simulation parameters in the accelerator head and in water. Parameter Setting value C1/C2 0.05/0.05 Cutoff energies (keV): electrons /
photons / positrons
500/10/500 (accelerator head) 50/10/50 (water phantom) Wcc/Wcr (keV) 10/10 (accelerator head)
5/5 (water phantom)
DSMAX 1/20th of the smallest dimension for the target
1/10th of the thickness for other elements
Oriented splitting Splitting number 100 Cone half-angle 4° Cylindrical symmetry splitting Splitting number 20 Phantom splitting Splitting number 20
2.2.3. Calculation of water-to-air stopping power ratios
The EGSnrc/SPRRZnrc user code[34]was applied to calculate sw,air for all the beams used in this work. The SPRRZnrc code calculates sw,air using an on-the-fly technique to score the energy deposition in a cavity filled with the transport medium (i.e. water) and then deriving the energy deposition in the cavity when filled with air[34]. Compared to off-line sw,aircalculation based on scoring the electron fluence spectrum in water, the on-the-fly technique avoids possible effects on the calcu-lation results due to the actual number of energy bins used in the spectrum.
A water phantom with 20 cm radius and 30 cm height was con-sidered and sw,airvalues were calculated at 10 cm and 20 cm depths in water, using cylindrical scoring regions centred on the beam axis with radii in the range 0.1–5 cm, and a height of 2 mm. Values of sw,air ob-tained with a scoring region radius of 1 mm are related to Dwpoint measurement. Scoring regions larger than the stereotactic field sizes were considered more appropriate to evaluate sw,airvalues related to the DAP quantity as defined in this work.
2.2.4. DAPR20,10calculations
Using the EGSnrc/DOSRZnrc user code[34], DAPR20,10values were determined for all the simulated Varian DHX beams as a function of the radius of the surface over which the absorbed dose is integrated. To this aim, DAP values were calculated at 10 cm and 20 cm depths in water as a function of the radius of the scoring region. Since the Monte Carlo scoring region corresponds to the detector active area, radii were varied from 1.5 cm to 6 cm, to match the range of radii of the available LACs. Both the SSD setup (i.e. DAP at 10 and 20 cm water depths determined with a fixed SSD, moving the chamber) and the SDD setup (i.e. DAP at 10 and 20 cm water depths determined with the detector at a fixed distance from the source, moving the phantom) were simulated. SSD values of 80 cm, 90 cm and 100 cm as well as an SDD of 100 cm were considered. DAPR20,10values referring to an integration surface with radius 1.5 cm were also calculated for the GE Saturne 43 6 MV beams with diameters 2 cm, 1 cm and 0.75 cm using both the EGSnrc and PENELOPE codes.
2.3. Measurements
LACs with collecting electrode diameters larger than the field size were used for measuring the ratios of ionization signals at 20 cm and 10 cm depths in water (M(20)/M(10)). The M(20)/M(10) ratio re-presents the DAPR20,10integrated over the chamber active area, if the ionization chamber response in terms of DAP does not change with the water depth.
Measurements at the Varian DHX accelerator were made using two ionization chambers: a PTW type 34070 (BP_IC) and a PTW type 7862 (TC_IC) (PTW, Freiburg, Germany). The BP_IC chamber is waterproof and has a collecting electrode diameter of 8.16 cm, an inter-electrode spacing of 2 mm and PMMA entrance and exit windows of 0.4 g cm−2 water equivalent thickness. The T_IC chamber is a circular plane-par-allel transmission chamber with thin entrance and exit windows (0.028 g cm−2water equivalent thickness). The chamber sensitive vo-lume has a diameter of 9.65 cm and an inter-electrode spacing of 2.4 mm. A PTW Unidos E Universal Dosimeter was used for DAPR measurements and a PTW Tandem Dual Channel Electrometer was used for scanning measurements (i.e. lateral beam profiles and depth ioni-zation distributions).
Measurements at the GE Saturne 43 accelerator were made using the following ionization chambers: a BP_IC, a PTW type 34073 (col-lecting diameter of 3.96 cm) and a homemade plane-parallel ionization chamber (SV-PMMA: collecting diameter of 3 cm, inter-electrode spa-cing of 2 mm)[38].
The chambers were positioned in a water phantom with their re-ference point (i.e. the centre of the chamber at the air cavity entrance) at the measurement depth. Since both the TC_IC and the SV-PMMA
chambers are not waterproof, a PMMA envelope (0.5 mm thick in front of the chamber entrance window) was used for measurements in water. Signal stability, measurement reproducibility and saturation curves were measured for all the chambers at different depths in water. Corrections for ion recombination and polarity effects were determined and applied to the chamber signal at each measurement depth.
Concerning ion recombination effects, it should be mentioned that when an ionization chamber larger than the beam is used in a linac, volume recombination is dominant in the direct irradiation field, but near the collecting electrode edge, initial recombination prevails. Examination of the Boag’s theory [39] shows that the two-voltage method[27]can also be used to calculate the saturation correction for partially irradiated ionization chambers as long as the number of cre-ated charges per volume unit is homogeneous in each electric field tube of force between electrodes (homogeneous irradiation in the tube of force). This is not difficult to achieve for plane-parallel ionization chambers with a small gap between the electrodes. However, mea-surements showed that among the different plane-parallel ionization chambers tested, the charges measured (M) for different inter-electrode voltages (V) do not always follow Boag’s theory in beams smaller than the ionization chamber. Thus the saturation correction factor was cal-culated using the tangent of the best fit curve 1/M = f(1/V) at the point corresponding to the usually applied polarizing voltage, but the two-voltage method was applied whenever measurements showed linearity of 1/M versus 1/V.
2.4. Uncertainties
Uncertainties were estimated according to the guidelines of the Guide to the Expression of Uncertainties in Measurement[40]and are expressed in terms of standard uncertainties (coverage factor k = 1). According to[40]the number in parenthesis after a value is the nu-merical value of the uncertainty referred to the last digit(s) of the re-ported result.
3. Results
3.1. Monte Carlo results
3.1.1. Water-to-air stopping power ratios
Table 3shows sw,airvalues calculated at a depth of 10 cm in water for the 6 MV and 10 MV Varian DHX beams, together with the corre-sponding photon fluence-weighted mean energies. Type A relative standard uncertainties were typically below 0.1%.
Significant differences in mean energy values were observed be-tween the reference (10 cm × 10 cm) and the stereotactic beams. On the contrary, mean energy variations between small beams were always below 4% and the corresponding differences in sw,airvalues were within 0.2%. The sw,airvalues specifically calculated for the 10 MV and 6 MV stereotactic beams were up to about 0.6% and 0.3% lower than the corresponding values pertaining to the 10 cm × 10 cm field size (i.e. the
Table 3
Water-to-air stopping-power ratios, sw,air, calculated by means of the EGSnrc/SPRRZnrc
user code for the Varian DHX 6 MV and 10 MV beams at 10 cm water depth for various field sizes. Radius of the scoring region was 0.1 cm or 1.5 cm for the sw,airvalues in
brackets. The standard uncertainty of sw,airis typically below 0.1%. The photon
fluence-weighted mean energies are also reported in the 2nd and 4th column. Field size 6 MV 10 MV = Ez 10cm (MeV) sw,air Ez 10cm= (MeV) sw,air 10 cm × 10 cm 1.378 1.1213 [1.1209] 2.306 1.1077 [1.1069] ϕ= 2.00 cm 1.874 1.1188 [1.1190] 3.198 1.1034 [1.1033] ϕ=1.50 cm 1.924 1.1184 [1.1189] 3.282 1.1027 [1.1035] ϕ=1.25 cm 1.941 1.1181 [1.1187] 3.319 1.1012 [1.1035]
values currently used for radiotherapy reference dosimetry based on point measurement of Dw). These results confirm previous findings in the literature reporting differences that are smaller than 0.5% between broad (10 cm × 10 cm) and narrow 6 MV beams at reference depth
[41–45]. Previous studies also indicate that differences become larger at higher energies and values up to 1.1% are reported in case of a 24 MV beam[43].
Mean energy and sw,airdata intable 3refer to the beam axis and it should be noted that the photon spectra vary with the radial distance from the central axis. At a given depth in water, an energy decrease is generally observed when the radial distance increases. This is especially true beyond the beam edge where contributions to the photon energy spectra come from low-energy photons generated by radiation inter-actions in water. For the Varian stereotactic beams, the photon fluence-weighted mean energy calculated for scoring regions with radius ran-ging from 0.5 cm to 5 cm varied up to about 10%. The associated effects on the sw,airvalues were up to 0.2% for the 6 MV beams and up to 0.5% for the 10 MV beams. Differences between sw,airvalues at 10 cm and 20 cm were always within 0.2%.
For the GE Saturne 43 accelerator, sw,airvalues calculated for the 6 MV beam with diameter of 2 cm, 1 cm and 0.75 cm and disc-shaped (radius 1.5 cm) scoring region at 10 cm depth in water were very close to each other (from 1.1170 to 1.1171) as well as the photon fluence-weighted mean energies (from 1.977 to 1.979 MeV). Differences from the corresponding sw,airvalues for the Varian DHX linac (table 3, values in brackets) were about -0.2%, in line with the slightly lower (around -5%) mean energies of the Varian simulated beams.
3.1.2. Calculation of DAPR20,10
Table 4shows DAPR20,10values calculated for the Varian DHX 6 MV and 10 MV small circular beams of diameters ϕ, using dose scoring regions with different radii (R). Type A relative standard uncertainties were in the range 0.15–0.3%.
The DAPR20,10values reported intable 4refer to the SSD setup with SSD = 100 cm and the SDD setup with SDD = 100 cm. For both setups, the DAPR20,10values relevant to the same integration area were almost independent of the beam diameter, in line with the results of Monte Carlo calculations showing that the mean beam energies were almost the same (section3.1.1). Even if an increase in the DAPR20,10value can be noted when the field diameter decreases, especially for the SDD setup, differences among DAPR20,10values were generally within the expanded type A uncertainty (coverage factor k = 3). On the other hand, data intable 4clearly show a variation of DAPR20,10value with both setup and scoring region radius. Due to the different distances from the source in the SSD configuration, the scoring regions at 120 cm
source distance (20 cm depth) receive less of the scattered radiation outside the beam than the equivalent scoring regions at 110 cm source distance (10 cm depth). As a consequence DAPR20,10values calculated for the SSD setup were always lower than those calculated for the SDD setup. Deviations about 1–2% were observed with no clear dependence on energy, field diameter, or scoring region radius.
As shown inTable 4, DAPR20,10increases with the scoring region radius for both SSD and SDD setups and for all of the field sizes con-sidered. When the radius of the scoring region increases, the relative contribution to DAP from the scattered radiation increases more at 20 cm depth than at 10 cm depth. It could be reasonably contended that if the radius of the scoring region increases, more and more of the scattered radiation will be seen and DAPR20,10will tend to an upper limit. However, the calculated DAPR20,10value increased all over the R range (1.5 cm to 6 cm) considered, with an approximately linear rela-tion. It could be expected that, for even higher R values, DAPR20,10 deviates from linearity to reach a limit, but this is likely to occur for R values far larger than the radius of the available LACs. As an example,
DAPR20,10for the SDD setup is shown inFig. 2as a function of R for the 6 MV and 10 MV beams with field diameter 1.25 cm. The increase in the
DAPR20,10value in the R range from 1.5 cm to 6 cm is about 1.9% per cm and 1.5% per cm for the 6 MV and 10 MV beams, respectively. These figures slightly decrease when the beam radius increases, their values being 1.7% per cm and 1.4% per cm for the beam with a diameter of
Table 4
Ratios of DAP at 20 cm and 10 cm in water calculated by Monte Carlo with different scoring region radii (R) for Varian DHX 6 MV and 10 MV circular beams with field diameter (ϕ) 2.00 cm, 1.50 cm and 1.25 cm for the SSD and SDD setups. The reported uncertainties are type A standard uncertainties (between 0.15% and 0.3%).
DAPR20,10–6 MV–Varian DHX SSD setup (SSD = 100 cm) SDD setup (SDD = 100 cm) R (cm) ϕ= 2.00 cm ϕ= 1.50 cm ϕ= 1.25 cm ϕ= 2.00 cm ϕ= 1.50 cm ϕ= 1.25 cm 1.5 0.617 (1) 0.621 (1) 0.622 (1) 0.628 (1) 0.629 (1) 0.630 (1) 4.0 0.646 (1) 0.644 (1) 0.643 (1) 0.654 (1) 0.657 (1) 0.661 (1) 5.0 0.658 (1) 0.657 (1) 0.658 (1) 0.664 (1) 0.668 (1) 0.672 (1) DAPR20,10–10 MV-Varian DHX SSD setup (SSD = 100 cm) SDD setup (SDD = 100 cm) R (cm) ϕ= 2.00 cm ϕ= 1.50 cm ϕ= 1.25 cm ϕ= 2.00 cm ϕ= 1.50 cm ϕ= 1.25 cm 1.5 0.682 (2) 0.688 (2) 0.691 (2) 0.697 (2) 0.698 (2) 0.698 (2) 4.0 0.713 (2) 0.709 (2) 0.708 (2) 0.723 (1) 0.724 (1) 0.725 (2) 5.0 0.724 (2) 0.722 (2) 0.722 (2) 0.732 (1) 0.734 (1) 0.735 (2) y = 0.0101x + 0.684 R² = 0.996 y = 0.0118x + 0.6126 R² = 0.999 0.55 0.60 0.65 0.70 0.75 0.80 0 1 2 3 4 5 6 7 DAP R20, 10
Scoring region radius (cm)
10 MV -ĭ 1.25 cm 6 MV -ĭ 1.25 cm
Fig. 2. Monte Carlo calculated DAPR20,10with SDD 100 cm as a function of the scoring
region radius, R, for the 6 MV and 10 MV stereotactic beams with diameter 1.25 cm produced by the Varian DHX accelerator.
2 cm.
Calculations performed for the square beams defined by the linac jaws confirmed that DAPR20,10value referred to a given integration area is almost independent of the beam size (differences were within 1% in the range of field side from 1.6 cm to 0.5 cm). On the other hand,
DAPR20,10for the square beams was less sensitive to the radius of the scoring region than for the stereotactic beams. The DAPR20,10variation with R was typically 1.2% per cm. When comparing results obtained for beams with equivalent sections (i.e. circular beam with diameter 1.25 cm and square beam with side 1.1 cm) differences between
DAPR20,10values were within the statistical uncertainty (0.1%) for a scoring region radius of 1.5 cm but around 1.5% for a scoring region radius of 6 cm.
A possible influence of the size of the water phantom on the cal-culated DAPR20,10 was also considered. No appreciable effects were found for phantom radii larger than 20 cm and phantom heights above 30 cm. The maximum variations of DAPR20,10above these phantom size limits were lower than 0.15% and, therefore, within the statistical un-certainties.
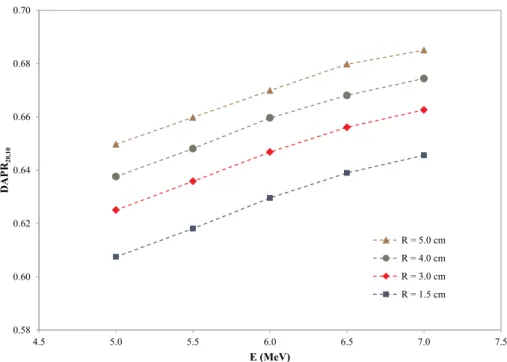
Finally effects of electron spot size and energy of the initial electron beam on DAPR20,10calculation were evaluated by modifying those si-mulation parameters for the 6 MV beam. The FWHM of the electron spatial distribution was varied from 1.0 mm to 2.5 mm and the corre-sponding variations in DAPR20,10values were smaller than 0.3% even for the smallest beam simulated (square beam with 0.5 cm side). The initial electron beam energy was varied in the range from 5 MeV to 7 MeV for the 6 MV beam with diameter of 1.25 cm. As illustrated in
Fig. 3, the calculated DAPR20,10values show high correlation with the initial electron beam energy whatever the scoring region radius in the range 1.5–5 cm.
Table 5shows DAPR20,10values for the GE Saturne 43 accelerator calculated in the SDD setup with EGSnrc and PENELOPE using a scoring region radius of 1.5 cm. Except for the value corresponding to the beam diameter of 1 cm, results from both codes agree within one statistical standard deviation. Results are also rather close for the different beam diameters with very similar energy spectra. On the other hand,
DAPR20,10values referring to the GE Saturne 43 accelerator are larger than those calculated for the Varian DHX accelerator (6 MV, SDD = 100 cm, R = 1.5 cm) by about 1.7%. This could be partially ascribed to the different mean energies of the simulated beams, as mentioned in Section3.1.1.
3.2. Experimental results
All the tested ionization chambers showed signal drifts in water in a 60Co beam. The drift was of 0.06% per hour for the SV-PMMA, 0.1% per hour for the BP_IC, 0.2% per hour for the T_IC and 0.4% per hour for the PTW 34073. Given the large drift, the PTW 34073 chamber was re-jected for this study. The drift for the SV-PMMA ionization chamber was attributed to deformations of the PMMA waterproof box which is in contact with the front graphite electrode.
In the Varian DHX beams, the repeatability of the ionization chamber signal was better than 0.1% and the short-term reproduci-bility, evaluated during a measurement session, was 0.3%. The signal variability during a measurement session was mostly ascribed to the reproducibility of the beam profile, since the uncertainty component due to the chamber positioning at the measurement depth was 0.05% (positioning uncertainty was 0.1 mm). The saturation correction factor determined at various depths in water ranged from 1.001 to 1.003 for the BP_IC chamber and was around 1.001 for the TC_IC chamber, with no dependence on depth or field size. The polarity correction factor for both chambers ranged from 1.001 to 1.002.
Fig. 4shows the normalized depth ionizing curves measured using the BP_IC chamber in the Varian 6 MV beams with reference and ste-reotactic field sizes. Differences along the curves referring to stereo-tactic beams were generally within ± 1%. Similar results were ob-tained for the 10 MV beams. Differences in M(20)/M(10) values obtained with SSD values of 80 cm, 90 cm and 100 cm were well within 0.5% for both photon energies with no evidence of SSD dependence. However, M(20)/M(10) values obtained in the SSD setups using the
0.58 0.60 0.62 0.64 0.66 0.68 0.70 4.5 5.0 5.5 6.0 6.5 7.0 7.5 DAP R20,10 E (MeV) R = 5.0 cm R = 4.0 cm R = 3.0 cm R = 1.5 cm
Fig. 3. Calculated DAPR20,10with scoring region radii (R) of
1.5 cm, 3 cm, 4 cm and 5 cm vs the initial electron beam energy used for the Monte Carlo simulation of the Varian 6 MV beam with diameter of 1.25 cm.
Table 5
Ratios of DAP at 20 cm and 10 cm in water calculated by PENELOPE and EGSnrc Monte Carlo codes with a scoring region radius (R) of 1.5 cm for GE Saturne 43 6 MV circular beams with field diameter (ϕ) 2 cm, 1 cm and 0.75 cm for the SDD setup (SDD = 100 cm). The last line gives the ratios between the DAP at 20 cm and 10 cm obtained by PENELOPE and EGSnrc. The reported uncertainties are type A standard uncertainties.
DAPR20,10–6 MV–GE Saturne 43
ϕ= 2 cm ϕ= 1 cm ϕ= 0.75 cm PENELOPE 0.639 (1) 0.642 (2) 0.641 (3) EGSnrc 0.6385 (2) 0.6392 (4) 0.6404 (2) Ratio 1.0009 (14) 1.0038 (24) 1.0011 (39)
BP_IC chamber were systematically lower than those obtained by the T_IC chamber. Differences were typically around 1.5%.M(20)/M(10) measurements were also made in the SDD setup (SDD = 100 cm) and results are shown intable 6. Differences between M(20)/M(10)values obtained by the BP_IC and TC_IC chambers were typically around 1%. These differences, as well as those observed for the SSD setup, can be ascribed to the different collecting electrode diameters of the two io-nization chambers, in agreement with the Monte Carlo calculations which showed a dependence of DAPR20,10on the radius of the dose scoring region (for the SDD setup, Monte Carlo differences were in the range 0.9% to 1.2% using R = 4.08 cm and 4.825 cm).
Data intable 6also show a tendency of M(20)/M(10)ratio to in-crease when the field diameter dein-creases. At 6 MV, the values referring to 2 cm and 1.25 cm beam diameters differ from each other by 1.3% and 1.6% for the BP_IC and the T_IC chambers, respectively. The cor-responding differences for the 10 MV beams are 0.7% and 1.2%. The Monte Carlo calculated differences were 1.0% and 1.2% for 6 MV, and 0.3% and 0.4% for 10 MV.
For the GE Saturne 43 accelerator, M(20)/M(10)ratios measured in the SDD setup for three beam diameters (2 cm, 1 cm and 0.75 cm) with the SV-PMMA and the BP_IC chambers are shown intable 7. Differences among the measured ratios were 0.43% for the 3 cm sensitive diameter and 1.4% for the 8.16 cm sensitive diameter. The differences between the M(20)/M(10)ratios measured by the two ionization chambers were larger (around 4%) than data shown intable 6as the size difference of the collecting surfaces is larger. The results obtained with the BP_IC
chamber are consistent between the two accelerators, the M(20)/M(10) difference being 0.36% for the 6 MV beams with 2 cm diameter.
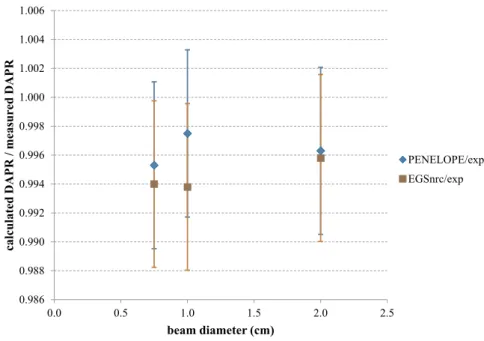
InFig. 5 the M(20)/M(10) ratios measured using the SV-PMMA
chamber are compared to the Monte Carlo DAPR20,10values calculated with a scoring region of 1.5 cm radius. While PENELOPE and EGSnrc calculations gave comparable results, the differences between the cal-culated and the corresponding measured DAPR20,10were around 0.5% and the calculated values were systematically smaller than the mea-sured ones. The 0.5% difference is consistent with the type B un-certainty (0.55%, k = 1) associated to the ratio of DAP values calcu-lated by Monte Carlo using the same integration area (see details in
Appendix A).
4. Discussion
4.1. Reference integration area
In this work, the properties of DAPR20,10in water were studied both by Monte Carlo simulations and by measurements using large-area io-nization chambers in 6 MV and 10 MV photon beams with field sizes below 2 cm. Using the Monte Carlo phase-space files describing ste-reotactic photon beams, DAPR20,10was calculated for different values of the integration area (always larger than the beam size), using both SSD and SDD setups. Calculation results showed a dependence of
DAPR20,10on both the setup and the size of the integration area. Such dependences were experimentally confirmed by comparing ratios of ionization signals at 20 cm and 10 cm water depths obtained by means of LACs with different collecting electrode diameters. Taken together,
Fig. 4. Normalized depth ionization curves (SSD 100 cm) measured with a PTW 34070 ionization chamber with col-lecting electrode diameter of 8.16 cm at 6 MV for the re-ference field size (10 cm × 10 cm) and three stereotactic beams with diameter 2.00 cm, 1.50 cm and 1.25 cm at the phantom surface.
Table 6
Ratios of ionization chamber readings at 20 cm and 10 cm depths in water obtained at a fixed source to detector distance of 100 cm (SDD) for 6 MV and 10 MV stereotactic beams using a transmission chamber (T_IC) and a PTW 34070 ionization chamber (BP_IC) with collecting electrode diameter of 9.65 cm and 8.16 cm, respectively. The combined relative standard uncertainty of M(20)/M(10) is 0.4%.
Field diameter M(20)/M(10), SDD = 100 cm
6 MV 10 MV
BP_IC T_IC BP_IC/T_IC BP_IC T_IC BP_IC/T_IC 2.00 cm 0.6652 0.6723 0.990 0.7332 0.7379 0.994 1.50 cm 0.6719 0.6804 0.988 0.7386 0.7449 0.992 1.25 cm 0.6741 0.6832 0.987 0.7379 0.7469 0.988
Table 7
M(20)/M(10) in water obtained at a fixed source to detector distance of 100 cm for 6 MV
produced by the GE Saturne 43 accelerator using a home-made chamber (SV-PMMA) and a PTW 34070 chamber (BP_IC) with sensitive air cavity diameter of 3 cm and 8.16 cm, respectively.
Field diameter 6 MV–SDD = 100 cm
SV-PMMA BP_IC BP_IC/SV-PMMA 2.00 cm 0.6414 (6) 0.6676 (16) 1.041 1.00 cm 0.6433 (4) 0.6706 (16) 1.042 0.75 cm 0.6442 (6) 0.6767 (19) 1.051
these results indicate that a reference setup and a reference integration area must be defined to obtain a DAPR20,10parameter useful as beam quality specifier. Then, to allow measurement of such beam quality specifier by means of a generic LAC, correction factors are required to convert the M(20)/M(10)measured values to the values 'as they would be' if they were measured, under the same experimental conditions, by a chamber with collecting electrode area equal to the reference area. Different computational or experimental methods can be used for de-termining such correction factors. In this work, a method based on Monte Carlo simulations was applied. Accordingly, for a given ioniza-tion chamber with collecting electrode radius RIC, the correction factor for the small field size fs is defined as
=
[
( )
( )]
k DAP DAP DAP DAP [ (20)/ (10)] 20 / 10 Rfs ,R R R fs R R fs ref IC ref ref IC IC (3)where Rrefis the radius of the reference integration area. Then the value of DAPR20,10to be used as beam quality index is obtained as
= ⎡ ⎣⎢ ⎤ ⎦⎥ DAPR M M k (20) (10) R R fs 20,10 R Rfs ,R IC IC ref ref IC (4) Using the DAP values calculated by Monte Carlo at 20 cm and 10 cm depths as a function of the radius of the integration area, kRfsref,RIC cor-rection factors can be determined for any ionization chamber radius. It should be noted that Eq.(4)is derived under the assumption that the ionization chamber response in terms of DAP does not change with water depth (i.e. MRIC(20)/MRIC(10)=DAPRIC(20)/DAPRIC(10)). Al-though results in section 3.1.1 showed that the sw,air variation with depth is marginal, changes in the chamber response due to perturbation effects cannot be excluded in principle. The agreement between the calculated DAPR20,10and the measured M(20)/M(10)ratios shown in
Fig. 5supports the above assumption for the SV-PMMA chamber. The
assumption was further verified for the BP_IC chamber by Monte Carlo simulation. The ionization chamber was modelled according to the manufacturer’s drawings and the chamber response in terms of DAP was calculated as = r d DAP d DAP d ( ) ( ) ( ) air IC w , (5) where d is the water depth, DAPair,IC(d) is the average absorbed dose in the air cavity integrated over the ionization chamber (IC) active area and DAPw(d) is the integral of Dw, in homogeneous water, over the
cross-sectional area of a water voxel equal to the IC active volume. Circular beams with diameter 2.0 cm and 1.25 cm and square beams with side 1.0 cm and 0.5 cm were considered. Calculation results showed variations below 0.2% in r(d) with depth, thereby supporting the validity of Eq.(4).
Considering that the absolute measurement of DAP at LNE-LNHB refers to an integration area with radius 1.5 cm[25,26]the same area is tentatively assumed in this work as reference for the DAPR20,10Rref
mea-surement. Accordingly, kRfsref,RIC correction factors with Rref= 1.5 cm were determined for the BP_IC and T_IC ionization chambers and ap-plied to the ratios M(20)/M(10) measured in the Varian DHX beams with SDD 100 cm. Differences between DAPR20,10Rref values obtained by the
two ionization chambers do not exceed 0.4%, while differences be-tween the measured M(20)/M(10)values were up to 1.3% (see data in
Table 8andTable 6).
The ratio between the M(20)/M(10) measured with a BP_IC chamber and the SV-PMMA chamber (whose area corresponds to the area chosen as reference) is equal to 1.041 for the Saturne 43 accel-erator (data in table 7 – 6MV, 2 cm field diameter). The equivalent calculated ratio for the Varian DHX beam, obtained from data intables 6 and 8, is very close (1.043) indicating that the correction factor is nearly independent of those linac types and those collimating systems. Using the kRfsref,RICfactor calculated for the Varian beam with diameter of 2 cm, DAPR20,10Rref values obtained by the BP_IC and the SV-PMMA
chambers are in agreement within 0.2%. However, a different rate of
DAPR20,10 change with scoring region radius was found for beams shaped by the linac jaws compared to those shaped by cones (see Section3.1.2). Thus, kRfsref,RIC correction factors should be calculated specifically for each individual collimator system.
0.986 0.988 0.990 0.992 0.994 0.996 0.998 1.000 1.002 1.004 1.006 0.0 0.5 1.0 1.5 2.0 2.5 cal cul at ed DAP R / m easured DAP R beam diameter (cm) PENELOPE/exp EGSnrc/exp
Fig. 5. Ratios of calculated DAPR20,10to measured M(20)/
M(10) for a scoring region corresponding to a disc of 3 cm
diameter. The uncertainties correspond to one standard deviation including the statistical and estimated (0.55%) uncertainties.
Table 8
DAPR20,10Rref values referred to a reference area with diameter 3 cm (Rref= 1.5 cm) obtained
applying Monte Carlo correction factors to the ratio of ionization signals at 20 cm and 10 cm water depths.
Field diameter 6 MV 10 MV
BP_IC T_IC BP_IC/T_IC BP_IC T_IC BP_IC/T_IC 2.00 cm 0.638 0.637 1.001 0.706 0.703 1.004 1.50 cm 0.643 0.641 1.002 0.712 0.710 1.003 1.25 cm 0.642 0.642 1.002 0.710 0.711 0.999
4.2. DAPR20,10as beam quality specifier
Data inTable 8show that the maximum variation in the DAPR20,10Rref
value for the Varian DHX stereotactic beams is below 0.8% and 1% for 6 MV and 10 MV, respectively. Similarly, data inTable 7show that the
DAPR20,10Rref values measured by means of the SV-PMMA chamber in the
GE Saturne 43 6 MV beams with diameters 2 cm, 1 cm and 0.75 cm differ from one another by less than 0.5%. Data summarized inTable 7
andTable 8indicate a tendency of the DAPR20,10Rref value to increase when
the field size decreases, in line with the slight increase of the mean photon energy shown by Monte Carlo simulations. However, the dif-ferences observed among field sizes are not statistically significant, particularly for the data inTable 8obtained applying kRfsref,RICcorrection factors affected by a relative large type B uncertainty. Indeed, according to Eq.(3), kRfsref,RICfactors were determined using ratios of DAP calcu-lated by Monte Carlo for which a type B uncertainty of 0.55% is esti-mated (see Appendix A). A conservative estimate of the type B un-certainty of kRfsref,RIC is therefore set to 0.8% (k = 1). Concerning dosimetric data, results in section3.1.1showed that changes in photon spectra among small fields have negligible effects (around 0.2%) on
sw,airvalue. Moreover, simulations of the BP_IC chamber response in terms of DAP revealed that effects due to the field size are within 0.5%. On the basis of these results, for a given nominal energy, the same beam quality index can be associated to the small beams, for any field dia-meter from 2 cm to 0.75 cm.
The sensitivity of DAPR20,10to the beam energy was demonstrated by Monte Carlo results in section 3.1.2(data inFig. 3). Additionally, data intable 8 indicate a change of about 10% in the experimental
DAPR20,10Rref value from 6 MV to 10 MV beams. Such a change is similar to
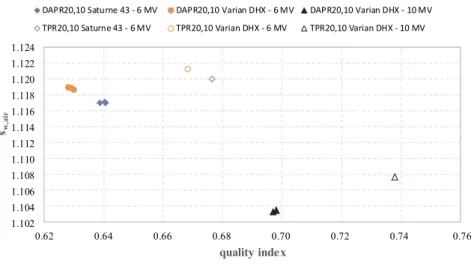
that obtained for the beam quality specifiers currently used for radio-therapy photon beams (i.e. TPR20,10 defined for the 10 cm × 10 cm reference field). This is also shown inFig. 6where the sw,aircalculated for the beams used in this work are reported as a function of both TPR20,10 and DAPR20,10Rref. Thus, given a reference integration area, DAPR20,10determined in SDD setup appears suitable for specifying the photon beam quality for fields with diameter from 2 cm to 0.75 cm, since it combines field size independence with good sensitivity to beam energy. Further investigation would be desirable to extend these results to even smaller beams.
5. Conclusions
Results of this work show that a ratio of DAP that is useful as beam quality specifier for small beams is obtained for the reference condition that combines the SDD setup (SDD = 100 cm) and the integration sur-face with radius Rref= 1.5 cm (DAPR20,10Rref). In beams with diameter
below 2 cm, DAPR20,10Rref is independent of field size and its sensitivity to
the beam energy is similar to that of currently used beam quality spe-cifiers defined for the 10 cm × 10 cm field size (i.e. TPR20,10). Measuring DAPR20,10Rref in small beams can be achieved using large-area
plane-parallel ionization chambers with cross-sectional area larger than the beam size. If the air cavity radius differs from Rref, Monte Carlo correction factors accounting for effects due to the chamber size are required. Specific correction factors should be calculated for any nominal beam energy and collimator system. Since Monte Carlo cal-culations could be problematic at clinical level, an investigation on alternative practical methods for determining the above correction factors is worthwhile.
Conflicts of interest None.
Acknowledgments
This work is supported by the EMRP joint research project MetrExtRT which has received funding from the European Union on the basis of Decision No 912/2009/EC. The EMRP is jointly funded by the EMRP participating countries within EURAMET and the European Union.
The computing resources and the related technical support used for this work at ENEA have been provided by CRESCO/ENEAGRID High Performance Computing infrastructure and its staff [46]. CRESCO/ ENEAGRID High Performance Computing infrastructure is funded by ENEA, the Italian National Agency for New Technologies, Energy and Sustainable Economic Development and by Italian and European re-search programs, see http://www.cresco.enea.it/english for informa-tion.
Appendix A. Accuracy in DAPR calculation
The accuracy of Monte Carlo calculation of absorbed dose in regions extending laterally beyond the edge of the radiation was evaluated by comparing the results of simulations with the PENELOPE and EGSnrc codes, as well as via calculations and measurements of the mean absorbed doses in the core of two graphite calorimeters in small 6 MV beams produced by the GE Saturne 43 accelerator. Specifically a graphite calorimeter (GR11) with a core of 30 mm diameter and 3 mm thickness and a graphite calorimeter (GR10) with a core diameter of 6 mm and 6 mm thickness
1.102 1.104 1.106 1.108 1.110 1.112 1.114 1.116 1.118 1.120 1.122 1.124 0.62 0.64 0.66 0.68 0.70 0.72 0.74 0.76 sw ,ai r quality index
DAPR20,10 Saturne 43 - 6 MV DAPR20,10 Varian DHX - 6 MV DAPR20,10 Varian DHX - 10 MV TPR20,10 Saturne 43 - 6 MV TPR20,10 Varian DHX - 6 MV TPR20,10 Varian DHX - 10 MV
Fig. 6. Water-to-air stopping power ratio as a function of the beam quality index (DAPR20,10Rref or TPR20,10). The
stop-ping power ratios corresponding to DAPR20,10Rref values (filled
symbols) are calculated for the reference area (R = 1.5 cm) while the stopping powers corresponding to TPR20,10values
(unfilled symbol) are calculated for a small volume on the beam axis.
were used[26,47]. The GR11 calorimeter was designed for absolute measurements of DAP in field sizes smaller than 2 cm[26]and the size of the calorimeter core is the result of a compromise between two conflicting options: enlarging it to cover the greatest possible part of the scattered beam and reducing it to increase the measured temperature elevation in the core. On the other hand, the size of the GR10 calorimeter ensures that the core is widely within the field size for the largest circular beam (2 cm diameter) considered in this work. The GR10 and GR11 calorimeters were modelled and irradiations in a graphite phantom were simulated with both PENELOPE and EGSnrc codes.
For the beam with 2 cm diameter, the mean absorbed dose in the core (Dcore) was calculated for both the GR10 and GR11 calorimeters and the ratio Dcore(GR10)/Dcore(GR11) obtained by means of PENELOPE and EGSnrc codes are compared to the measured value inFig. A1. A difference of
0.9% was found between the value calculated using PENELOPE and the measured value with a corresponding type A uncertainty (k = 1) of 0.2%. The corresponding difference was of 1.4% for EGSnrc calculations with a corresponding type A uncertainty (k = 1) of 0.15%. To explain such large differences between calculation and measurement, additional simulations were done to calculate, in a water phantom, the mean absorbed dose in water in a volume υ around the reference point corresponding to the calorimeter core volumes (Dw(υ ≡ core)). The Dw(υ)/Dcoreratios pertaining to the GR11 and GR10 calorimeter cores calculated by PENELOPE and EGSnrc are compared inFig. A2for the beam with diameter of 2 cm. Results obtained by means of the two Monte Carlo codes are in agreement (differences of 0.1% and 0.2% with type A uncertainties (k = 1) of 0.25% and 0.1%, respectively) for the ratios Dw(υ ≡ GR10)/Dcore(GR10) and Dw(υ ≡ GR11)/Dcore(GR11), that is when the scoring region is the same in both water and graphite. For Dw(υ ≡ GR10)/Dcore(GR11) or Dw(υ ≡ GR11)/Dcore(GR10), the differences are much larger, i.e. 0.4% and 0.8% with type A uncertainties (k = 1) of 0.3% and 0.2% respectively.
The above results indicate that Monte Carlo calculation of absorbed dose is more critical outside the beam field (out-scattered part) than inside and that differences between results obtained using different Monte Carlo codes can be significant. However, when the volume of water (υ) for the mean absorbed dose to water corresponds to the volume of the calorimeter core, the two codes are in agreement when calculating Dw(υ ≡ core)/ Dcore. In this case, the increase of correlation in the calculation of the ratios seems to reduce the problem scale, although the related type B
uncertainty should be enlarged (0.55%, k = 1), compared to the value of 0.2% that is typically adopted when the irradiated surface is well inside the beam. When the volumes involved in the dose ratio are really different (as in the case of the GR10 and GR11 calorimeter core volumes), a type B uncertainty of 0.8% (k = 1) should be used. This figure reflects the 1.4% maximum difference observed between measured and calculated dose ratios in terms of standard uncertainty of a rectangular distribution.
References
[1] Benmakhlouf H, Sempau J, Andreo P. Output correction factors for nine small field detectors in 6 MV radiation therapy photon beams: A PENELOPE Monte Carlo study.
Med Phys 2014;41:041711.
[2] Bouchard H, Kamio Y, Palmans H, Seuntjens J, Duane S. Detector dose response in megavoltage small photon beams. I. Theoretical concepts. Med Phys
2015;42:6033–47.
[3] Scott AJD, Kumar S, Nahum AE, Fenwick JD. Characterizing the influence of
Fig. A1. Left hand side, representation of the core diameters for the GR11 and GR10 calorimeters (yellow circles) in a 2 cm diameter beam (measured with EBT3 films) and right hand side, Dcore(GR10)/Dcore(GR11) ratios measured and
calculated with EGSnrc and PENELOPE (error bars are type A uncertainties at one standard deviation).
Fig. A2. (Dw(υ)/Dcore)PENELOPE/ (Dw(υ)/Dcore)EGSnrcfor cores and volumes of water υ corresponding to the GR10 and GR11 calorimeter cores (error bars are type A uncertainties at one
detector density on dosimeter response in non-equilibrium small photon fields. Phys Med Biol 2012;57:4461–76.
[4] Alfonso R, Andreo P, Capote R, Saiful Huq M, Kilby W, Kjäll P, et al. A new form-alism for reference dosimetry of small and nonstandard fields. Med Phys 2008;35:5179–86.
[5] Azangwe G, Grochowska P, Georg D, Izewska J, Hopfgartner J, Lechner W, et al. Detector to detector corrections: a comprehensive experimental study of detector specific correction factors for beam output measurement for small radiotherapy beams. Med Phys 2014;41:072103.
[6] Czarnecki D, Zink K. Monte Carlo calculated correction factors for diodes and ion chambers in small photon fields. Phys Med Biol 2013;58:2431–44.
[7] Francescon P, Kilby W, Noll JM, Masi L, Satariano N, Russo S. Monte Carlo simu-lated corrections for beam commissioning measurements with circular and MLC shaped fields on the CyberKnife M6 System: a study including diode, microchamber, point scintillator, and synthetic microdiamond detectors. Phys Med Biol 2017;62:1076–95.
[8] Lechner W, Palmans H, Sölkner L, Grochowska P, Georg D. Detector comparison for small field output factor measurements in flattening filter free photon beams. Radiother Oncol 2013;109:356–60.
[9] Masi L, Russo S, Francescon P, Doro R, Frassanito MC, Fumagalli ML, et al. CyberKnife beam output factor measurements: a multi-site and multidetector study. Phys Med 2016;32:1647–9.
[10] O’Brien DJ, León-Vintró L, McClean B. Small field detector correction factors for silicon-diode and diamond detectors with circular 6 MV fields derived using both empirical and numerical methods. Med Phys 2016;43:411–23.
[11] Papaconstadopoulos P, Tessier F, Seuntjens J. On the correction, perturbation and modification of small field detectors in relative dosimetry. Phys Med Biol 2014;59:5937–52.
[12] Ralston A, Tyler M, Liu P, McKenzie D, Suchowerska N. Over-response of synthetic microDiamond detectors in small radiation fields. Phys Med Biol 2014;59:5873–81. [13] Underwood TSA, Rowland BC, Ferrand R, Vieillevigne L. Application of the Exradin W1 scintillator to determine Ediode 60017 and microDiamond 60019 correction factors for relative dosimetry within small MV and FFF fields. Phys Med Biol 2015;60:6669–83.
[14] Huet C, Moignier C, Barraux V, Loiseau C, Sebe-Mercier K, Batalla A, et al. Study of commercial detector responses in non-equilibrium small photon fields of a 1000 MU/min CyberKnife system. Phys Med 2016;32:818–25.
[15] Andreo P, Palmans H, Marteinsdóttir M, Benmakhlouf H, Carlsson-Tedgren Å. On the Monte Carlo simulation of small-field micro-diamond detectors for megavoltage photon dosimetry. Phys Med Biol 2016;61:L1–10.
[16] Marinelli M, Prestopino G, Verona C, Verona-Rinati G. Experimental determination of the PTW 60019 microDiamond dosimeter active area and volume. Med Phys 2016;43:5205.
[17] Charles PH, Cranmer-Sargison G, Thwaites DI, Crowe SB, Kairn T, Knight RT, et al. A practical and theoretical definition of very small field size for radiotherapy output factor measurements. Med Phys 2014;41:041707–41708.
[18] International Atomic Energy Agency. Dosimetry in diagnostic radiology: an International Code of Practice; IAEA Technical Report Series. Vol. 457. Vienna: IAEA; 2007.
[19] Djouguela A, Harder D, Kollhoff R, Ruhmann A, Willborn KC, Poppe B. The dose-area product, a new parameter for the dosimetry of narrow photon beams. Z Med Phys 2006;16:217–27.
[20] Duane S, Graber F, Thomas RAS. International Symposium on Standards, Applications and Quality Assurance in Medical Radiation Dosimetry; Application of Dose Area Product and DAP Ratio to Dosimetry in IMRT and Small Field External Beam Radiotherapy. IAEA-CN-182 Paper No 222. Vienna: IAEA; 2010. [21] Le Roy M, Dufreneix S, Daures J, Delaunay F, Gouriou J, Ostrowsky A, et al.
Establishment of dosimetric references in terms of dose-area product for small sizes MV X-ray beams. Phys Med 2015;31(S2):e52–3.
[22] Sánchez-Doblado F, Hartmann GH, Pena J, Roselló JV, Russiello G, Gonzales-Castaño DM. A new method for output factor determination in MLC shaped narrow beams. Phys Med 2007;23:58–66.
[23] Pimpinella M, De Coste V, Guerra AS, Silvi L, Petrucci A, Barile S. Measurements of Dose.area-product ratio in small radiotherapy photon beams using two types of large-area plane-parallel ionization chambers. Phys Med 2015;31(s2):e53. [24] Underwood TSA, Winter HC, Hill MA, Fenwick JD. Detector density and small field
dosimetry: integral versus point dose measurement schemes. 2013;40.
082102-1-15.
[25] Dufreneix S, Ostrowsky A, Le Roy M, Sommier L, Gouriou J, Delaunay F, et al. Using a dose-area product for absolute measurements in small fields: a feasibility study. Phys Med Biol 2016;61:650–62.
[26] Dufreneix S, Bordy J M, Daures J, Delaunay F and Ostrowsky A. Construction of a large graphite calorimeter for measurements in small fields used in radiotherapy. 16th International Congress of Metrology; 2013; 05006 doi:http://dx.doi.org/10. 1051/metrology/201305006.
[27] Andreo P, Burns DT, Hohlfeld K, Huq MS, Kanai T, Laitano F. Absorbed dose de-termination in external beam radiotherapy: an international code of practice for dosimetry based on standards of absorbed dose to water. IAEA Technical Report Series No 398. Vienna, Austria: International Atomic Energy Agency; 2000. [28] Rogers DWO, Faddegon BA, Ding GX, Ma C-M, We J, Mackie TR. BEAM: a Monte
Carlo code to simulate radiotherapy treatment units. Med Phys 1995;22:503–4. [29] Kawrakow I, Mainegra-Hing E, Rogers DWO, Tessier F, Walter BRB. The EGSnrc
Code System: Monte Carlo simulation of electron and photon transport; NRC Report No. PIRS-701. Ottawa, Canada: National Research Council of Canada (NRC); 2013. [30] Francescon P, Cora S, Cavedon C. Total scatter factors of small beams: a
multi-detector and Monte Carlo study. Med Phys 2008;35:504–13.
[31] Ma C-M, Rogers DWO. BEAMDP as a General-Purpose Utility; NRC Report PIRS-0509(E) revA. Ottawa, Canada: National Research Council of Canada (NRC); 2013. [32] Rogers DWO, Walter B, Kawrakow I. BEAMnrc user manual. NRC Report
PIRS-509(A) revL. Ottawa, Canada: National Research Council of Canada (NRC); 2013. [33] Kawrakow I, Rogers DWO, Walter BRB. Large efficiency improvements in BEAMnrc
using directional bremsstrahlung splitting. Med Phys 2004;31:2883–98. [34] Rogers DWO, Kawrakow I, Seuntjens JP, Walter BRB. NRCC user codes for EGSnrc.
NRC Report PIRS-702. Ottawa, Canada: National Research Council of Canada (NRC); 2013.
[35] Salvat F, Fernandez-Varea JM, Sempau J. A code system for Monte Carlo Simulation of Electron and Photon Transport; Workshop Proc 2006. Barcelona, Spain: Nuclear Energy Agency; 2006.
[36] Tola F, Poumarede B, Habib B and Gmar M. Optimization of Monte Carlo codes PENELOPE 2006 and PENFAST by parallelization and reduction variance im-plementation; Second European Workshop on Monte Carlo Treatment Planning. Cardiff, October 19–21 2009, Workshop MCTP; 2009.
[37] Constantin M, Perl J, LoSasso T, Salop A, Whittum D, Narula A, et al. Modeling the truebeam linac using a CAD to Geant4 geometry implementation: dose and IAEA-compliant phase space calculations. Med Phys 2011;38:4018–24.
[38] Dufreneix S. Etablissement de références dosimétriques dans les faisceaux de ra-yons × de hautes énergies et de très petites sections (< 1 cm2) pour la
radiothérapie. Physique Médicale [physics.med-ph]. Université Paris Sud – Paris XI, 2014. Français. < NNT: 2014PA112416 > . < tel-01127240 >https://tel. archives-ouvertes.fr/tel-01127240.
[39] Boag JW. Ionization chambers. In: Kase KR, Bjanrngard BE, Attix FH, editors. The dosimetry of ionizing radiation. Vol. 2. New York: Academic press; 1987. p. 169–243.
[40] JCGM 2008 Evaluation of measurement data - Guide to the expression of un-certainty in measurement JCGM; 2008: 1–134.
[41] Eklund K, Ahnesjӧ A. Fast modelling of spectra and stopping power ratio using differentiated fluence pencil kernels. Phys Med Biol 2008;52:4231–47. [42] Araki F. Monte Carlo study of a CyberKnife stereotactic radiosurgery system. Med
Phys 2006;33:2955–63.
[43] Sánchez-Doblado F, Andreo P, Capote R, Leal A, Perucha M, Arráns R, et al. Ionization chamber dosimetry of small photon fields: a Monte Carlo study on stopping-power ratios for radiosurgery and IMRT beams. Phys Med Biol 2003;48:2081–99.
[44] Verhaegen F, Das IJ, Palmans H. Monte Carlo dosimetry study of a 6 MV stereotactic radiosurgery unit. Phys Med Biol 1998;43:2755–68.
[45] Andreo P, Brahme A. Stopping power data for high-energy photon beams. Phys Med Biol 1986;31:839–58.
[46] Ponti G, et al. The role of medium size facilities in the HPC ecosystem: the case of the new CRESCO4 cluster integrated in the ENEAGRID infrastructure; Proceedings of the International Conference on High Performance Computing and Simulation (HPCS); 2014. art. no. 6903807:1030–33.
[47] Daures J, Ostrowsky A, Rapp B. Small section graphite calorimeter (GR-10) at LNE-LNHB for measurements in small beams for IMRT. Metrologia 2012;49:S174–8.


![[PDF] Cours generale pour debuter la programmation avec le langage C | Cours langage c](data:image/gif;base64,R0lGODlhAQABAIAAAP///wAAACH5BAEAAAAALAAAAAABAAEAAAICRAEAOw==)