HAL Id: hal-02987622
https://hal.archives-ouvertes.fr/hal-02987622
Submitted on 4 Nov 2020
HAL is a multi-disciplinary open access
archive for the deposit and dissemination of sci-entific research documents, whether they are pub-lished or not. The documents may come from teaching and research institutions in France or abroad, or from public or private research centers.
L’archive ouverte pluridisciplinaire HAL, est destinée au dépôt et à la diffusion de documents scientifiques de niveau recherche, publiés ou non, émanant des établissements d’enseignement et de recherche français ou étrangers, des laboratoires publics ou privés.
Kinetic and gas-phase study of the chemical vapor
deposition of silicon carbide from C2H3SiCl3/H2
A. Desenfant, G. Laduye, G.L. Vignoles, Georges Chollon
To cite this version:
A. Desenfant, G. Laduye, G.L. Vignoles, Georges Chollon. Kinetic and gas-phase study of the chem-ical vapor deposition of silicon carbide from C2H3SiCl3/H2. Journal of Industrial and Engineering Chemistry, Elsevier, 2021, 94, pp.145-158. �10.1016/j.jiec.2020.10.029�. �hal-02987622�
Kinetic and gas-phase study of the chemical vapor deposition of silicon carbide from C2H3SiCl3/H2
A. Desenfant1, G. Laduye2, G. L. Vignoles1, G. Chollon1*
1 Laboratoire des Composites Thermostructuraux, CNRS, Safran, CEA, University of Bordeaux, 3, Allée La Boétie, 33600 Pessac, France
2 Innovation Campus Paris, Air Liquide, 781350 Les Loges en Josas, France * Corresponding author : chollon@lcts.u-bordeaux.fr
Keywords: Chemical vapor deposition; Vinyltrichlorosilane; Silicon carbide; Deposition kinetics; FTIR Spectroscopy; Gas phase analysis
Abstract: The chemical vapor deposition (CVD) of silicon carbide from vinyltrichlorosilane
(VTS) was studied to identify a range of conditions leading to pure crystalline SiC. The deposition rate was recorded to evidence the various deposition regimes. Gas phase, elemental analyses and infiltration tests were also performed. Three distinct chemical reaction regimes were identified. In CVD conditions, carbon is co-deposited at low temperature while VTS is only partially decomposed. In infiltration conditions, the composition switches to pure SiC inside the porous substrate because of a depletion of reactive hydrocarbon species. Competing heterogeneous reactions are responsible for a hysteresis versus temperature, in both deposition rate and composition of the deposit. The high temperature domain is the most suitable to deposit pure crystalline SiC in CVD conditions. Hydrogen dilution strongly accelerates the homogeneous decomposition of VTS as compared to argon. Assumptions on the reaction mechanism were proposed describing the chemistry of this precursor.
1. Introduction
SiC/SiC composites are of great interest for use in aircraft engines and nuclear reactors. Their low density and high strength at high temperature make them good candidates to replace metallic alloys for such applications [1,2]. Chemical vapor infiltration (CVI) is often used to manufacture the
silicon carbide matrix, since it enables the deposition of pure SiC inside the fibrous substrate [3]. The most used precursor for the chemical vapor infiltration (CVI) of SiC is methyltrichlorosilane (MTS, CH3SiCl3) diluted in hydrogen. This process often leads to some silicon excess at low temperature and low gas residence time [4,5], leading to a decrease of the lifetime of the final material [6]. Previous works from the literature mentioned that both the high reactivity of chlorosilanes and the low reactivity of hydrocarbons formed in the gas phase at low temperature could explain the low carbon content in the deposit [4,7–10]. Some authors have proposed to add HCl in order to promote silicon etching [17,11–13]. Others suggested to supply additional hydrocarbons, such as CH4 [14], C3H8 [15], C2H2 [16] or C2H4 [17] in the MTS/H2 mixtures, to counterbalance the silicon excess and enable pure SiC deposition. Another solution could be to use a single-source precursor with a higher carbon content, for instance C2H5SiCl3 [18–21], (CH3)2SiCl2 [22–28], (CH3)3SiCl or (CH3)4Si [27], to form pure SiC. The latter solution was chosen in the present work, by studying the feasibility of using an original molecule: vinyltrichlorosilane (VTS), C2H3SiCl3, as a precursor of pure SiC deposit in both CVD and CVI conditions. Unsaturated hydrocarbons are indeed likely to form from the vinyl group in the early stages of the VTS decomposition. The high heterogeneous reactivity of these species should favor carbon deposition and thus the formation of pure SiC.
The second important aspect of this work is to improve the SiC infiltration capacity into porous substrates. Regarding the MTS/H2 system, Papasouliotis et al. noticed that the deposition rate and SiC mole fraction strongly depend on the distance of the substrate from the beginning of the hot zone, probably due to an increasing HCl content [9]. As a result, they estimated that it is necessary to increase the residence time to achieve uniform infiltration of SiC in a porous preform with this precursor. Zhang and Hüttinger have observed the same phenomenon with the deposition rate and Si co-deposition depending on the position of the substrate in the reactor [5]. They also studied the influence of the substrate surface area/reactor volume (As/Vr) ratio, by using three different substrates, and noticed that more free Si was co-deposited when As/Vr was decreased. According to these authors, this effect could be due to the formation of heavier chlorosilane and carbochlorosilane species at low As/Vr ratio [5,29]. It could be responsible for a non-homogeneous composition of the solid deposited by CVI in porous substrates.
The aim of the present study is to consider VTS as a potential precursor for the CVI of pure and crystalline SiC coatings with a high thickness uniformity. The influence of the CVD parameters
has been examined through a kinetic study of the deposition rate, chemical and structural analysis of the solid deposit and infrared spectroscopy investigations of the gas-phase. Correlations between the various experimental results and data from the literature allowed proposing a basic homogeneous / heterogeneous reaction mechanism for the CVD of SiC from VTS. Finally, the CVI capability of this precursor has been studied through model pore infiltration [30].
2. Experimental procedure
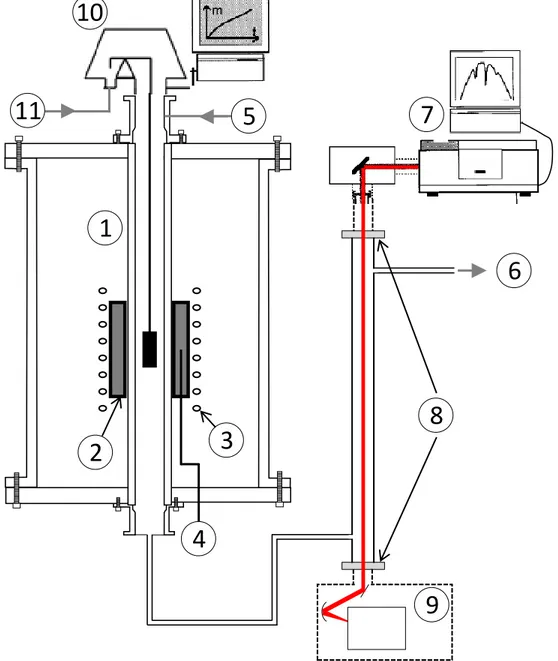
Vinyltrichlorosilane (Sigma Aldrich, 97 %) is liquid at ambient pressure and temperature (boiling temperature: 90 °C). It was injected in a vertical hot-wall CVD reactor (presented in Fig. 1) by a bubbling system with a dew point column in order to regulate the flow rate. The diluent gases (H2 or Ar, ≥ 99.9999 %, from Air Liquide) and the precursor flowed through a vertical silica tube (700 mm long and 34 mm inside diameter) heated by a graphite susceptor (130 mm long and 55 mm inside diameter) coupled to a radio-frequency inductive coil.
The reactor pressure P was fixed using a motorized valve and a Baratron® pressure gauge (both from MKS). The temperature in the reactor was monitored by a K type thermocouple inserted in the susceptor wall. The deposition temperature T of the substrate and the isothermal hot-zone (50 mm long, at ±5 °C) were determined by recording thermal profiles prior to the CVD and CVI experiments with another thermocouple moving along the reactor axis (examples temperature profiles are given in reference [30]).
The reactor was connected to a high-sensitivity microbalance (B Setsys from Setaram, sensitivity ±1 g) to which the specimen was hung allowing the in situ acquisition of the weight gain. The substrates used consisted in dense graphite (2318 PT from Mersen) cylindrical pins, 1 cm in height and diameter, with an outer surface of 4.71 cm-2. The deposition rate R, in mg.min-1.cm-2, was calculated by dividing the weight gain by the geometrical substrate surface. The open pores of the substrates were filled by a few microns-thick SiC coating to get a constant surface area before each run for reproducible measurements of R. Repeatability tests were carried out for every CVD condition tested. Several layers of CVD-SiC coating were deposited on the same substrate during the same run, by cutting off the reactant gas supply between each condition and modifying the temperature (500 – 1150 °C), pressure (2 – 10 kPa), the set point for the VTS (QVTS = 5 – 30 standard cubic centimeters per minute, or sccm) or diluent gas flow rate (either hydrogen or argon,
QH2/Ar = 100 – 500 sccm), and by letting the reactant gases flow again. The state of equilibrium of the temperature, pressure and H2 flow was carefully monitored in situ with the microbalance before introducing the reactant gases (the microbalance is extremely sensitive to any variation of T, P or gas flow).
A Fourier transform infrared (FTIR) spectrometer (IS50 from ThermoScientific) was also coupled to the CVD reactor at the outlet for ex situ gas-phase analysis. 32 scans with a 0.5 cm-1 resolution were recorded for each spectrum. The background was recorded prior to the gas analysis for each temperature condition but under a pure H2 flow to calculate the absorbance spectra. Repeatability tests were also carried out for every condition to confirm the occurrence of a steady-state regime. Quantitative concentration measurements were carried out by calibration using pure gases, when available, at various partial pressures.
The microstructure of the deposited films was examined using a scanning electron microscope (SEM, Quanta-400 FEG from FEI) equipped with an energy-dispersive X-ray spectroscopy (EDS) analysis module.
The structural organization of the SiC phase and the presence of secondary phases (free silicon or free carbon) was assessed by Raman microspectroscopy (Labram HR from Horiba Jobin-Yvon) (λ = 632.8 nm, spectral resolution ≈ 2 cm−1, lateral resolution ≈ 1 μm) and X-ray diffraction (XRD, D5000 from Siemens, λCu–Kα = 0.1542 nm, functioning in the θ–2θ configuration).
The elemental composition of the coatings was controlled by electron probe micro-analysis (EPMA, SX 100 from CAMECA, source:15 kV, 20 nA). The Si and O weight concentrations were quantified with respectively LPET and PC1 crystals and the C concentration calculated by difference (SiC and SiO2 were used as standards).
3. Results
3.1. Influence of the temperature
In a first experiment, the deposition temperature T was varied from 600 to 1150 °C, the total pressure P was set at 2 kPa, the total flow-rate Qtot at 150 sccm and the dilution ratio = QH2/QVTS at 13. The Arrhenius plot of the deposition rate R is given in Fig. 2a. The partial pressures of the various gas species detected in parallel by FTIR at the outlet of the reactor are presented versus
temperature in Fig. 2b. The deposition rate remains low (< 2.10-3 mg.min-1.cm-2) when increasing temperature from 925 to 975 °C. R increases with T with an apparent activation energy of approximately 250 kJ.mol-1. The EDS and Raman analyses (Fig. 3a) performed on a coating deposited at 950 °C in steady-state conditions showed that the deposit consists mainly of carbon and only small amounts of silicon (≈ 5 at. %) and chlorine (≈ 0.8 at. %). High resolution TEM analyses only reveal short and distorted carbon 002 lattice fringes, with some degree of anisotropy, similarly as in a highly disordered pyrolytic carbon (Fig. 3b) [31]. Traces of oxygen were also detected (≤ 2 at. %), which may be due to oxygen or moisture adsorption during exposure to ambient air after deposition, possibly in relation with the presence of residual chlorine. The FTIR measurements at the reactor outlet show that VTS is scarcely decomposed at these temperatures, to form SiHCl3, C2H4 and a small amount of C2H2. Traces of SiH2Cl2 were also detected but could not be quantified (the pure species could not be analyzed so the molar absorption coefficient could not be determined).
A further increase of temperature from 975 to 1000 °C leads to an abrupt rise of R of more than one order of magnitude. Within this temperature domain, the deposit composition suddenly turns from nearly pure carbon to pure SiC (Figs. 4 and 5), indicating an important change in the heterogeneous reaction scheme. Simultaneously, a maximum of the SiHCl3 concentration is observed at the reactor outlet approaching 1000 °C, while the ethylene concentration strongly increases.
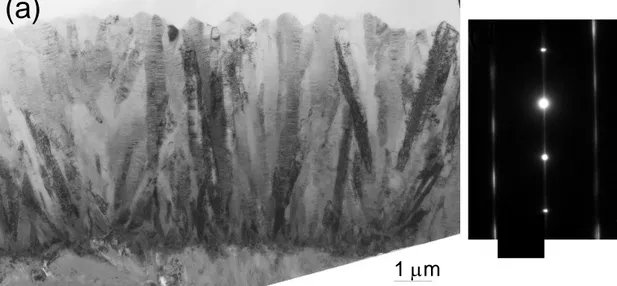
Between 1000 and 1100 °C, the deposition rate remains high and the apparent activation energy, of the order of 200 kJ.mol-1, slightly decreases with increasing temperature. The solid deposited consists of pure polycrystalline -SiC (Figs. 4 and 5), with a crystallinity gradually improving with T (Fig. 4). The coating obtained at T = 1100 °C displays columnar grains having 111 axes oriented mainly along the growth direction and containing stacking faults (Fig. 6). The outlet ethylene and SiCl4 concentrations reach a maximum, while the SiHCl3 content exhibits a constant decrease. The very low VTS concentration detected downstream of the hot zone reveals that the precursor is almost totally decomposed.
For temperatures above 1100 °C, the apparent activation energy becomes very low (it can be estimated below 50 kJ.mol-1). Between 1100 and 1150 °C, the elemental and Raman analyses show that free carbon is incorporated in the deposit in proportions increasing with temperature (Fig. 4).
In the gas phase at the reactor outlet, the increase of temperature above 1100 °C results in a decrease of the concentrations of C2H4 and SiCl4, while the concentration of acetylene increases. During the decrease of the temperature from 1150 °C back to 950 °C, the deposition rate follows the same Arrhenius law as observed during temperature increase. No hysteresis of R with temperature was evidenced in these conditions.
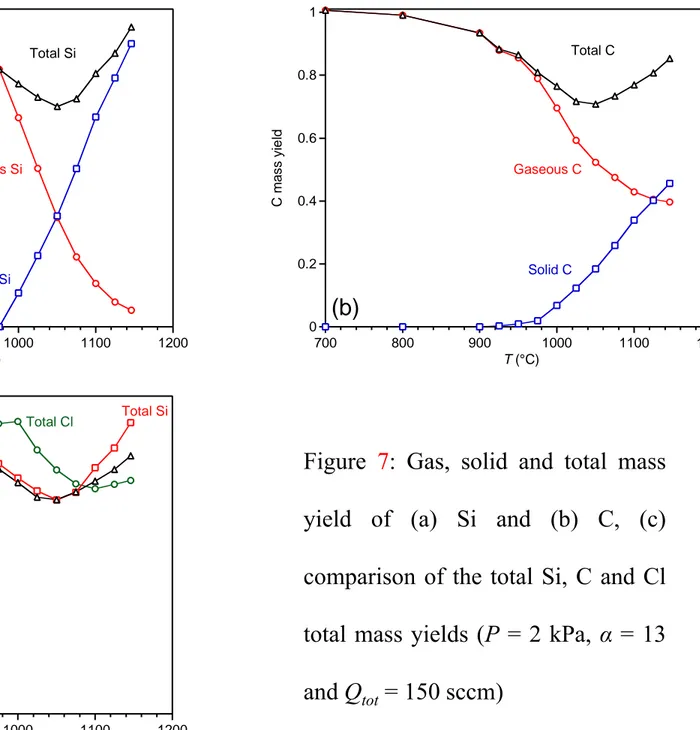
The gas, solid and total mass yields of the carbon, silicon and chlorine elements were calculated respectively from the FTIR analyses at the reactor outlet, the temperature dependence of both the deposition rate and the composition of the deposit on the substrate and reactor walls (at P = 2 kPa, α = 13 and Qtot = 150 sccm, see Fig. 7). The contribution of SiH2Cl2 was not considered since this species was not quantified (see above). To simplify, the influence of the residence time on R along the temperature profile outside of the hot zone was also neglected (R was supposed to depend only on T on both sides of the hot zone). This assumption is valid in case of a surface reaction limitation (or chemical reaction regime: CRR) but not in a mass transfer regime (MTR). The deposition downstream on the cooler parts of the reactor was not considered. As expected, when T increases, the amounts of Si and C in the gas phase both decrease while those in the solid both increase (Fig. 7a,b). An elemental deficit in the total mass yield appears from 925 °C and reaches a maximum at 1050 °C for Si and C and 1100 °C for Cl (Fig. 7c). Such a discrepancy in the mass yields could be related to the failure to consider some gaseous species (e.g. SiH2Cl2). It can be more likely attributed to the deposition of heavy species on the cold parts of the reactor [5]. Indeed, after several experiments, the replacement of the reactor tube revealed the presence of a brown solid, possibly similar to that collected by Cagliostro et al. during their CVD study from (CH3)2SiCl2/Ar mixtures [23]. The FTIR analysis evidenced that this compound originally contained Si–Cl and Si– H bonds that readily reacted with ambient air to form Si–O–Si bonds. The resulting white powder was found by EDS to be composed of about 40 at. % of C, 25 at. % of Si and 33 at. % of oxygen (a strong luminescence prevented any phase analysis by Raman spectroscopy). The solid Si and C mass yields reach up to 90 % and 46 % respectively at 1050 °C (P = 2 kPa, α = 13 and Qtot = 150 sccm, Fig. 7a,b). This result indicates that the high depletion of the precursors at the reactor outlet and probably also in the hot zone is a direct consequence of heterogeneous reactions occurring at high temperatures.
3.2. Influence of the total pressure
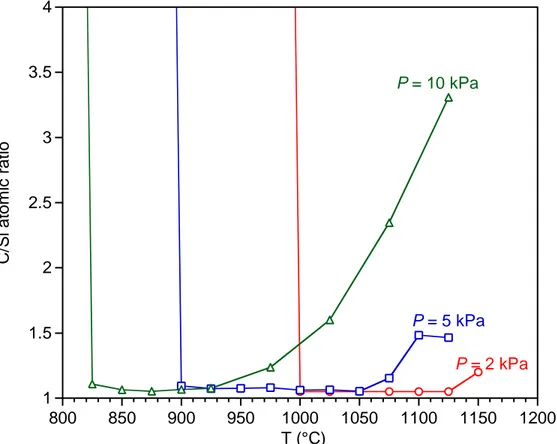
In addition to the previous run at 2 kPa, two additional experiments were conducted to follow the thermal behavior of the deposition rate and the gas phase at 5 and 10 kPa (Figs. 8 and 9). The total flow rate and the dilution ratio were both kept constant to assess the influence of the total pressure on the deposition of SiC from VTS-H2. The increase of the initial partial pressure of VTS (resulting from the rise of the total pressure) leads to a shift of the Arrhenius plot towards lower temperatures (for clarity, the three Arrhenius curves are compared on the same plot in Fig. SI1 in the Supplementary Information). Except this temperature shift, the overall curve shape, the apparent activation energies of the different regimes and the evolution of both the gas phase and the composition of the deposit are similar at 5 kPa to those observed at 2 kPa (Figs. 2,5,8,SI1). A similar behavior was observed for the CVD of SiC from MTS/H2 mixtures [32].
In contrast with the 2 kPa experiment, a hysteresis phenomenon was observed in the Arrhenius plots of the deposition rate at 5 and 10 kPa. In the low-temperature part of the curve, the R value at a given temperature was found lower (respectively higher) when the deposition temperature was increasing (respectively decreasing), as shown in Figs 8a and 9a. A hysteresis phenomenon was also observed in the change of the deposit composition. Pure silicon carbide was formed along the high deposition rate branch of the Arrhenius plot (i.e. upon cooling), whereas a carbon-rich coating was deposited along the low R branch (on heating). The hysteresis was also observed at 2 kPa, but for a dilution ratio of 20 instead of 13 (see Fig. SI2 in Supplementary Information). On the other hand, for the various pressures and dilution ratios, no significant change was observed in the composition of the gas phase for the two hysteresis branches in the Arrhenius plots.
At 10 kPa, the kinetic behavior is significantly different from that observed at 2 and 5 kPa. An intermediate linear domain appears in the Arrhenius plot in the range T = 800 – 900 °C (Fig. 9a), between the low temperature (with hysteresis) and high temperature domains. The related apparent activation energy is significantly higher (250 kJ.mol-1) than that measured in the high temperature domain of the Arrhenius plots at 2 kPa (T > 1000 °C), 5 kPa (T > 950 °C) and 10 kPa (T > 900 °C). This specific kinetic regime suggests that conditions combining high pressures and intermediate temperatures may induce some changes in the reaction mechanism or at least in the limiting step of the deposition process. In this intermediate T domain, the C2H4 and SiCl4 outlet concentrations both increase with T, while the SiHCl3 concentration starts to decrease (Fig. 9b)
and the solid deposited consists of pure SiC (Fig. 5). The C2H4 and SiCl4 concentrations then decrease when T further increases, in the high temperature domain (900 < T < 1125 °C). The C2H2 concentration significantly increases in parallel, while a large carbon excess appears in the solid.
3.3. Influence of the total flow rate
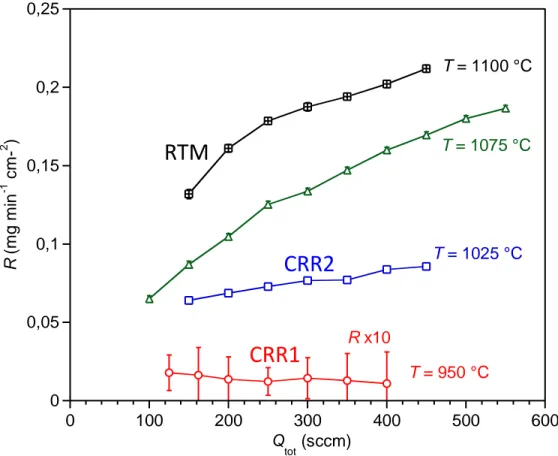
At a pressure of 2 kPa, the increase of the total flow rate (Qtot) leads to different behaviors of the
deposition rate depending on the temperature (Fig. 10). For T = 1075 °C or T = 1100 °C, R strongly increases with Qtot over the entire range tested. This behavior is characteristic of a mass transfer
limitation, as already suggested by the very low thermal activation on the Arrhenius plot (Fig. 2a, see section 3.1). The deposition rate tends to be less influenced by the total flow rate at 1025 °C, indicating a mixed limitation by both surface reactions and diffusion.
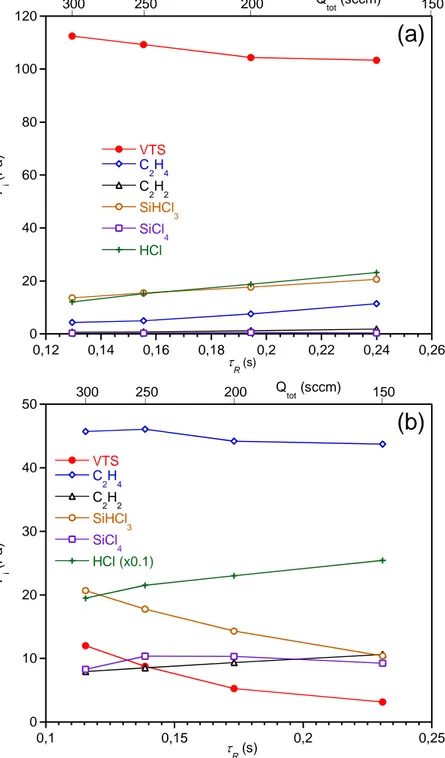
Fig. 11a displays the change in the gas phase composition at the reactor outlet as a function of the residence time R (as calculated from the total flow rate Qtot) at P = 2 kPa, = 13, and T = 950 °C.
Although the effect is less pronounced, a parallel can be drawn with the gas phase changes observed when increasing the temperature of the hot zone (Fig. 2b). VTS gets slightly more decomposed as R increases (or Qtot decreases), resulting in slightly more products at the reactor outlet.
The effect of R on VTS decomposition is still effective at 1100 °C, while VTS is much more
decomposed and the gas products much more abundant than at 950 °C (Fig. 11b). On the other hand, the partial pressures of SiHCl3 and C2H4 now decrease when R increases, also as expected
from the parallel with the temperature effect shown in Fig. 2b. The influence of R on the deposition
rate at 1100 °C is completely different from that at 950 °C. The surface reaction kinetics being highly activated by the concentration of reactive intermediates and most of all by temperature, the deposition rate is essentially limited by mass transfer, as suggested by the strong increase of R with
R (see Fig. 10).
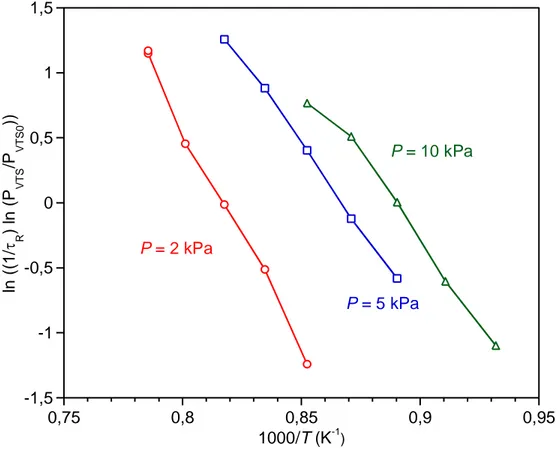
The apparent kinetic constant k for the homogeneous decomposition of VTS was calculated from the changes of the VTS partial pressure (PVTS) versus R using the following equation:
a VTS R VTS k P d P d
) ( (1)where a is the partial order of reaction. The best fit of the experimental P(R) data was obtained
for a = 1 (Fig. SI3), suggesting a unimolecular decomposition of VTS (as for MTS). k obeys an Arrhenius law (where Ea is the apparent activation energy):
RT Ea e A T k( ) / (2)
By integration of equation (1), with a = 1 and PVTS0 the initial VTS partial pressure, then comes:
) ln( 1 ) ( 0 VTS VTS R P P T k (3) and finally: RT E A P P a VTS VTS R ln( )) ln( ) 1 ln( 0 (4)
The apparent activation energy Ea of the kinetic constant k can then be obtained from the slope
obtained after plotting the left side of equation (4) against 1/T.
The apparent activation energy of VTS decomposition for 2 ≤ P ≤ 10 kPa is about Ea = 280 ± 10
kJ.mol-1 for P = 2 kPa and 250 ± 50 kJ.mol-1 for P = 5 and 10 kPa (Fig. 12).
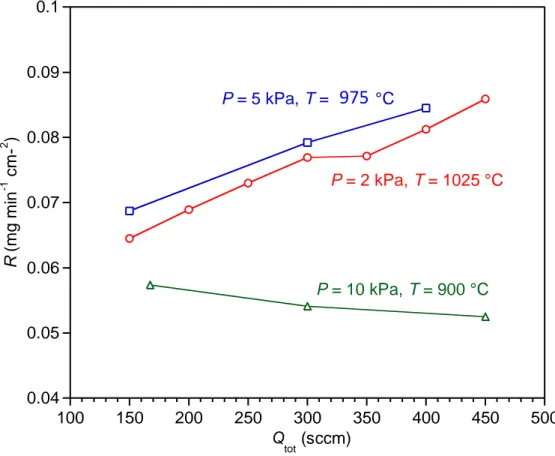
Finally, the study of the influence of the total flow rate was completed by comparing different couples of (P; T) conditions leading to pure SiC coatings with relatively high and similar deposition rates (Figs. 2,5,8, 9, SI1): 2 kPa – 1025 °C (already examined above, see Fig. 10), 5 kPa – 975 °C and 10 kPa – 900 °C (Fig. 13). R increases slightly with Qtot for the first two conditions, characterizing a limitation by both diffusion and surface reactions. The 10 kPa – 900 °C condition leads to a slightly negative slope of R vs. Qtot, which is related to a chemical reaction regime that is little affected by homogeneous reactions. This condition lies in the high temperature region of the intermediate linear domain, which has been identified in the Arrhenius plot (T = 800 – 900 °C) (Fig. 9a, see section 3.2.).
3.4. Influence of VTS dilution
The influence of dilution in H2 on the deposition kinetics and the decomposition of VTS was investigated at P = 2 kPa. In a first step, the influences of the temperature on the deposition rate and the VTS decomposition ratio (1 - PVTS/PVTS,0) at different dilution ratios ( = 10, 20 and 30)
were compared. The increase of the dilution in H2 (i.e. of ) results in a shift to a lower temperature and a more progressive transition between the low and high temperature kinetic regimes (Fig. 14). The apparent activation energy of the low temperature kinetic regime is also lower, suggesting a change in the deposition mechanism, and the deposition rate in the high temperature regime(s) is also lower. The increase of simultaneously leads to an increase of VTS decomposition at a given temperature (Fig. 15).
To better dissociate their respective role, the VTS and H2 apparent partial orders were evaluated at
T = 975 °C and 1000 °C, i.e. respectively in the low temperature and high temperature kinetic regimes (Fig. 2a). The initial partial pressures of both VTS and H2 (PH20) were modified independently (at a constant total flow rate of Qtot = 205 sccm) and their respective influences on
the deposition rate and the composition of the gas phase were examined. At T = 975°C, R does not vary significantly with PVTS0 between 0.1 kPa and 0.2 kPa (Fig. 16a). The FTIR analysis shows that VTS is simultaneously less decomposed (Fig. 16b). These results are both consistent with those obtained in the study of the influence of (Figs. 14 and 15). On the other hand, the increase of PH20 has no effect on R over the whole range of partial pressure tested (Fig. 17a), while a higher decomposition of VTS (Fig. 17b) and an increase of the concentration of hydrogen chloride, ethylene and trichlorosilane are detected simultaneously [30]. A similar influence of PH20 was observed on the decomposition of MTS [33]. At 1000 °C, in the high temperature regime, the apparent VTS partial order is approximately equal to 2 for PVTS0 = 0.05 – 0.1 kPa (Fig. 16a). It gradually decreases as PVTS0 increases, down to a negative value at high partial pressures. Unlike at 975 °C, the H2 partial order remains constant and equal to 1.2 at 1000 °C (Fig. 17a). On the other hand, as at 975 °C, the decomposition of VTS is limited (respectively promoted) by the raise of PVTS (respectively PH20, Figs. 16b and 17b). No change in the chemical composition of the solid was detected while varying PVTS0 and PH20 in the above partial orders study: the coating is respectively free carbon-rich and stoichiometric at 975 and 1000°C.
The influence of the nature of the diluent gas was finally evaluated by comparing the deposition kinetics and the decomposition behavior of VTS, when diluted in pure H2 or pure Ar (PAr0/PVTS0 = 13, P = 2 kPa and Qtot = 150 sccm). The deposition rate is typically two orders of magnitude lower for VTS/Ar than for VTS/H2 and obeys an Arrhenius law with an apparent activation energy of about 250 kJmol-1 over the range 1025 – 1125 °C (R could not be measured below 1025 °C with
argon, compared to 925 °C with H2, Fig. 18a). The FTIR analysis shows in parallel that VTS is less decomposed with Ar, compared to H2, while the formation of less hydrogenated gas species like C2H2 and SiCl4 is favored (Fig. 18b). The Raman and EDS analyses of the coating obtained with Ar show that it consists of nearly pure carbon for the whole temperature domain. Similar results were obtained from studies by Kim et al. on MTS/Ar mixtures [34]. These authors indeed reported a decrease of the growth rate and a carbon enrichment in the deposit for temperatures below 1150 °C. The CVD from VTS diluted in argon thus presents many similarities with the CVD in H2 in the low temperature kinetic regime.
3.5. Influence of the addition of gas products in the initial VTS/H2 mixture
In order to better understand the influence of the main products formed in the gas phase at P = 2 kPa, the SiHCl3 (TCS), C2H4 and C2H2 apparent partial orders were evaluated at T = 975 °C and 1000 °C and the nature of the resulting deposit was examined. As above for VTS, the initial partial pressures of the three gaseous species were modified (Qtot = 205 sccm) and their influences on the
deposition rate and the composition of the deposit were examined. The change in the initial partial pressure of SiHCl3, PTCS0, does not significantly affect R at both temperatures within the PTCS0 domain explored (Fig. 19a). R is however lower at T = 1000 °C than without SiHCl3 addition. Whereas the deposited solid remains carbon-rich at T = 975 °C, it consists of pure SiC at T = 1000 °C for all PTCS0 tested.
R also does not vary much with PC2H40 for both temperatures. However, an inhibition effect is also observed at T = 1000 °C after the addition of C2H4 (Fig. 19b). As for TCS, the apparent partial order is low but could not be determined precisely due to too much uncertainty on R. The obtained deposit being too thin, EPMA or EDS analyses could not be performed. Yet, Raman spectroscopy measurements evidenced that excess carbon was formed for both temperatures after C2H4 addition. Unlike for the other two gases, R increases significantly with PC2H20, with an apparent partial order approximately equal to 1 for both temperatures (Fig. 19c). The deposition rate is again inhibited at 1000 °C at low values of PC2H20. As after adding C2H2, the Raman spectroscopy analyses reveal the presence of a large amount of free carbon in the deposit.
3.6 Infiltration capability of VTS
The porous structure of the fibrous fabrics used to produce SiC/SiC composites is particularly complex and multiscale, so that its infiltration is in practice difficult to characterize. Model porous substrates were therefore preferred to evaluate the infiltration capability of the VTS precursor in various CVD conditions. Open pores, with openings of about 100 µm or a few hundred microns, were chosen because they are representative of the macropores of SiC/SiC composites. Their infiltration capacity is crucial, as many of them are interconnected and communicate with the rest of the smaller pores. Straight parallelepipedic 20 mm-long channels with narrow slit-shaped openings of various widths at both ends were used as model pores. These substrates consisted in two tightly-assembled graphite plates, the first one with three trenches of equal width (2 mm) and different depths (50, 100 and 300 µm) machined on one side, the second one being completely flat (Fig. 20). The porous substrates were installed at the same place as the dense substrates used for the kinetic study, the channels being perpendicular – the openings parallel – to the gas flow direction.
The deposition rate was normalized with respect to the maximum value (generally reached at the surface) for an easier comparison of pore depth profiles. Under a given CVD condition (e.g. here: T = 1025 °C, P = 2 kPa, α = 13 and Qtot = 300 sccm), the larger the opening width, the easier the diffusion of the gases inside the pore, and the better the infiltration (Fig. 21).
Since the deposition temperature was found to induce important changes in the deposition rate and the composition of the solid and the gas phase, different infiltration tests were achieved at various T and constant pressure (P = 2 kPa), dilution ratio in H2 (α = 13) and total flow rate (Qtot = 300 sccm). The resulting infiltration profiles for a 300 m-wide pore are shown in Fig. 22. The infiltration test carried out at T = 950 °C leads to a remarkable result: the coating is very thin and consists of nearly pure carbon at the outside of the substrate and near the entrance in the channel, and turns to pure SiC at a distance of 0.6 mm and deeper into the pore. The transition from the carbon-rich deposit to pure SiC is abrupt and associated with a sharp increase of the deposition rate. The maximum value reached at 4.6 mm is 2.8 m.h-1 whereas the value at the surface is only
0.06 m.h-1. This phenomenon can be likely related to the kinetic transition observed during the CVD experiments carried out while raising T in the range 950 – 1000 °C. Contrary to the 950 °C experiment, the infiltration tests performed at 1025 and 1100 °C lead to pure SiC at the surface and inside the pore. On the other hand, the deposition rate suddenly drops to nearly zero within a short distance (< 1 mm) of the pore entrance (Fig. 22). The maximum values reached at the surface are respectively 16 and 15 m.h-1 (a slight gas depletion probably reduces the deposition rate at high temperature).
4. Discussion
4.1. The low temperature regime: CRR1
The low temperature chemical reaction regime observed using the VTS/H2 system (it will be referred to as CRR1 in the following) corresponds to the starting decomposition of VTS (Fig. 2b). It is associated to the deposition of large excess of carbon (Fig. 5) at low deposition rates (Fig. 2a), with an apparent activation energy of about 250 kJmol-1 (Fig. 10). Some similar features have also been encountered for the VTS/Ar system. Indeed, in this case R is low, its apparent activation energy is similar (Figs. 18a) and the deposit is carbon-rich, although formed at a much higher temperature than for a dilution in H2. Besides, the gas phase analysis reveals that the decomposition of VTS occurs at a higher temperature (Fig. 18b) and with a more thermally activated process (Ea
= 350 kJ.mol-1 versus 280 kJ.mol-1 for VTS/H2 in the CRR1 regime, Fig. 18a). This result thus suggests that the decomposition reaction of VTS might not be the same for the VTS/H2 and VTS/Ar systems. A similar behavior was also reported by one of us during a study of the SiHCl3/C2H2/H2 system [35]. The deposition rate and the apparent activation energy obtained in this case were indeed very close to those of the CRR1 regime for the VTS/H2 system. The coating then was also deposited at low temperature and rich in free carbon, supposedly controlled by the adsorption of C2H2 due to its high sticking coefficient. Although the decomposition steps obviously vary for these various precursor systems, the nature of the solid, the deposition rate and the apparent activation energy are all rather similar. Such common features suggest that the
limiting stage of CRR1 regime may be related to chemical reactions involving unsaturated hydrocarbon species.
Given the nature the hydrocarbons detected by FTIR from the VTS/H2, VTS/Ar and SiHCl3/C2H2/H2 systems [35], it can be assumed that three major unsaturated species could participate in the deposition of free carbon. C2H2 is produced in low amounts in the CRR1 regime from VTS/H2 and in larger proportions from VTS/Ar (Figs. 2 and 18). Its sticking coefficient is of the order of 0.02 – 0.05 [36–39] and its addition to the VTS/H2 mixture increases significantly the deposition rate in the CRR1 regime (Fig. 19c). López-Honorato et al. also reported that a thin carbon layer was deposited above the fluidized bed (FB) in a FB-CVD reactor using a MTS/C2H2/H2 mixture, while a pure SiC coating was grown on the FB particles themselves [40]. In comparison, no such carbon layer was produced using MTS/H2 or MTS/C3H8/H2 mixtures in the same conditions, suggesting that C2H2 plays a major role in the deposition of free carbon. C2H4 is found in large amounts in the gas phase for the VTS/H2 system in the CRR1 regime (Figs. 2). Its sticking coefficient is about ten times lower than that of C2H2 [37,38] and its addition in the gas does not increase of the deposition rate (Fig. 19b). We did not observe the formation of carbon-rich coating using a SiHCl3/C2H4/H2 mixture, at P = 2 kPa, at the temperatures at which the deposit starts to be formed [35]. On the other hand, Sotirchos et al. noticed that the addition of C2H4 in a mixture of MTS/H2 improved the deposition rate of free carbon at P = 13.3 kPa and T = 1075 °C [17]. But this result could be due to larger concentrations of C2H2 and C2H3▪, resulting from the decomposition of C2H4, possibly related to the high pressure applied in comparison with that used by us (P = 2 kPa). We indeed did not detect C2H2 by FTIR from the SiHCl3/C2H4/H2 mixture. Finally, the radical C2H3▪ can be produced by the scission of the Si–C bond of VTS. This species is likely at the origin of C2H2 and C2H4, detected by FTIR. It has a sticking coefficient similar to that of C2H2 and could thus be involved in the deposition of free carbon [37,38].
The apparent activation energies reported for the CVD of pyrolytic carbon from C2H2 and C2H4, at atmospheric pressure, are respectively 138 and 155 kJmol-1 [41], which is much less than the 250 kJmol-1 found for the CRR1 regime. The respective deposition mechanisms of carbon are obviously distinct, probably due to the very different pressure. The presence of chlorosilicon species could also promote another deposition mechanism. Sotirchos et al. indeed noticed an increase of the deposition rate of pyrolytic carbon from C2H4/H2 in presence of MTS [17]. These authors explained this phenomenon by a reaction between CH▪ and SiCl3▪ species adsorbed on two
adjacent sites to incorporate a carbon atom in the coating and form adsorbed SiCl2 and HCl. Yet, this purely heterogeneous model is not able to explain the growth of almost pure carbon under steady state conditions. The increase in deposition rate can be more likely explained by the occurrence of radical reactions related to the chlorine chemistry. The appearance of Cl▪ radicals in the gas phase indeed lead to the formation of highly reactive hydrocarbon species, such as CH3▪, which may serve as effective precursors of carbon [42,43]. We also showed that the reactional mechanism involved in the hydrocarbon gas phase produced from the SiHCl3/C2H4/H2 system is linked to that governing the chlorosilicon homogeneous phase via the radical H▪. H▪ is indeed formed from reactions between hydrocarbons, and consumed through reactions between chlorosilicon species, thus modifying the balance between the two chemical systems [35].
4.2. The C / SiC transition and the hysteresis phenomenon
From VTS/H2, at P = 2 kPa, the increase of the deposition temperature between 975 and 1000°C results in the transition between a carbon-rich coating (in the CRR1 regime) to a pure SiC coating, whose deposition is controlled by a distinct – high temperature – chemical reaction regime (referred to as CRR2) (Fig. 5). A very similar phenomenon was observed between 1000 and 1025 °C using a SiHCl3/C2H2/H2 mixture (also at P = 2 kPa), with an initial C/Si ratio in the gas phase of 3 [35]. This transition can be explained by a change in the nature of the chlorosilicon gas phase at high temperature, promoting the formation SiCl2 as a precursor of silicon. The origin of this transition for the VTS/H2 system is probably more complex considering the hysteresis of the deposition rate during the temperature rise or fall observed between CRR1 and CRR2 at P = 5 kPa (Fig. 8a). A hysteresis is indeed also observed at 10 kPa, but between CRR1 and an intermediate regime below CRR2, referred to as CRR2* (Fig. 9a). In the VTS case, the hysteresis seems more likely related to a heterogeneous process. This assumption is supported by the fact that the changes in the gas phase are not themselves subject to hysteresis upon heating/cooling. Sotirchos et al. reported a very similar hysteresis in both R and deposit composition with a MTS/C2H4/HCl/H2 mixture [17,44–46]. These authors correlated this phenomenon to modifications of both the deposition temperature and the initial HCl concentration in the gas phase, and explain it by the existence of a multiplicity of steady states in the co-deposition of SiC and C for a given experimental condition. This work also showed that the formation of free carbon, following the
increase in C2H4 concentration, is accompanied by a sharp drop of the deposition rate [17,44–46]. This result is very similar to that reported here at T = 1000 °C, after the addition of 0.025 mol. % of C2H2 or C2H4 to the initial VTS/H2 mixture (Fig. 19b,c). Sotirchos et al. suggested that the sp2 -C deposit inhibits the deposition of Si-C, the transition from -C to Si-C being controlled by the interaction between the heterogeneous mechanisms of deposition the two respective phases. The model describing the hysteresis phenomenon involves a competition between the different adsorption sites of SiCl2 and C2H4.
On the basis of the model suggested by Sotirchos et al. and the current results, three major effects could explain the hysteresis phenomenon.
4.2.1. the role of HCl
In their study of the MTS/C2H4/H2 system, Sotirchos et al. noticed that (i) no hysteresis appeared without HCl addition and (ii) the addition of more than 10 mol. % HCl induced a strong drop of the deposition rate. The latter effect is due to the inhibition of the silicon adsorption sites by chlorine blockage [13]. It has often been mentioned in CVD studies of the MTS/H2 system [8,9,12,29] and described by modelling [47]. It could also explain the decrease of the deposition rate observed in the CRR2 regime (at T = 1000 °C) after the addition of SiHCl3 in the VTS/H2 mixture (Fig. 19a). Not only can the adsorption of silicon be hindered by HCl, but chlorine could also enhance the deposition of carbon via radical reactions in the CRR1 regime (see section 4.1). As the temperature rises from an initial low T level, the silicon sites, saturated by chlorine, inhibit the SiC deposition at the surface [48]. Simultaneously, the reactive hydrocarbon gas phase (containing C2H2 and C2H3▪) contributes to the deposition of free carbon at low deposition rate. Conversely, as the temperature decreases from an initial high level, the Si sites are free of chlorine that has desorbed at high temperature, and the SiC deposit is free to form at high deposition rate. The consecutive of rise and fall of deposition temperature thus induce the hysteresis of the deposition rate and the deposit composition. The presence of chlorine and silicon trapped in the free carbon network of the coating obtained in the CRR1 regime (see section 3.1.) is also consistent with such a mechanism. The fact that the hysteresis appears only at P ≥ 5 kPa could be then related to the larger amounts of HCl produced at high pressure, as suggested by FTIR analyses [30]. In addition to the influence of HCl, the role of the hydrocarbon gas phase is also decisive for the appearance of the above hysteresis phenomenon. Indeed, no hysteresis was found for the
MTS/HCl/H2 system: Sotirchos et al. observed it only within a narrow C2H4 partial pressure range. A highly reactive hydrocarbon phase is essential, but so is the formation of the solid free carbon phase, as discussed below.
4.2.2. The chemical nature of the surface of the deposit
The sticking coefficient of chlorosilicon species is probably much lower on the free carbon phase than on the SiC phase, due to the different surface atomic configurations. The growth of hexagonal carbon layers at the expense of SiC, during the CRR1 regime, is therefore expected to hinder the adsorption of chlorosilicon species. Hence, the different chemical nature of the deposit surface encountered either on heating or cooling could obviously contribute to the hysteresis of the deposition rate of pure SiC and the sp2 carbon-rich material.
4.2.3. The nature of the effective precursors of the deposit
Sukkaew et al. established by ab initio calculation that contrary to CH3▪ or C2H4, which is cleaved in two distinct CHx groups, C2H2 is adsorbed at the (0001) surface, Si face, of 4H–SiC in a configuration such that its two carbon atoms remain chemically bonded [39]. Similar conclusions had been drawn by Di Felice et al. who studied C2H2 adsorption on both Si(111) and (Si(001) surfaces of 3C–SiC [49]. It is then reasonable to assume that a Si surface of SiC saturated by adsorbed C2H2 can evolve towards a continuous sp2 carbon surface by dehydrogenation and atomic reorganization. Although none of these authors considered the presence of chlorine in the system, Di Felice et al. suggested that the stability of the C–C bond after C2H2 adsorption could lead to an inhibition of the SiC growth. In the present case, the adsorption of SiCl3▪, the precursor of SiHCl3 detected at the reactor outlet, should therefore be more difficult at a site where C2H2 is adsorbed – and a fortiori at a sp2 carbon surface – than at sites where CH
3▪ or C2H4 are adsorbed. Even though the real nature of the surface is obviously different from that considered by Di Felice et al. or Sukkaew et al., these ab initio studies tend to show that the free carbon phase growth in the low temperature CRR1 regime could result from a preferential adsorption of C2H2. At higher temperature, the formation of another hydrocarbon species able to form sp3 Si–CHx bonds on a Si
on a sp2 carbon surface – could be at the origin of the transition from carbon rich to pure SiC coating. The C2H4 concentration was found to significantly increases with T over the CRR1 domain (Figs. 2b,8b,9b). This species could contribute to the incorporation of increasing amounts of sp3 carbon atoms over the CRR1-CRR2 transition and thus the formation of SiC. Its particular adsorption configuration promotes surface reaction with chlorosilicon species [39,49].
4.3. The different kinetic regimes
The Arrhenius plots of the deposition rate for the MTS/H2, SiHCl3/C2H4/H2 and VTS/H2 systems are compared in Fig. 23 (P = 2 kPa, MTS/H2: QH2/QMTS = 10, Qtot = 200 sccm [35], SiHCl3/C2H4/H2: QH2/QSiHCl3 = 10, QC2H4/QSiHCl3 = 3/2, Qtot = 250 sccm [35], VTS/H2: see Fig. 2a).
The CRR1 regime observed for T < 975 °C is a specificity of the VTS/H2 systems. It is kinetically controlled, probably by the surface reaction of C2H2 that is produced in the gas phase (see section 4.2.3), and it leads to the growth of carbon-rich material at low deposition rate. The activation energy is about 250 kJmol-1 and the apparent C2H2 partial order of about 1 (Fig. 19c).
For T > 1000 °C, in the CRR2 regime, the thermal behavior of R for the VTS/H2 system is very similar to that for the MTS/H2 and SiHCl3/C2H4/H2 systems. The apparent activation energy at T = 1000 – 1050 °C is close for the three systems (≈ 150±10 kJ.mol-1), suggesting that similar heterogeneous reactions are kinetically limiting for the various precursors [7,32,35]. The main effective silicon precursors are likely similar for all three systems, i.e. SiCl2 and SiCl3▪ [5,7,50], which is probably not the case for the hydrocarbon precursors. For MTS/H2, CH3▪ is more likely the major carbon precursor [5,7,50], while it is more probably C2H2 or C2H3▪ for the SiHCl3/C2H4/H2 [35] and VTS/H2 system.
As observed here for the VTS/H2 system, increasing the pressure in the MTS/H2 system sometimes give rise to a new intermediate kinetic regime between the CRR/MTR transition, referred to as “third sub-domain” or CRR3, and a shift towards low temperatures of the kinetic transition between the CRR1 and the CRR2 regime [32] (it is important to mention that CRR1 and CRR2 regimes, here written in italic and reported in [32] for the MTS/H2 system, have nothing in common with the CRR1 and CCR2 regimes described in the present study on the VTS/H2 system). The high
pressure CRR3 domain was associated to a change in the heterogeneous mechanism, associated to the formation of large amounts of HCl inhibiting the SiC growth [32]. The intermediate CRR2* domain observed at P = 10 kPa for VTS/H2 (Fig. 9a) probably has a different origin from that of
CRR3 for MTS/H2. R was indeed found to decrease when Qtot increases, in the CRR2* domain (at
P = 10 kPa and T = 900°C, Fig. 13), suggesting a lower decomposition of VTS due to insufficient residence time (a strong decrease of the VTS decomposition was indeed detected in parallel by FTIR) [30]. Moreover, the apparent activation energies of the deposition rate in the CRR2* domain (Fig. 9a) is close to that of the VTS homogeneous decomposition (Fig. 12), suggesting that R is likely limited by the latter reaction in this particular regime. The shift towards low temperatures of the kinetic transitions, observed when P increases (Figs. 2a,8a,9a,SI1), is due to an increase of both the molecular collision probability and the residence time, these effects both promoting the VTS decomposition Figs. 2b,8b,9b,11).
In the highest temperature range (i.e. beyond the CRR2 regime), at P = 2 and 5 kPa, the kinetic rate becomes increasingly controlled by mass transfers (Figs. 2a,8a,10) and all the partial pressures of the gas product decrease as T increases, except HCl and C2H2 (Figs. 2b,8b). In parallel, free carbon is co-deposited at the highest temperatures of this regime, similarly as observed for SiHCl3/C3H8/H2 and SiHCl3/C2H4/H2 [35]. This carbon enrichment of the coating seems related to a depletion of the gas phase in chlorosilicon species participating to the deposition silicon (Fig. 7a) and to the formation of highly reactive hydrocarbons (e.g. C2H2 or heavier species).
4.4. Relationship between CVD and infiltration conditions
At P = 2 kPa and T = 950 °C, i.e. in the CRR1 deposition domain, the infiltration test leads to strong discontinuities along the longitudinal deposition profile. The deposition rate is indeed very low and the deposit carbon-rich for x < 0.6 mm, whereas R increases abruptly and the coating turns to pure SiC for x > 0.6 mm (Figs. 22). This infiltration behavior is obviously very different from what is generally observed for other precursors, in particular for the MTS/H2 system (see in Fig. 24 an example of infiltration profile recorded for T = 970 °C, QH2/QMTS = 3, Qtot = 160 sccm). The
sudden transition in both R and solid composition for the VTS/H2 system can be assigned to a local change of the effective precursor of the deposit. Outside and near the pore entrance, where nearly pure CVD conditions apply, the deposition of a carbon-rich coating at very low deposition rates
could be closely related to the formation of C2H2 in the gas phase and its adsorption at the surface of the deposit (see section 4.2.3.). The depletion of C2H2 consumed by the free carbon deposition at the entrance of pore and the increase of the local residence time (as suggested by Fig. 11a) would then lead, deeper in the pore, to an increase of the concentration of C2H4. The latter species is capable of adsorbing to the surface and disrupting the deposition of sp2 carbon (see section 4.2.3.). The structural disorder of the free carbon phase increasing, the SiCl2 adsorption would then become more favorable and thus promote the deposition of pure SiC at high deposition rates. Hence, the increase in the concentration of C2H4 and SiCl2 (caused respectively by the C2H2 depletion and increase of R) from the outside to the inside of the pore, would be responsible for the carbon-rich to pure SiC transition and the remarkable increase of the deposition rate. This hypothesis is similar to that made by Wang and Tsai to explain the transition from a carbon-rich to a silicon-rich deposit, between the reactor inlet and outlet, using SiH2Cl2/C2H2/H2, [51].
The carbon-rich to SiC transition observed at 950 °C for the VTS/H2 system could be problematic for specific applications. Another potential way to improve the stoichiometry and homogeneity of infiltrated deposits could be the use of two separate silicon and carbon precursors of appropriate reactivity. We have also explored this approach (see in Fig. 24 an example of infiltration profile recorded using a SiHCl3/C3H8/H2 mixture, for T = 970°C, QH2/QSiHCl3 = 10, QC3H8/QSiHCl3 = 1, Qtot = 240 sccm), which we will discuss in a forthcoming article.
5. Conclusions
The deposition of SiC from vinyltrichlorosilane was investigated in terms of deposition rate, chemical composition of the solid and nature of the gas phase at the exhaust of a hot-wall reactor. Three different domains of deposition rate were observed and associated to different sets of homogeneous and heterogeneous reactions:
- At low temperature: a CRR1 domain with an activation energy of 230 kJ.mol-1 is observed. The deposit consists mainly of carbon with a only few percent of silicon. VTS tends to decompose into highly reactive carbon-bearing species such as C2H2▪, in contrast with the CH3▪ radicals formed from MTS.
- At medium temperature: pure SiC is deposited within the CRR2 domain (Ea = 150 kJ.mol-1)
beyond a narrow domain of bistability. Ethylene and SiCl4 are respectively the major carbon and silicon-bearing species detected in the CRR2 domain, while the concentration of SiHCl3 is significantly reduced.
- At high temperature, mass transfer becomes the limiting step of the deposition rate. SiC is obtained with a small excess of carbon due to the formation of highly reactive hydrocarbons (associated with a higher concentration of C2H2 in the gas phase) and depletion of silicon species. The domain of bistability observed between the CRR1 and CRR2 regime, is related to a hysteresis of the deposition rate upon the temperature increase or decrease. This effect is assigned to a change in the nature of the deposit (from a carbon-rich to a pure SiC coating) affecting the heterogeneous reactions.
The pressure dependence of the deposition rate allowed to establish a P-T diagram delimiting the different kinetic and composition domains for the SiC deposition from VTS (Fig. 14).
The rate constant and the apparent activation energy of the unimolecular decomposition of VTS (Ea = 230 kJ.mol-1) were determined from FTIR analyses performed as a function of the residence
time R. The increase of R leads to a higher VTS decomposition rate and therefore a higher
deposition rate, particularly in the MTR domain.
The nature of the dilution gas and the dilution ratio of VTS was varied in order to understand the role of hydrogen in the decomposition of the precursor and help proposing a homogeneous chemical mechanism. Although the coating consists mainly of carbon when using Ar as the diluent gas, pure SiC was deposited at all the initial partial pressures of H2 and VTS examined for the VTS-H2 system in the CRR2 domain.
The infiltration of pure SiC in model channel pores is more homogeneous when decreasing the substrate temperature, although no SiC is deposited at the entrance of the pores at the lowest temperatures (T ≤ 950°C).
The authors acknowledge Safran Ceramics, the French National Association for Research and Technology (ANRT, CIFRE contract N° 2015/1426) and the Claude Delhorme Research Center from Air Liquide for their help and financial support. They also gratefully thank A. Delcamp, C. Descamps and S. Goujard from Safran Ceramics, as well as T. Renault and C. Dussarat from Air Liquide, for regular and fruitful discussions.
CRediT author statement
A. Desenfant: Methodology, Investigation, Data curation, Visualization, Writing - Original draft
preparation, G. Laduye: Methodology, Writing - Reviewing and Editing, G. L. Vignoles: Writing - Reviewing and Editing, G. Chollon: Methodology, Writing - Reviewing and Editing, Supervision.
References
[1] R. Naslain, SiC-Matrix Composites : Nonbrittle Ceramics for Thermo-Structural Application. Int. J. App. Ceram. Technol. 2 (2005) 5-84. https://doi.org/10.1111/j.1744-7402.2005.02009.x [2] F. Christin, Design, Fabrication, and Application of Thermostructural Composites (TSC) like C/C, C/SiC, andSiC/SiC Composites, Adv. Eng. Mater. 4 (2002) 903-912. https://doi.org/10.1002/adem.200290001
[3] J. Lamon, Chemical Vapor Infiltrated SiC/SiC Composites (CVI SiC/SiC), in Handbook of Ceramic Composites, N.P. Bansal ed., Springer, Boston, USA, 2005, pp.55-76. https://doi.org/10.1007/0-387-23986-3_3
[4] F. Loumagne, F. Langlais, R. Naslain, S. Schamm, D. Dorignac, J. Sévely, Physicochemical properties of SiC-based ceramics deposited by low pressure chemical vapor deposition from CH3SiCl3-H2, Thin Solid Films 254 (1995) 75-82. https://doi.org/10.1016/0040-6090(94)06237-F [5] W. G. Zhang, K. J. Hüttinger, CVD of SiC from Methyltrichlorosilane. Part II: Composition of the Gas Phase and the Deposit. Chemical Vapor Deposition, 7 (2001) 173-181.
[6] J. A. DiCarlo, Advances in SiC/SiC Composites for Aero‐Propulsion, Chap. 7 of “Ceramic Matrix Composites”, N. P. Bansal & J. Lamon eds., Wiley-American Ceramic Society, 2014, pp. 217-235. https://dx.doi.org/10.1002/9781118832998.ch7
[7] F. Loumagne, F. Langlais, R. Naslain, Reactional mechanisms of the chemical vapour deposition of SiC-based ceramics from CH3SiCl3/H2 gas precursor, J. Cryst. Growth 155 (1995) 205-213. https://doi.org/10.1016/0022-0248(95)00181-6
[8] Y. Yang, W.-G. Zhang, Chemical vapor deposition of SiC at different molar ratios of hydrogen to methyltrichlorosilane, J. Central South Univ. Technol. 16 (2009) 0730-0737. https://doi.org/10.1007/s11771-009-0121-4
[9] G.D. Papasouliotis, S.V. Sotirchos, Experimental study of atmospheric pressure chemical vapor deposition of silicon carbide from methyltrichlorosilane, J. Mater. Res. 14 [8] (1999) 3397-3409.
https://doi.org/10.1557/JMR.1999.0460
[10] A. Josiek, F. Langlais, X. Bourrat, A study of the transition between growth of stoichiometric and silicon-excess silicon carbide by CVD in the system MTS/H2, Chemical Vapor Deposition 2 (1996) 17-21. https://doi.org/10.1002/cvde.19960020105
[11] G. Papasouliotis, S. Sotirchos, Hydrogen chloride effects on the CVD of silicon carbide from methyltrichlorosilane, Chemical Vapor Deposition, 4 (1998) 235-246.
https://doi.org/10.1002/(SICI)1521-3862(199812)04:06<235::AID-CVDE235>3.0.CO;2-R
[12] D. Lespiaux, F. Langlais, R. Naslain, S. Schamm, J. Sévely, Chlorine and Oxygen Inhibition Effects in the Deposition of SiC-based Ceramics from the Si-C-H-Cl system, J. Eur. Ceram. Soc. 15 (1995) 81-88. https://doi.org/10.1016/0955-2219(95)91303-6
[13] M.T. Schulberg, M.D. Allendorf, D.A. Outka, The interaction of HCl with polycristalline -SiC: evidence for a site-blocking mechanism for HCl inhibition of SiC CVD, MRS Proceedings, Volume 410 (Symposium S – Covalent Ceramics III-Science and Technology of Non-Oxides), G.S. Fischman, A.F. Hepp, A.E. Kaloyeros, P.N. Kumta, J.J. Sullivan eds., 1995, pp. 471-476. https://doi.org/10.1557/PROC-410-471
[14] D. H. Kuo, D. J. Cheng, W. J. Shyy, M.H. Hon, The effect of CH4 on CVD -SiC Growth, J. Electrochem. Soc. 137 (1990) 3688-3692. https://doi.org/10.1149/1.2086288
[15] B. J. Choi, S. H. Jeun, D. R. Kim, The Effects of C3H8 on the Chemical Vapor Deposition of Silicon Carbide in the CH3SiCl3 + H2 System, J. Eur. Ceram. Soc. 9 (1992) 357-363. https://doi.org/10.1016/0955-2219(92)90094-T
[16] J. I. Kim, W. J. Kim, D. J. Choi, J. Y. Park, Deposition of compositionally graded SiC/C layers on C-C composites by low pressure chemical vapor deposition, J. Nucl. Mater. 307-311 (2002) 1084-1087. https://doi.org/10.1016/S0022-3115(02)00948-0
[17] S. V. Sotirchos, I. M. Kostjuhin, SiC and C codeposition from CH3SiCl3-C2H4 mixtures. Proceedings of the 13th International Conference of Chemical Vapor Deposition, T.M. Besmann, M.D. Allendorf, Mc.D. Robinson, R.K. Ulrich eds., Electrochemical Society Proceedings, Vol. 96-5, 1996, pp. 733-738.
[18] T. Noda, H. Araki, F. Abe, M. Okada, Microstructure and mechanical properties of CVI carbon fiber/ SiC composites, J. Nucl. Mater. 191-194 (1992) 539-543. https://doi.org/10.1016/S0022-3115(09)80103-7
[19] H. Araki, T. Noda, W. Yang, A. Kohyama, Homogeneity and flexural properties of SiC/SiC composites prepared by CVI method, J. Nucl. Mater. 307-311 (2002) 1210-1214.
https://doi.org/10.1016/S0022-3115(02)01061-9
[20] T. Taguchi, N. Igawa, R. Yamada, S. Jitsukawa, Effect of thick SiC interphase layers on microstructure, mechanical and thermal properties of reaction-bonded SiC/SiC composites, J. Phys. Chem. Solids. 66 (2005) 576-580. https://doi.org/10.1016/j.jpcs.2004.06.034
[21] W. Yang, H. Araki, A. Kohyama, H. Suzuki, T. Noda, ETS-synthesized Hi-Nicalon fiber–SiC matrix composite, Ceram. Int. 31 (2005) 47-52. https://doi.org/10.1016/j.ceramint.2004.03.033 [22] A. Saigal, N. Das, Effect of deposition parameters on the strength of CVD beta-SiC coatings, Adv. Ceram. Mater. 3 (1988) 580-583. https://doi.org/10.1111/j.15512916.1988.tb00282.x
[23] D. E. Cagliostro, S. R. Riccitiello, M. G. Carswell, Analysis of the pyrolysis products of dimethyldichlorosilane in the chemical vapor deposition of silicon carbide in argon, J. Am. Ceram. Soc. 73 (1990) 607-614. https://doi.org/10.1111/j.1151-2916.1990.tb06560.x
[24] D. E. Cagliostro, S. R. Riccitiello, Model for the Formation of Silicon Carbide from the Pyrolysis of Dichlorodimethylsilane in Hydrogen: II, Silicon Carbide Formation from Silicon and Methane, J. Am. Ceram. Soc. 76 (1993) 39-48. https://doi.org/10.1111/j.1151-2916.1993.tb03688.x
[25] D. E. Cagliostro, S. R. Riccitiello, J. Ren, F. Zaghi, Comparison of the Pyrolysis Products of Dichlorodimethylsilane in the Chemical Vapor Deposition of Silicon Carbide on Silica in Hydrogen or Argon, J. Am. Ceram. Soc. 77 (1993) 2721-2726. https://doi.org/10.1111/j.1151-2916.1994.tb04667.x
[26] M. S. Cho, J. W. Kim, G. Y. Chung, Manufacturing of ceramic composites reinforced with layered woven fabrics by CVI of SiC from dichlorodimethylsilane. Korean J. Chem. Eng. 13 (1996) 515–521. https://doi.org/10.1007/BF02706003
[27] B. J. Choi, D. W. Park, D. R. Kim, Chemical vapour deposition of silicon carbide by pyrolysis of methylchlorosilanes, J. Mater. Sci. Let. 16 (1997) 33-36.
https://doi.org/10.1023/A:1018584330520
[28] T. Takeuchi, Y. Egashira, T. Osawa, H. Komiyama, A Kinetic Study of the Chemical Vapor Deposition of Silicon Carbide from Dichlorodimethylsilane Precursors, J. Electrochem. Soc. 145 (1998) 1277-1284. https://doi.org/10.1149/1.1838451
[29] W. G. Zhang, K. J. Hüttinger, CVD of SiC from Methyltrichlorosilane. Part I: Deposition Rates, Chemical Vapor Deposition, 7 (2001) 167-172. https://doi.org/10.1002/1521-3862(200107)7:4<167::AID-CVDE167>3.0.CO;2-L
[30] A. Desenfant, Dépôt chimique en phase vapeur (CVD) de carbure de silicium (SiC) à partir de vinyltrichlorosilane (VTS) et de méthylsilane (MS), PhD Thesis, University of Bordeaux, 2018.
https://tel.archives-ouvertes.fr/tel-02078783
[31] B. Reznik, H. U. Hüttinger, On the terminology for pyrolytic carbon, Carbon 40 (2002) 621-624.
[32] F. Loumagne, F. Langlais, R. Naslain, Experimental kinetic study of the chemical vapour deposition of SiC-based ceramics from CH3SiCl3/H2 gas precursor, J. Cryst. Growth 155 (1995) 198-204. https://doi.org/10.1016/0022-0248(95)00180-8
[33] M. D. Allendorf, T. H. Osterheld, C. F. Melius, The decomposition of methyltrichlorosilane: studies in a high-temperature flow reactor, Mater. Res. Soc. Symp. Proc. 334 (1993) 105-110. https://doi.org/10.1557/PROC-334-105
[34] H. S. Kim, D. J. Choi, Effect of diluent gases on growth behavior and characteristics of chemically vapor-deposited silicon carbide films, J. Am. Ceram. Soc. 82 (2) (1999) 331-337. https://doi.org/10.1111/j.1551-2916.1999.tb20066.x
[35] G. Laduye, CVD du carbure de silicium à partir du système SiHxCl4-x/CyHz/H2: étude expérimentale et modélisation, PhD Thesis, University of Bordeaux, 2016. https://tel.archives-ouvertes.fr/tel-01477657
[36] C. J. Mogab, H. J. Leamy, Conversion of Si to epitaxial SiC by reaction with C2H2, J. Appl. Phys. 45 (1974) 1075-1084. https://doi.org/10.1063/1.1663370
[37] G. M. Petrov, J. L. Giuliani, Model of a two-stage RF plasma reactor for SiC deposition, J. App. Phy. 90 (2001) 619-636. https://doi.org/10.1063/1.1373701
[38] Ö. Danielsson, A. Henry, E. Janzén, Growth rate predictions of chemical vapor deposited silicon carbide epitaxial layers, J. Cryst. Growth 243 (2002) 170-184.
https://doi.org/10.1016/S0022-0248(02)01486-0
[39] P. Sukkaew, Ö. Danielsson, O. Kordina, E. Janzén, L. Ojamäe, Ab initio study of growth mechanism of 4H–SiC: adsorption and surface reaction of C2H2, C2H4, CH4, and CH3, J. Phys. Chem. C. 121 (2017) 1249-1256. https://doi.org/10.1021/acs.jpcc.6b11085
[40] E. López-Honorato, P. J. Meadows, J. Tan, P. Xiao, Control of stoichiometry, microstructure, and mechanical properties in SiC coatings produced by fluidized bed chemical vapor deposition, J. Mater. Res. 23 (2008) 1785-1796. https://doi.org/10.1557/JMR.2008.0220.
[41] P. A. Tesner, Kinetics of pyrolytic carbon formation, in: Chemistry and Physics of Carbon, Vol. 19, P. L. Walker Jr, P. A Thrower eds., Marcel Dekker Inc., New York, 1984, pp. 65-161. [42] C. Pan, C. J. Chu, J. L. Margrave, R. H. Hauge, Chlorine-Activated Diamond Chemical Vapor Deposition, J. Electrochem. Soc. 141 (1994) 3246-3249. http://dx.doi.org/10.1149/1.2059312
[43] C. A. Rego, R. S. Tsang, P. W. May, M. N. R. Ashfold, K. N. Rosser, Gas‐phase composition measurements during chlorine assisted chemical vapor deposition of diamond: A molecular beam mass spectrometric study, J. Appl. Phys. 79 (1996) 7264-7273. https://doi.org/10.1063/1.361443
[44] G. D. Papasouliotis, S. V. Sotirchos, Steady‐State Multiplicity Phenomena in the Deposition of Silicon Carbide, J. Electrochem. Soc. 145 (1998) 3908-3919.
http://dx.doi.org/10.1149/1.1838892
[45] I. M. Kostjuhin, S. V. Sotirchos, Codeposition of SiC and C from Mixtures of Methyltrichlorosilane and Ethylene in Hydrogen, Ind. Eng. Chem. Res. 40 (2001) 2586-2596.
https://doi.org/10.1021/ie000960u
[46] I. M. Kostjuhin, S. V. Sotirchos, Multiplicity of steady states in the codeposition of silicon carbide and carbon, AIChE Journal 48 (2002) 2910-2920. https://doi.org/10.1002/aic.690481218
[47] C. Cavallotti, Reactivity of Silicon Surfaces in the Presence of Adsorbed Hydrogen and Chlorine, Chem. Vap. Deposition 16 (2010) 329-335. https://doi.org/10.1002/cvde.201006870
[48] A. Josiek, CVD dans le système CH3SiCl3/H2 : cinétiques expérimentales de dépôt de SiC et SiC+Si, modélisation, PhD Thesis, University of Bordeaux, 1995. http://www.theses.fr/1995BOR10613
[49] R. Di Felice, C. A. Pignedoli, C. M. Bertoni, A. Catellani, P. L. Silvestrelli, C. Sbraccia, F. Ancilotto, M. Palummo, O. Pulci, Ab initio investigation of the adsorption of organic molecules at Si(111) and Si(100) surfaces, Surf. Sci. 532-535 (2003) 982-987. https://dx.doi.org/10.1016/S0039-6028(03)00226-7
[50] S. V. Sotirchos, G. D. Papasouliotis, Kinetic modeling of the deposition of SiC from methyltrichlorosilane, MRS Proceedings, Vol. 250 (Symposium R – Chemical Vapor Deposition of Refractory Metals and Ceramics II), T. M. Besman, B. M. Gallois, J. Warren eds., 1991, pp. 35-40. https://doi.org/10.1557/PROC-250-35
[51] F. Wang, D. S. Tsai, Low pressure chemical vapor deposition of silicon carbide from dichlorosilane and acetylene, Mater. Chem. Phys. 63 (2000) 196-201.
Figure captions
Figure 1: Multi-instrumented CVD reactor
Figure 2: (a) Arrhenius plot of the deposition rate R and (b) influence of the temperature T on the gas partial pressures Pi at the reactor outlet (P = 2 kPa, α = 13 and Qtot = 150 sccm)
Figure 3: (a) Raman spectrum (from the outer surface) and (b) high resolution TEM image (inset: selected area diffraction pattern) of a coating obtained at T = 950 °C, P = 2 kPa, α = 13 and Qtot =
150 sccm
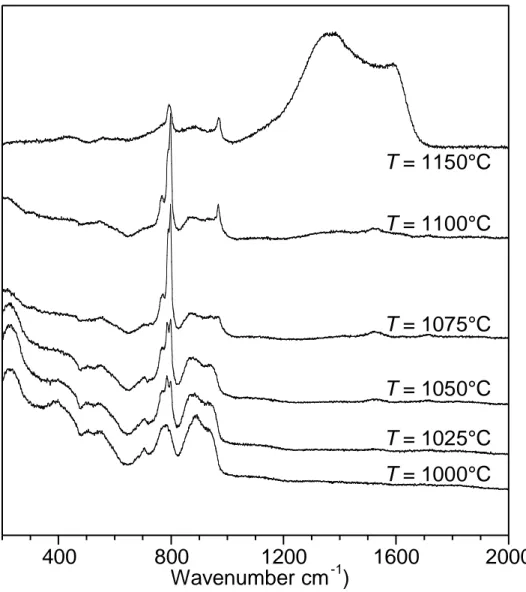
Figure 4: Raman spectra of coatings obtained at different temperatures T and at P = 2 kPa, α = 13 and Qtot = 150 sccm (from polished cross sections)
Figure 5: Influence of the temperature T on the elemental composition of the solid deposit (measured upon heating, α = 13, Qtot = 150 sccm)
Figure 6: TEM images of a coating obtained at T = 1100 °C, P = 2 kPa, α = 13 and Qtot = 150 sccm.
(a) bright field, (b) 111 dark field, (c) high resolution and (d) selected area diffraction pattern Figure 7: Gas, solid and total mass yield of (a) Si and (b) C, (c) comparison of the total Si, C and Cl total mass yields (P = 2 kPa, α = 13 and Qtot = 150 sccm)
Figure 8: (a) Arrhenius plot of the deposition rate R and (b) influence of the temperature T on the gas partial pressures Pi at the reactor outlet (P = 5 kPa, α = 13 and Qtot = 150 sccm)
Figure 9: (a) Arrhenius plot of the deposition rate R and (b) influence of the temperature T on the gas partial pressures Pi at the reactor outlet (P = 10 kPa, α = 13 and Qtot = 150 sccm)
Figure 10: Influence of the total gas flow rate Qtot on the deposition rate R (P = 2 kPa, α = 13).
Figure 11: Influence of the gas residence time tR on the partial pressures Pi at the reactor outlet (P
= 2 kPa, α = 13, (a) T = 950°C, (b) T = 1100°C,
Figure 12: VTS decomposition kinetics, as deduced from the temperature dependence of the VTS partial pressure (α = 13, Qtot = 300 sccm)