HAL Id: insu-01439209
https://hal-insu.archives-ouvertes.fr/insu-01439209
Submitted on 18 Jan 2017HAL is a multi-disciplinary open access archive for the deposit and dissemination of sci-entific research documents, whether they are pub-lished or not. The documents may come from teaching and research institutions in France or abroad, or from public or private research centers.
L’archive ouverte pluridisciplinaire HAL, est destinée au dépôt et à la diffusion de documents scientifiques de niveau recherche, publiés ou non, émanant des établissements d’enseignement et de recherche français ou étrangers, des laboratoires publics ou privés.
Highlighting the wide variability in arsenic speciation in
wetlands: a new insight into the control of the behavior
of arsenic
Hélène Guénet, Mélanie Davranche, Delphine Vantelon, Martine Bouhnik-Le
Coz, Emilie Jardé, Anne-Catherine Pierson-Wickmann, Vincent Dorcet,
Jacques Jestin
To cite this version:
Hélène Guénet, Mélanie Davranche, Delphine Vantelon, Martine Bouhnik-Le Coz, Emilie Jardé, et al.. Highlighting the wide variability in arsenic speciation in wetlands: a new insight into the con-trol of the behavior of arsenic. Geochimica et Cosmochimica Acta, Elsevier, 2017, 203, pp.284-302. �10.1016/j.gca.2017.01.013�. �insu-01439209�
Accepted Manuscript
Highlighting the wide variability in arsenic speciation in wetlands: a new insight into the control of the behavior of arsenic
Hélène Guénet, Mélanie Davranche, Delphine Vantelon, Martine Bouhnik-Le Coz, Emilie Jardé, Anne-Catherine Pierson-Wickmann, Vincent Dorcet, Jacques Jestin
PII: S0016-7037(17)30017-0
DOI: http://dx.doi.org/10.1016/j.gca.2017.01.013
Reference: GCA 10107
To appear in: Geochimica et Cosmochimica Acta
Received Date: 21 September 2016 Revised Date: 21 December 2016 Accepted Date: 7 January 2017
Please cite this article as: Guénet, H., Davranche, M., Vantelon, D., Bouhnik-Le Coz, M., Jardé, E., Pierson-Wickmann, A-C., Dorcet, V., Jestin, J., Highlighting the wide variability in arsenic speciation in wetlands: a new insight into the control of the behavior of arsenic, Geochimica et Cosmochimica Acta (2017), doi: http://dx.doi.org/ 10.1016/j.gca.2017.01.013
This is a PDF file of an unedited manuscript that has been accepted for publication. As a service to our customers we are providing this early version of the manuscript. The manuscript will undergo copyediting, typesetting, and review of the resulting proof before it is published in its final form. Please note that during the production process errors may be discovered which could affect the content, and all legal disclaimers that apply to the journal pertain.
1
Highlighting the wide variability in arsenic speciation in wetlands:
a new insight into the control of the behavior of arsenic
Hélène Guénet1,2,3, Mélanie Davranche1, Delphine Vantelon2, Martine Bouhnik-Le Coz1, Emilie Jardé1, Anne-Catherine Pierson-Wickmann1, Vincent Dorcet3, Jacques Jestin4
1
Géosciences Rennes, UMR 6118, Univ. Rennes 1, Campus de Beaulieu, 35042, Rennes Cedex, France
2
Synchrotron SOLEIL, L’orme des merisiers, Saint Aubin BP48, 91192, Gif sur Yvette Cedex, France
3
Univ Rennes 1, UMR CNRS 6226, Inst Sci Chim Rennes, Ctr Diffractometrie Rayons 10, F-35042 Rennes, France
4
Laboratoire Léon Brillouin, CEA Saclay 91191 Gif/Yvette Cedex France
Abstract
Although the behavior of Arsenic (As) under reducing conditions in periods of high water levels in wetlands is well understood and documented, there is a lack of information under oxidizing conditions when the water level decreases. In this study, we were interested in the first stage of the oxidizing period, when oxidation products are still in suspension. A soil sample from the Naizin Kervidy wetland (France) was incubated in the laboratory to produce a reduced soil solution. The reduced solution was subsequently oxidized, filtered and ultrafiltered using decreasing pore size membranes (5 µm, 3 µm, 0.2 µm, 30 kDa and 5 kDa). The distribution of As and Fe was investigated in each size fraction of the oxidized solution and their speciations were studied using XAS, HPLC and SEC-ICP-MS. Organic matter was characterized using thermally assisted hydrolysis and methylation gas chromatography-mass spectrometry (THM-GC-MS) and fluorescence spectroscopy. The majority of the As was present as As(V) but a small amount of As(III) still remained despite the advanced oxidized conditions. In the > 0.2 µm fractions, the XAS analyses showed that As was associated, in the second shell, with Fe (As-Fe = 3.35 Å) as bidentate binuclear complexes and C (As-C = 2.90 Å), suggesting the integration of As in biological objects. In the < 30 kDa fraction, As was directly bound to C (As-C = 1.96 Å) in the first shell indicating the presence of organic As species. In the second shell, an As-Fe distance of 3.35 Å was found showing that
2 part of the As was still complexed with Fe. The 0.2 µm-30 kDa fraction was a transitional fraction in terms of the Fe species and OM composition. In this fraction, organic matter exhibited a more humic character (aromatic molecules) inducing an increasing cation binding capacity. As a consequence, in this fraction and in the smallest one, As, Fe and OM seemed to form ternary complexes in which the Fe or nano-oxides in the > 30 kDa fraction and as monomer, or cluster in < 30 kDa fraction acted as a bridge. In all of the fractions, a proportion of As(V) was present as organic methylated species. These organic species might be produced by several organisms (animal or plant) via a detoxification process. They seemed to be bound to the particulate and colloidal Fe/OM phases as well as integrated in the remains of the organisms. Mass calculations provided evidence that 90% of the As was contained in the > 5 µm particulate fraction and thus was hardly mobile. This study showed that although wetlands have been identified as a potential source of As, a number of biological and geochemical trapping mechanisms also favor As stabilization in wetlands.
1. Introduction
Arsenic is a toxic element, and groundwater has been identified as the source of contamination (Smedley and Kinniburgh, 2001). Several mechanisms have been proposed to explain the As contamination of aquifers. Among them, riparian wetlands and floodplains appeared to play a potential role in the As solubilization process (Kocar et al., 2008; Fendorf, 2010). Arsenic enrichment has been identified in many wetland soils (e.g. Anawar et al., 2003; Du Laing et al., 2009). Riparian wetlands and floodplains are organic matter (OM)-enriched zones, adjacent to streams or rivers and are characterized by seasonal flooding. They receive water from three different sources: i) groundwater discharge, ii) subsurface flow and iii) flow from an adjacent surface-water body (Lewis, 1995). During high water levels subsequent to flooding, anaerobic conditions are established and favor the reductive dissolution of wetland soil Fe(III)-oxyhydroxides and associated elements such as As and OM (Davranche et al., 2011; Dia et al., 2015;
3 Grybos et al., 2007; Grybos et al., 2009; Olivié-Lauquet et al., 2001). Following its solubilization, As(V) is reduced to As(III), generally by autochthonous bacteria through detoxification or metabolism processes (Dia et al., 2015). When the water table decreases, the soil solution is reoxidized and newly formed Fe(III)-oxyhydroxides are associated with OM precipitate as colloidal aggregates that are able to trap As (Aström and Corin, 2000; Bauer and Blodau, 2009; Sharma et al., 2011; ThomasArrigo et al., 2014). In these aggregates, colloidal or ionic Fe was shown to act as a bridge between As and OM, thus forming ternary complexes (Ritter et al., 2006; Mikutta and Kretzschmar, 2011). These colloidal aggregates represent a first step in the agglomeration process. The formed solids are expected to settle in the soil porosity following the increase of evapotranspiration and the decrease of the water level. Al-Sid-Cheikh et al. (2015) and Guénet et al. (2016) studied similar agglomerates that were collected directly in a wetland soil matrix (Naizin Kervidy, France). They demonstrated that As was heterogeneously distributed in both Fe-enriched zones and OM-enriched/Fe depleted zones. Al-Sid-Cheikh et al. (2015) used NanoSIMS observations to suggest that As in an OM-enriched/Fe-depleted zone could be associated with OM via thiol (SH) binding sites. However, they showed using X-ray absorption spectroscopy that As was mainly bound to OM via Fe(III)-oxyhydroxides, Fe monomers or small clusters occurring as bridges in the ternary system. As a result, the speciation of As in OM-enriched/Fe-depleted zones is still unknown. However, in order to identify the control exerted by wetlands on As solubilization and dynamics, it is essential to understand and explain all of the processes that are able to solubilize or trap As in this type of environment.
Natural oxidized solids, collected in the wetland soil porosity, result from the agglomeration of colloidal aggregates. Therefore, the objective of the present study was to determine the As speciation in these entities. To make it easier to take samples and quantify the analysis, colloidal aggregates were produced in the laboratory subsequent to anoxic incubations of wetland soil. After the soil solution was sampled and oxidized, the formed aggregates were size-fractionated using filtration and ultra-filtration. A study of
4 the distribution of As, Fe and OM in each size fraction of the oxidized solution was combined with the investigation of As and Fe speciation and OM characterization using multiple techniques. The OM was characterized using THM-GC-MS and fluorescence spectroscopy in each size fraction where the As and Fe speciation was determined by K-edge X-ray absorption spectroscopy (XAS) analysis. The smallest size fractions were investigated using size exclusion chromatography (SEC) combined with an inductive coupled plasma mass spectrometer (ICP-MS) and high-performance liquid chromatography (HPLC) combined with an ICP-MS.
2. Materials and Methods
2.1 Site description and soil sampling
Soil was taken from the Mercy riparian wetland in the Kervidy-Naizin sub-catchment located in Brittany in western France. This sub-catchment has been monitored since 1991 to investigate the effects of intensive agriculture (corn cultures and livestock) on water quality. The hydrological, pedological and geochemical contexts are therefore well documented (Bourrié et al., 1999; Dia et al., 2000; Olivié-Lauquet et al., 2001; Gruau et al., 2004). The sampled uppermost soil horizon was defined as the organo-mineral horizon (Ah) of a planosol (according to the WRB international classification) which contained (wt%; anhydrous basis) OM (15%), clay (42%), quartz (30%) and Fe(III)-oxyhydroxides (3.5%) (Grybos et al., 2007). The dissolved OM (DOM), Fe(II) and trace metal concentrations in the soil solution were found to increase during flooding periods, from 0.83 to 2.5 mmol L−1 (DOM), from 0 to 0.21 mmol L−1 (Fe(II)) and from 0.01 to 0.025 μmol L−1 (As), respectively (Dia et al., 2000; Grybos et al., 2007).
Approximately 5 kg of soil was collected in March 2015 from the surface layer, sieved at 2 mm and stored in the dark at 4°C to minimize latent biological activity.
5 2.2 Production of colloidal aggregates
To reproduce the reducing conditions observed in wetland soils, a soil suspension was prepared under anoxic conditions in a Jacomex anaerobic chamber. The soil suspension was prepared in triplicate following the protocol given in Grybos et al. (2007). Approximately 130 g of the sieved soil was mixed with 1.8 L of a synthetic solution containing 0.48 mmol L-1 of NaNO3 and NaCl, and 0.1 mmol L-1 of
Na2SO4. The synthetic solution was adjusted to mimic the anionic composition of the soil solution during
autumn (the time period when the water table rises) in the Mercy wetland system. The solution was continuously stirred throughout the duration of the anaerobic experiment. The experiments were performed in triplicate with an anhydrous soil/solution ratio of 1/20 (soil moisture = 44 wt%). The extended reduction was followed by monitoring the increase in the pH, Eh and Fe2+ and trace element concentration subsequent to the reductive dissolution of the Fe-oxyhydroxides in the soil. After one month under anoxic conditions, the pH, Eh and Fe2+ values reached 7.2, -130 mV and 20 mg L-1 respectively (see supplementary information Figures S1 and S2). The soil suspensions were then filtered using 5 µm cellulose nitrate filters (Sartorius). The three soil solutions were removed from the anaerobic chambers and allowed to oxidize at ambient air in the dark at room temperature and under air extraction during two weeks. Previous kinetic experiments (see supplementary information Figure S3) revealed that an equilibrium in the elemental size distribution was reached after two weeks of oxidation. The triplicates were then size-fractionated using a series of filtration units at 5, 3 and 0.2 µm and ultrafiltrations at 30 and 5 kDa. First, two sequential filtrations using cellulose nitrate membrane filters at 3 µm and 0.2 µm (from Sartorius) were performed and samples were recovered on filters. Then, the 0.2 µm-filtered solutions were ultrafiltered at 30 kDa and then 5 kDa using a Labscale TFF system equipped with two Pellicon XL membranes (PXC030C50 and PXC05C50). An aliquot of each liquid fraction was stored in the dark at 4°C and the remaining suspensions were freeze-dried.
6 2.3 As, Fe and OC concentration measurements
The organic carbon (OC) concentrations in the soil solutions were measured using an organic carbon analyzer (Shimmadzu TOC-V CSH). The accuracy of the dissolved organic carbon (DOC) measurements was estimated to be ± 5% by using a standard solution of potassium hydrogen phthalate. The organic carbon (OC) content in the freeze-dried samples was determined at the INRA SAS laboratory in Rennes, France, using a dry combustion method with a CN Analyzer (Flash EA-1112). The concentration of the Fe(II) from aliquots collected during the reduction of the soil solution were determined with the 1.10-phenantroline colorimetric method (AFNOR, 1982) at 510 nm using a UV-visible spectrometer (UV/VIS Spectrometer “Lambda 25” from Perkin Elmer). The Fe and As concentrations were determined by ICP-MS using an Agilent technologies 7700x at the University of Rennes 1. The samples were pre-digested twice with 14.6 N HNO3 at 90°C, evaporated to complete dryness and then resolubilized with HNO3 at
0.37 mol L−1 to avoid any interference with the DOC during the analysis. A flux of He was injected into a collision cell to remove interference from 40Ar35Cl/75As and 40Ar16O/56Fe. Quantitative analyses were performed using a conventional external calibration procedure (seven external standard multi-element solutions, Inorganic Venture, USA). Rhodium-Rhenium was added online as an internal standard at a concentration level of 300 mg L-1 to correct for instrumental drift and possible matrix effects. Calibration curves were calculated from the intensity ratios of the internal standard and analyzed elements. The international geostandard SLRS-4 was used to control the accuracy and reproducibility of the measurement procedure. The instrumental error on the As and Fe analysis was below 3%. Given that the chemical As and Fe blanks were below the detection limits (respectively 0.003 and 0.07 µg L-1), no correction was needed.
7 2.4 Transmission electron microscopy (TEM) observations
A drop of each size fraction of the oxidized solution (i.e. 3-0.2 µm, < 0.2 µm, < 30 kDa, < 5 kDa) was deposited onto a 300 mesh copper grid coated with a lacey carbon film (Oxford Instruments, S166-3) and dried at room temperature. High-Resolution Electron Microscopy (HREM) investigations were performed on a TEM with a JEOL 100CXII instrument (voltage 100 kV) (THEMIS Analytical Facility at the University of Rennes 1). The elemental composition of the different structures was determined with a JEOL 2100F (voltage 200 kV) equipped with an X-ray energy dispersive spectroscopy (XEDS) detector (Kevex detector with an ultrathin window).
2.5 Organic matter characterization
2.5.1 THM-Gas chromatography-mass spectrometry (THM-GC-MS)
Approximately 2 mg of each freeze-dried sample was introduced into an 80 µL aluminum reactor with an excess of solid tetramethylammonium hydroxide (TMAH – ca. 10 mg). The thermally assisted hydrolysis and methylation (THM) reaction was performed inline using a vertical micro-furnace pyrolyser PZ-2020D (Frontier Laboratories, Japan) operating at 400°C for 1 min. The products of this reaction were injected into a gas chromatograph (GC) GC-2010 (Shimadzu, Japan) equipped with a SLB 5MS capillary column in split mode (60 m x 0.25 mm ID, 0.25 μm film thickness). The split ratio was adapted according to the sample and ranged from 15 to 30. The temperature of the transfer line was 321°C and the temperature of the injection port was 310°C. The oven was programmed to maintain an initial temperature of 50°C for 2 min, then rise to 150°C at 15°C min-1 and then rise to 310°C at 3°C min-1, where it stayed for 14 min. Helium was used as the carrier gas, with a flow rate of 1.0 mL min-1. Compounds were detected using a QP2010+ mass spectrometer (MS) (Shimadzu, Japan) operating in the full-scan mode. The temperature of the transfer line was set at 280°C, the ionization source at 200°C and the molecules were ionized by electron impact using an energy of 70 eV. Compounds were identified on the basis of their full-scan mass
8 spectra by comparison with the NIST library and with published data (Nierop and Verstraten, 2004; Nierop et al., 2005). They were classified into three categories: lignin and tannin markers, carbohydrates and fatty acids. The peak area of the selected m/z for each compound was integrated and corrected by a mass spectra factor calculated as the reciprocal of the proportion of the fragment used for the integration and the entire fragmentogram provided by the NIST library. The proportion of each compound class was calculated by dividing the sum of the areas of the compounds in this class by the sum of the peak areas of all of the analyzed compounds expressed as a percentage. The presented data are an average of the triplicates. We also investigated the presence of organic As species using the arsenobetaine reference compound (C5H11AsO2 (AB) from Sigma Aldrich).
2.5.2 Fluorescence spectral analysis
At each fractionation step, we collected filtrate suspensions. The fractions below 5 µm, 3 µm, 30 kDa and 5 kDa and between 0.2 µm and 30 kDa were analyzed using a spectrofluorometer Perkin-Elmer LS 45 in a 10 mm quartz cuvette (at the Ecole de Chimie de Rennes, France). The three dimensional excitation-emission fluorescence spectra were acquired by collecting individual excitation-emission spectra (290 - 600 nm) over a range of excitation ranging from 240 to 550 nm, with an increment of 5 nm, at a scan speed of 1500 nm/min. The slits were set to 5 nm for both the excitation and emission monochromators. The spectra obtained using this technique were treated PROGMEEF software in Matlab language (Luciani et al., 2008). Since Fe can potentially affect DOM absorbance in the UV region (Poulin et al., 2014; Weishaar et al., 2003), the raw absorbance of the sample at 254 nm was corrected by taking into account the molar absorptivities of Fe(III) (Poulin et al., 2014). We calculated three indices to characterize the OM. The fluorescence index (FI) (McKnight et al., 2001) is the ratio between the emission intensity at λEm 450 nm and λEm 500 nm using a fixed excitation of λEx 370 nm. The Biological index (BIX) (Huguet et al., 2009) is calculated from the ratio between the emission intensities at λEm 380 nm and λEm 430 nm using a fixed excitation of λEx 310 nm. Finally, the Fluorescence Humification index (HIX) (Zsolnay et al.,
9 1999) is calculated as the ratio of λEm 435-480 nm divided by λEm 300-345 nm at 254 nm at a fixed
excitation of 254 nm.
2.6 XAS analysis
2.6.1 Data collection
All size fractions of the oxidized solution were freeze-dried. The obtained powders were pressed into 6 mm pellets and fixed to the support using double-sided adhesive tape. The Arsenic K-edge spectra were collected on the DiffAbs beamline and the Fe K-edge spectra on the LUCIA beamline (Flank et al., 2006) of the SOLEIL Synchrotron (SOLEIL, St Aubin, France). On both beamlines, the monochromators were Si(111) double crystals. The 2nd crystal was bendable on DiffAbs for sagittal focusing. The beam size used for the As K-edge on the sample was 286 x 228 µm. The beam size for the Fe K-edge was 2 x 2 mm. Spectra were collected in fluorescence mode using a 4-element silicon drift diode detector. To prevent beam-induced redox changes, the samples were maintained under vacuum at 70K using a liquid nitrogen cryostat. Spectra were calibrated using sodium arsenate dibasic heptahydrate (Sigma Aldrich).
2.6.2 XAS data analysis
Arsenic and iron XAS spectra were extracted using the Athena software (Ravel and Newville, 2005) including the Autbk algorithm (Rbkb = 1, k-weight = 3). Normalized spectra were obtained by fitting the pre-edge region with a linear function and the post-edge region with a quadratic polynomial function. The Fourier transform of the k3-weighted EXAFS spectra was calculated over a range of 2-10.5 Å−1 using a Hanning apodization window (window parameter = 1). Back Fourier filters were extracted over the 1-3.5 Å R-range, using the same apodization window shape.
The EXAFS data were analyzed by shell fitting using the software code Artemis (Ravel and Newville, 2005). Theoretical back scattering paths for the fits were calculated from the various crystal structures using FEFF6. Scorodite (Kitahama et al., 1975), tooeleite (Morin et al., 2007) and
10 nitrobenzenearsonic acid (Nuttall and Hunter, 1995) structures were used to extract paths from the backscatters of the As(V), As(III) and organic As species, respectively. Goethite (Hazemann et al., 1991) and Fe-carboxylate (Horcajada et al., 2007) structures were used to obtain the backscattering paths for Fe. Shell-fit analyses were performed within the 1-3.5 Å R-range for As and 1.1-3.5 Å for Fe. The best fit was chosen by minimizing the reduced χ² which depends on the number of independent parameters, the number of fitted parameters and the uncertainty of the data points. For As, the addition of multiple scattering tends to improve the quality of the fit (Morin et al., 2002; Voegelin et al., 2007). In the 5-3 µm and 3-0.2 µm fractions, the triangular As-O-O (MS1, degeneracy = 12), collinear As-O-As-O (MS2 degeneracy = 4) and non-collinear As-O-As-O (MS3, degeneracy = 12) paths were added for the fit of the As(V)O4-tetraedron. The MS1 path was constrained by an interatomic distance set to (1 + (2/3)(1/2)) x RAs-O
and a Debye-Waller parameter of σ²As-O. The MS2 path was constrained by an interatomic distance of
2RAs-O and its Debye-Waller parameter was calculated as . The interatomic distance of
MS3 was defined as 2x RAs-O and its Debye-Waller parameter as (Voegelin et al., 2007).
2.7 Arsenic in the < 30 kDa and < 5 kDa fractions 2.7.1 SEC-ICP-MS
The distribution of Fe, OM and As in the fractions below 30 kDa and 5 kDa was investigated using a separation method via the SEC-ICP-MS technique. The separation was achieved using two online SEC NUCLEOSIL® 50 columns (250 mm x 4.6 mm) composed of unmodified spherical silica (50 Å pore size) from Macherey-Nagel, attached to an Agilent 1260 Infinity HPLC system (Agilent Technologies France) fitted with an autosampler. The columns were equipped with a prefilter/guard column (UltraShield UHPLC Trident Direct) with a cutoff of 0.45 μm (Restek Corporation). The mobile phase consisted of a sodium dodecyl sulfate (SDS, purity ≥ 98.5%), sodium nitrate (NaNO3, purity ≥ 99.5%), and sodium citrate
11 Aldrich. Stock solutions of 0.1 mol L-1 SDS, 0.1 mol L-1 NaNO3 and 0.1 mol L-1 SC were prepared in
ultrapure water (Milli-Q-water, Millipore system) and filtered at 0.2 µm (with cellulose acetate filters from Sartorius, Germany). The mobile phase composition was obtained by mixing 5% SDS, 10% NaNO3
and 5% SC using an Agilent quaternary pumping system. The injection volume was 50 μL. The mobile phase flow rate was 0.9 mL min−1, and the pressure was constant at around 235 bars. The SEC columns were followed by an Agilent UV detector from a 1260 Infinity system (excitation λ = 254 nm, emission λ = 410 nm) for organic molecules and an Agilent 7700 ICP-MS (Agilent Technologies, France) for the other elements. A similar volume of 100 µL was injected for all of the samples. Before entering the ICP-MS, the effluent passed through an interface in which tellurium was mixed in as an internal standard. This set-up allows the elemental composition to be determined as a function of particle size.
In order to investigate the potentially present dissolved As species, the relevant As(III) and As(V) standards were used. They included i) two inorganic As species: sodium arsenite (Fluka Analytical) at 37 µg L-1 and sodium arsenate dibasic heptahydrate (Inorganic Ventures) at 28 µg L-1, and ii) three organic methylated species at approximately 18 µg L-1: disodium methylarsenate hexahydrate, CH3AsNa2O3
(MMA), dimethylarsenate, C2H7AsO4 (DMA) and trimethylarsonio acetate or arsenobetaine, C5H11AsO2
(AB) from Sigma Aldrich.
2.7.2 HPLC-ICP-MS
High-performance liquid chromatography (HPLC) paired with inductively coupled plasma mass spectrometry (ICP-MS) has previously been used to characterize As compounds in < 30 kDa and < 5 kDa fractions (Geiszinger et al., 2002; Dobran and Zagury, 2006; Ronkart et al., 2007; Huang and Matzner, 2007). The mobile phase consisted of NaH2PO4 (PBS, 2 mmol L-1), NaNO3 (3 mmol L-1), CH3COONa (10
mmol L-1), EDTA-2Na (0.2 mmol L-1) and CH3OH (1%) (Sigma-Aldrich) at pH 11 and filtered at 0.2 µm
12 phase flow rate of 0.9 mL min−1. An anionic column G3154A from Agilent Technologies 1100 Series (Tokyo, Japon) equipped with a guard column was used. The sample was injected with an autosampler (Agilent Technologies 1100 Series), using a 100 µL aliquot. In order to interpret the chromatograms, the same relevant reference materials previously used for the SEC-ICP-MS experiment were analyzed with an injection volume of 30 µL.
3. Results
3.1 Chemical composition of the soil solution
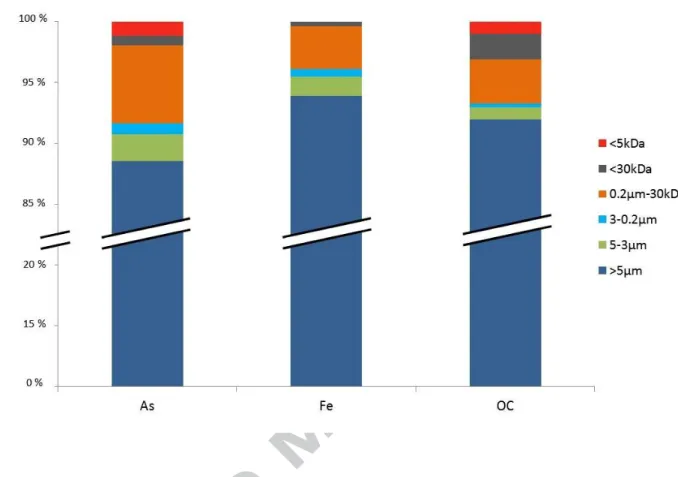
The Fe, As and OC concentrations in the different size fractions are plotted in Figure 1. In all of the fractions, OC was the most abundant varying between 102 and 129 mg g-1 in the first three fractions and increasing to 320 mg g-1 and 340 mg g-1 in the 0.2 µm-30 kDa and < 30 kDa fractions, respectively. In the < 5 kDa fraction, the OC concentration decreased to 132 mg g-1. The Fe distribution varied compared to the OC. The Fe concentrations increased from 23 mg g-1 in the > 5 µm fraction to 69 mg g-1 in the 0.2 µm-30 kDa fraction. The 0.2 µm-µm-30 kDa fraction was the richest Fe and OM fraction. In the < µm-30 kDa and < 5 kDa fractions, the Fe concentration dropped significantly to 13 mg g-1 and 1 mg g-1, respectively. Therefore, most of the Fe was present as particles (> 0.2 µm) and large size colloids (between 0.2 µm and 30 kDa) where the Fe/OC ratio was the highest. The smaller fractions (< 30 kDa) were Fe-depleted and OC-enriched and the Fe/OC ratio was the lowest.
Above the 30 kDa fraction, the As distribution followed that of Fe. The As concentration increased from 5 µg g-1 in the < 5µm fraction, to 30 µg.g-1 in the 0.2 µm -30 kDa fraction, via a plateau at 15 mg g-1 in the 5-3 µm and 5-3-0.2 µm fractions. Approximately 20% of the As was in the < 5-30 kDa fraction. Below this threshold, As decreased less drastically than Fe and their concentrations were weakly correlated, indicating that small-size Fe species might not affect As partitioning. No apparent correlation was observed between the distributions of As and OC.
13 The concentrations of As, Fe and OC were calculated relative to the total dry mass recovered for each fraction. The results are given in % in Figure 2. The calculations showed that 88% of the total As, 94% of the total Fe and 92% of the total OCwere present in the > 5 µm fraction since this fraction was the largest in terms of mass. The second fraction in terms of mass for the three elements was the 0.2 µm-30 kDa fraction which was composed of 6% of the total As and 4% of the total Fe and OC.
3.2 High resolution TEM observations of the different fractions
Representative transmission electron micrographs are presented for each fraction in Figure 3. The overall sample was heterogeneous as revealed by the micrographs of the largest fraction (Figure 3A). Micrometric organic compounds such as diatoms and silicate plant (e.g. horsetail) remains were observed (supplementary information Figure S5). The Fe phases were detected through their higher electron density and composition using EDS (Energy dispersive spectrometry) analysis. Goethite-like macro crystals (supplementary information Figure S5) and Fe(III)-oxyhydroxides aggregates (red squares in Figures 3A and B) were observed. Figure 3B shows a close-up of the Fe(III)-oxyhydroxide aggregates comprised of numerous spheroid nanoparticles, the apparent size of which, close to 4 nm, was visible at high resolution (Figure 3C). With the increasing size fractionation, the large compounds were removed and only the dispersed Fe nanoparticles were observed for the 0.2 µm-30 kDa fraction (Figure 3D). The analysis of the < 30 kDa fraction revealed the presence of very scarce small aggregates without any crystal lattice visible (Figure 3E). No aggregates were observed in the < 5 kDa fraction.
3.3 Organic matter characterization
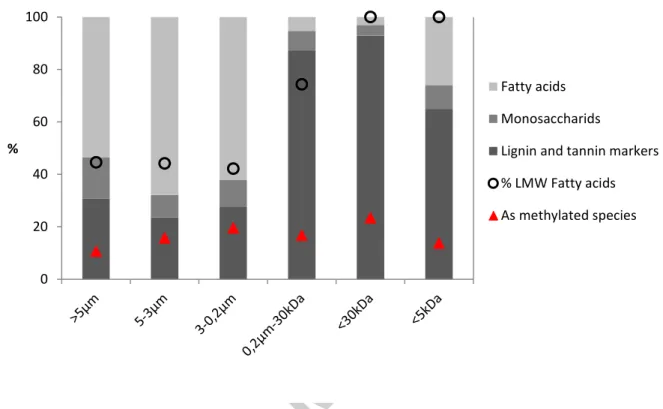
The organic molecular composition of each size fraction was investigated using THM-GC-MS. The different organic compounds, classified into fatty acids, lignin and tannin markers and carbohydrates, are presented in Figure 4. Among the size fractions, two groups with similar compositions could be distinguished according to their size: larger or smaller than 0.2 µm. The larger size fractions were
14 composed of more fatty acids than the smaller fractions (mean values of 61.1 vs. 11.5%) and contained fewer lignin and tannin markers (mean values of 27.4 vs. 81.7%). The increases in the lignin and tannin markers were concomitant with the increase in the OC concentration. The proportion of carbohydrates (or sugars) decreased between the first (mean value of 11.5%) and second group (mean value of 6.9%). Lignin and tannin markers were characteristic of OM derived from plant sources (Hedges and Parker, 1976), whereas carbohydrates and fatty acids were provided both by plant and microbial activities (Cranwell, 1974; Rumpel and Dignac, 2006). Low molecular weight (LMW) fatty acids are used as microbial indicators (Cranwell, 1974) while high molecular weight (HMW) fatty acids are used as plant indicators. The proportion of microbial fatty acids was calculated as the percentage of low molecular weight (LMW) fatty acids (< C19) by excluding C16:0 and C18:0, which can be either derived from plant or microbial input. In our samples, the proportion of high molecular weight (HMW) fatty acids in the > 0.2 µm fractions was higher (from 55 to 58%) than the proportions of LMW fatty acids (from 42 to 45%), whereas the HMW fatty acids in the < 0.2 µm fraction decreased and disappeared in the < 30 kDa and < 5 kDa fractions. A transition at the 0.2 µm threshold between a plant-derived fraction and a microbial-derived one clearly appeared in our samples.
The fragmentograms for all the size fractions displayed the presence of As methylated species. The distinction between AB and DMA was not possible as the THM-GC-MS analysis transformed the AB molecule into DMA. We calculated the distribution of these species in each size fraction as a percentage of the total methylated As detected using the THM-GC-MS technique (red full line in Figure 4).
Indices deduced from the fluorescence analysis are displayed in Figure 5. A mean value of 1.30 for the fluorescence index (FI) was calculated for the > 5 kDa fractions, indicating a terrestrial origin for the OM. In contrast, the < 5 kDa fraction showed a more microbial derived OM with a FI close to 1.49. The Humification index (HIX) increased from 6.25 for the largest fraction to 22 and 30.11 for the 0.2 µm-30 kDa and < 30 kDa fractions, respectively. The HIX evolution showed that OM was more humified in the
15 0.2 µm-30 kDa and < 30 kDa fractions, which also corresponded to the most OC-enriched fractions. The BIX index was constant with an average value of 0.4 indicating that the OM was not freshly produced. In summary, the characterization of the OM suggested the fractions > 0.2 µm were comprised of HMW organic molecules that primarily originated from plant residue. In contrast, the fractions < 0.2 µm were composed of soil humic molecules (such as humic acids). The organic compounds in the < 5 kDa fraction were smaller and were most probably produced by bacterial activities.
3.4 Characterization of the Fe phases using XAS
The Fe K-edge XANES analyses performed on each size fraction were fairly similar. The edge position at 7125 eV associated with a tiny pre-edge at 7114.2 eV and a broad shoulder at 7148 eV reflected octahedral coordinated Fe(III) species in a poorly crystalline phase (see supplementary information Figure S4). The EXAFS spectra and corresponding Fourier transforms (magnitude and imaginary part) of each size fraction as well as ferrihydrite (Fh) as a reference are reported in Figure 6. The EXAFS spectra of the size fractions were fairly similar with three peaks at 4.1 Å, 6.3 Å and approximately 8.4 Å. A small peak close to 7.5 Å was observed in the 5-3 µm, 3-0.2 µm and 0.2 µm-30 kDa fractions and reference Fh, but not in the <30 kDa and < 5 kDa fractions. Two peaks dominated the Fourier transform. The first peak, located at approximately 1.5 Å (R+ΔR), corresponded to the first shell of the neighboring atoms within the FeO6 octahedra. The second peak at approximately 2.6 Å (R+ΔR) arose from the scattering of the Fe
neighbors from the second coordination shell. Shell fits were performed within the 1.1-3.5 A range of the Fourier transformed k3-weighted spectra over a k-range of 2-10.5 Å and are displayed in Figure 6. The resulting EXAFS parameters of the fits are reported in Table 2.
First coordination shell. The first O shell was fitted with approximately six O at a mean distance of 2.00 Å, respectively. These distances corresponded to the Fe-O distances for the octahedra in the
16 Fe(III)-oxyhydroxides (Waychunas et al., 1993). The number of O was later fixed to six to reduce parameter correlations.
Second coordination shell. The second peak at approximately 2.6 Å in the Fourier transforms (Figure 6B) has a major contribution from the Fe neighbors. The spectra for the 5-3 µm, 3-0.2 µm and 0.2 µm-30 kDa fractions displayed a Fe-Fe1 distance of 3.03-3.09 Å, which is characteristic of edge-sharing
FeO6 octahedra (Manceau and Combes, 1988; Manceau and Drits, 1993). A second Fe-Fe2 distance of
3.38-3.49 Å was determined in all of the fractions, specific to double corner-sharing (Manceau and Combes, 1988; Combes et al., 1989; Waychunas et al., 1993; Bottero et al., 1994). In order to accurately model the spectra of the three smallest fractions, a Fe-C distance was added in the fit with 3.8 C at 2.95 Å for the 0.2 µm-30 kDa fraction, 2.4 C at 2.91 Å for the < 30 kDa fraction and 3.3 C at 2.86 Å for the < 5 kDa fraction. The highest OC/Fe concentration ratio was obtained for these three fractions, explaining why it was possible to observe the Fe-C distance. Karlsson and Persson (2010) obtained a similar Fe-C path in Fe bound to peat humic acid. They interpreted this result as the formation of small polynuclear Fe(III)-OM complexes. The 0.2 µm-30 kDa fraction could be considered as an intermediate fraction containing the two Fe-Fe distances (Fe-Fe1 and Fe-Fe2) and the Fe-C distance, while the first Fe-Fe1 distance disappeared in the < 30 kDa and < 5 kDa fractions. In agreement with Hoffmann et al. (2013), these distances provided evidence of the presence of small Fe clusters and/or Fe(III)-oxyhydroxide nanoparticles in the 0.2 µm-30 kDa fraction although only small clusters such as dimers or trimers were formed in the < 30 kDa and < 5 kDa fractions.
3.5 Speciation of Arsenic by X-ray Absorption Spectroscopy
As K-edge XANES. The speciation of As in the different size fractions was determined by comparing the XANES sample with known references. The spectra for the fractions and inorganic As(III) and As(V) references are reported in Figure 7. The white line energies observed for arsenite (11872.4 eV) and arsenate (11875.5 eV) corresponded to the literature (Smith et al., 2005). The white line peak
17 positions were obtained from the point where the first derivative of the spectrum crossed zero. The fractions exhibited a peak maximum at 11875.6 eV for the 5-3 µm fraction, 11875.2 eV for the 3-0.2 µm fraction and 11874.8 eV for the 0.2 µm-30 kDa fraction, close to the white line value of arsenate. They exhibited a shoulder at lower energy (close to 11872.3 eV), the intensity for which increased with the size fractionation. The shoulder and white line positions corresponded to a mixture of inorganic As(III) and As(V) (Guénet et al., 2016). The spectra for the < 30 kDa and < 5 kDa fractions exhibited a single peak at 11874.0 and 11874.2 eV, respectively. These values did not correspond to inorganic species. Prior studies investigating the white line positions for multiple As compounds revealed that As(V) organic compounds such as AB, DMA and MMA have an intermediate white line position due to the difference in the electronegativities of O and C (Arčon et al., 2005; Smith et al., 2005; Lombi et al., 2009). The core electrons of the As atoms in an As-C bond are more easily photoionized than the 1s electrons of As in an As-O bond. The white line position observed for the < 30 kDa and 5 kDa fractions could thus be attributed to As(V)-methylated compounds such as AB, DMA or MMA. The distinction between each species is prevented by the inability of XANES to discriminate between two aliphatic substituents on the C backbone (George and Pickering, 2007).
As K-edge EXAFS. The As K-edge EXAFS data and corresponding Fourier-Transform of each size fraction are reported in Figure 8. Due to a lower concentration in As, the quality of the data for the < 30 kDa and < 5 kDa fractions had a poorer signal/noise ratio compared to the larger size fractions. However, the quality was good enough to extract information. From the 5-3 µm fraction to the 0.2 µm-30 kDa fraction, the EXAFS spectra exhibited a shoulder at 5.05 Å-1. The second oscillation was characterized by a slight double-hump feature at approximately 6.55 and 7.55 Å-1. The amplitude of the second hump decreased at the expense of the first one with the decreasing size fraction. The third oscillation was not well-defined for the < 30 kDa and < 5 kDa fractions but was composed of one peak at 9.05 Å-1 for the 0.2 µm-30 kDa fraction, which exibited an increasing shoulder with the increasing size fraction. The main
18 peak in the Fourier transform was located at R + ΔR ~1.3 Å and corresponded to the first neighboring shell. With the decreasing size fraction, the width of the first peak increased until it formed two separate peaks in the < 30 kDa and < 5 kDa fractions at 1.07 and 1.56 Å, respectively. The 0.2 µm-30 kDa, < 30 kDa and < 5 kDa fractions exhibited two additional small peaks at R + ΔR ~2.4 Å and ~3.2 Å, accounted by for the second coordination shell neighbors, whereas the 5-3 µm and 3-0.2 µm fractions exhibited non-distinct peaks at R + ΔR ~2.2 Å, 2.5 Å and 3.0 Å. In order to explore the local As coordination, fits were performed within the 1-3.5 Å R-range (Figure 8). The fitted parameters and constraints for the references and each size fraction are reported in Table 1.
First shell. The samples can be divided into two groups according to their first shell shape and fit. In the first group, made up of the largest fractions (i.e. 5-3 µm, 3-0.2 µm and 0.2 µm-30 kDa), between 3.6 and 4.3 O were needed to accurately fit the first shell at a distance of 1.72-1.73 Å for both the 5-3 µm and 3-0.2 µm fractions and 1.77 Å for the 0.2 µm-30 kDa fraction. In the second group, comprising the smallest fractions, the two peaks were successfully fitted using two paths. The first one was As-O with 0.9 O at 1.74 Å and 0.8 O at 1.66 Å for the < 30 kDa and < 5 kDa fractions, respectively. The second one was As-C with 4.4 C at 1.92 Å and 3.2 C at 1.97 Å for the < 30 kDa and < 5 kDa fractions, respectively. The values for the As-C distances were in agreement with Miot et al. (2008), who obtained an As-C distance of 1.91 Å, in the AB compound.
These EXAFS results refined the XANES observations by showing that the methylated As species were dominant in the < 30 kDa and < 5 kDa fractions but that inorganic As persisted.
Second coordination shell. An As-Fe distance was used to fit the second coordination shell for all of the fractions. These distances varied between 3.33 and 3.40 Å. They were in agreement with the distances reported for As(III) and As(V) monodentate binuclear corner-sharing complexes (2C) where As(III) and/or As(V) were bound to the apical O atoms of two edge-sharing FeO6 octahedra (Waychunas
19 residual between the fit and the spectra was high, suggesting the contribution of an additional neighbor in the second coordination shell. A path with an interatomic As-Fe distance of 2.89 Å, corresponding to As(III) edge-sharing complexes (E2) (Ona-Nguema et al., 2005) was tested. However, the Debye-Weller value for the fit was negative thereby excluding this bonding. A second As-C path (via O binding) was tested. A better fit was obtained with a distance of 2.85 Å for the 5-3 µm fraction and 2.86 Å for the 3-0.2 µm fraction. The presence of other light atoms was also considered but finally ruled out because they would result in longer interatomic distances for Ca and Al (Arai et al., 2001; Bardelli et al., 2011) or a shorter interatomic distance for S (Hoffmann et al., 2014).
3.6 Arsenic speciation using SEC-ICP-MS and HPLC-ICP-MS
The size separation of the As reference materials is shown in Figure 9A. The retention times for the As references were 4.8 min for dissolved As(V), 5.3 min for MMA, 7.1 min for DMA and 9.8 min for dissolved As(III). The retention times of OM, Fe and As in the < 30 kDa and < 5 kDa fractions are given in Figures 9B and C. The Fe signal derived from the SEC-ICP-MS analysis was parallel to the UV signal corresponding to organic molecules. They were both comprised of a peak at 4.35 min and a shoulder at 4.80 min. This coelution indicated that Fe and OM are associated in two close sizes. No signals for the dissolved As(III), MMA or DMA were detected in either fraction. The As signal followed the Fe-OM association signal. For the < 5 kDa fraction, a small peak matched the main peak of the Fe-OM signal but a higher peak matched the Fe-OM signal shoulder. For the < 30 kDa fraction, two peaks that are quite similar in intensity were observed. The second peak at 4.8 min observed for As also matched that of the As(V) reference in the solution (Figure 9A). Two hypotheses can be considered: i) all of the As species were associated with Fe-OM aggregates, the size of which corresponded to the 4.8-min retention time or ii) a portion of As(V) remained in the solution.
Results from the HPLC-ICP-MS analysis are shown in Figure 9D. The chromatograms revealed that As was mainly present as As(V) with a retention time of 7.6 min. Three other peaks were observed at 2.3, 2.9
20 and 3.3 min and were attributed to AB, DMA and As(III) dissolved in solution, respectively. The amount of As(III) was much lower in the < 5 kDa fraction than in the < 30 kDa fraction. Both of the organic As species were methylated As(V). A systematic shift of approximately 0.15 min was observed between the samples and each standard. This can be explained by the difference in the injected volume, which was 30 µL for the standard versus 100 µL for both fractions. Neubauer et al. (2013) demonstrated that the retention time increases with the sample load. As the peaks were distant from each other, it was not possible to misidentify them; therefore the time shift was not corrected. The determination of the concentration of each As species was performed by injecting reference compounds at various concentrations. Recovery of each species was estimated by directly injecting the sample in the ICP-MS and comparing both concentrations. The total recovery of the injected standard solutions was close to 90%. However, the total recovery was only 65% for the < 5 kDa fraction and 32% for the < 30 kDa fraction, suggesting that a sample matrix effect through the column could have occurred.
It is important to note here that the HPLC-ICP-MS technique can only be used to detect dissolved species. However, the SEC-ICP-MS analysis showed that the As species was co-eluted with Fe/OM associations, i.e. As was bound to the Fe/OM associations. The detection of As species by HPLC-ICP-MS could result in a release of As species subsequent to a solubilization of Fe/OM favored by the presence of EDTA, which is a strong Fe complexing agent, in the mobile phase of the HPLC column. This hypothesis was confirmed by the detection of Fe in the column solution outlet via ICP-MS measurements. The EDTA seemed to impact the release of inorganic and organic As species differently. Therefore in our study, HPLC only provided information on the presence/absence and relative proportion between each detected As species in the < 30 kDa and 5 kDa fractions.
21 4. Discussion
4.1 As speciation as a function of the size fraction
Our results showed that the speciation and distribution of Fe and As, as well as the composition of the OM, varied according to the molecular size fractions in the oxidized soil solution.
5-3 µm and 3-0.2 µm fractions. As revealed by the TEM images, the fractions were heterogeneous. Above 0.2 µm, a major mass fraction was composed of silicate, the remains of plant stems and diatoms. The OM in both the 5-3 µm and 3-0.2 µm fractions was composed of small degraded organic compounds that originated from plants (i.e. leaves and root remains) with a high proportion of fatty acids. Iron was present as aggregates of nanoparticles embedded in the OM (Table 2). The low degree of polymerization (i.e. crystal growth), evidenced by the TEM and XAS analyses, could be explained by the high amount of OM which impairs the crystal growth of the Fe(III)-oxyhydroxides (Cornell and Schwertmann, 2003; Pédrot et al., 2011). Scarce well-formed Fe crystals were assumed to have been inherited from the soil and therefore preserved from the reductive dissolution. Arsenic occurred mainly as As(V). A strong correlation existed between the As and Fe concentrations (Figure 1A), indicating that most of the As was associated with Fe particles and aggregates. The specific surface of the nanoparticle aggregates was expected to be higher than the well crystallized Fe(III)-oxyhydroxides (Hiemstra and van Riemsdijk, 2007). Arsenic was therefore more likely to be bound as a bidentate complex to Fe nanoparticles aggregates (Ona-Nguema et al., 2009). The As K-edge EXAFS revealed the presence of an interatomic As-C distance of 2.85 Å suggesting the presence of As as organic compounds, probably inherited by the biological activities or matter. Several studies have hypothesized the binding of As to OM carboxylic or phenolic sites (Redman et al., 2002 ; Buschmann et al., 2006). Buschmann et al. (2006) suggested the formation of an As(V)-HA complex due to an additional chelation and stabilization effect. Dembitsky and Rezanka (2003) suggested that the inorganic As was complexed to carboxylic groups during the uptake by plants or fungi. The GC-MS analysis also revealed the presence of a small
22 amount of arsenobetaine (AB); however the concentration for AB was so low that it could not be evidenced by XAS (no As-C distance observed at 1.98 Å), which is an averaging tool. The significant binding of As with the Fe phase meant that it was not possible to detect the As-C distance of 1.98 Å, which was masked by the presence of a large amount of stronger backscattering Fe neighbors in the EXAFS spectra (Table 2). Arsenobetaine was primarily found in marine environments but has also been shown to occur in terrestrial organisms such as mushrooms, earthworms, plants and soils (Huang and Matzner, 2007). Its formation was considered to be a detoxification mechanism used by organisms (Tamaki and Frankenberger, 1992). Arsenobetaine was probably adsorbed to Fe(III)-oxyhydroxides, as previously observed for other As methylated species (Bowell, 1994; Cox and Ghosh, 1994). Methylated As can also be taken up by plants which translocate the As from the soil to their tissues (Hitbold, 1975; Geiszinger et al., 2002). Since, in the 5-3 µm and 3-0.2 µm fractions, the OM appeared to originate from plants, As methylated compounds could also be included in the plant remains.
0.2 µm-30 kDa fraction. This size fraction represented the most concentrated fraction in the Fe and OM. These distributions were consistent with the ultrafiltration analysis of the shallow groundwater from the wetland in which the present soil was sampled (Pourret et al., 2007). Pourret et al. (2007) noticed that most of the Fe occurred as Fe-OM colloids, the size of which ranged from 0.2 µm to 30 kDa. Here, the Fe was identified as occurring as nanoparticles aggregated or dispersed in the OM matrix (Figure 3). Compared to the high molecular size fractions, where carboxylic groups (within fatty acids) were dominant, the GC-MS analysis showed that the OM in this fraction was mainly composed of lignin and tannin markers which are more enriched in phenol groups. The complexation capacity of the phenolic groups is stronger than the carboxylic groups which implies a higher reactivity of this fraction toward metallic ions such as Fe (Tipping, 1998). Arsenic was present as a mixture of As(III) and As(V). Guénet et al. (2016) provided evidence that, in natural Fe-OM colloidal agglomerates, the OM prevents total As(III) oxidation by controlling the Fe species as Fe monomer/small clusters and weakly polymerized
23 Fe(III) oxyhydroxides. The formation of these Fe species leads to the decrease of active adsorption sites for As oxidation. Arsenic reached its highest concentration and was strongly correlated with Fe in this fraction, indicating that the As was adsorbed by the Fe(III) phases (Figure 1). These results were supported by the EXAFS measurements where As appeared as highly bound to Fe. However, the THM-GC-MS analysis also detected the presence of AB.
< 30 kDa and < 5 kDa fractions. Unlike the OC, the Fe concentration strongly decreased in these fractions. Fe was almost completely removed after this ultrafiltration step. The Fe formed small clusters as evidenced by the absence of an Fe-Fe distance at 3.03 Å and the fitting of the Fe-Fe distance at 3.44 Å, which corresponds to corner-sharing Fe(O,OH)6 octahedra. The absence of a Fe(III)-oxyhydroxide phase
was consistent with the TEM images where no Fe-nanoparticles were observed. The clusters were embedded in an OM matrix as revealed by the interatomic Fe-C distance of 2.9 Å. Organic matter is able to strongly bind Fe(II, III) through its carboxylic or phenolic groups (Liang et al., 1993; Tipping et al., 2002; Catrouillet et al., 2014). The stability constant of the Fe(III)-phenol complex, log K, is equal to 8.40 versus 4.01 for the Fe-acetate complex at an ionic strength of 0 (Sommer and Pliska, 1961; Desai and Milburn, 1969). Because the LMW OM was expected to contain more phenolic compounds, these fractions were highly reactive towards Fe.
A weak correlation between As and Fe was calculated for this LMW fraction which suggested that As was less associated with the Fe phases. The HPLC-ICP-MS and XAS analysis revealed the presence of As organic species where the oxidized As(V) was methylated as AB, MMA and DMA. In our experiment, the analysis of the soil solution before oxidation did not show any AB or DMA, which are therefore produced during the oxidation of the soil solution. Sohrin et al. (1997) observed, in a eutrophic lake, a seasonal variation in the concentration of the methylated As species produced under an oxidative condition and which decomposed to inorganic As under an anoxic condition. The presence of close to 30% of the methylated species combined with the presence of AsO4 explained the weak As/Fe correlation. However,
24 the As K-edge EXAFS spectra showed that part of the As was bound to Fe as monodentate binuclear corner-sharing complexes (2C) on the small Fe clusters. Considering the Fe-C distance of 2.8 Å as well as the As-Fe distance of 3.43 Å, ternary complexes were possibly formed in the LMW fractions (Mikutta and Kretzschmar, 2011; Sharma et al., 2011; Hoffmann et al., 2013), which was confirmed by the coelution of Fe, As and OM in the SEC-ICP-MS analysis.
4.2 Implications for As dynamics in wetlands
In previous studies, Al-Sid Cheikh et al. (2015) and Guénet et al. (2016), using a NanoSIMS analysis of agglomerate solids produced during the oxidizing period in our studied wetland, showed that the As distribution was highly heterogeneous with i) As associated with Fe-enriched zones and ii) As associated with OM-enriched/Fe-depleted hotspots. To explain this observed colocalization of As and OM, Al-Sid-Cheikh et al. (2015) suggested the binding of part of the As as As(III) to the OM thiol (SH-) functional groups. Unfortunately, the present results did not support this assumption; no As-S distances were detected in the EXAFS spectra for any size of the fractions, even in the lowest fraction. Therefore, the association between As and OM must be explained by a new mechanism. The present results demonstrated the presence of a significant amount of As as As(V) organic species, notably in the large size fractions (between 5 and 0.2 µm) (Figure 2). These As(V) organic species, which came from plants and organisms, did not directly depend on the prevailing redox conditions. The detoxification processes for the organisms, activated by the production of dissolved As, was the mechanism that most probably controlled the production of these organic As(V) species (Dembitsky and Rezanka, 2003; Foster and Kim, 2014). A proportion of this organic As(V) species was scavenged in plants and organisms although a second part was probably excreted and subsequently adsorbed to the Fe phases. The organic As(V) species in the residue from the organisms might explain the colocalization of As and OM observed by the NanoSIMS in the OM-enriched/Fe-depleted hotspots (Al-Sid Cheikh et al., 2015; Guénet et al., 2016).
25 Considering the wet mass of each size fraction, close to 92% of the As (inorganic and organic) was found in the > 0.2 µm fractions, i.e. in the particulate fractions. With regards to these large sizes, these particles were not mobile since they could settle rapidly and easily. Larger particles can be regarded as the own particles of the soil that have been suspended in solution by the experimental design. Thus, the present results demonstrated that a large proportion of the As was i) involved in a biological mechanism and integrated in the particulate biological materials and ii) bound to non-mobile Fe particles (> 0.2 µm particulate fractions). Both mechanisms favored the trapping of As in the wetland soil. The 0.2 µm-30 kDa fraction was the most Fe-enriched phase. In this size fraction, the As speciation was mainly controlled by its binding to poorly ordered Fe(III)-oxyhydroxides. Being in the colloidal size, this fraction might be considered as mobile and able to transport As up to rivers or aquifers along with the water movement. Close to 6% of the As was in this size-fraction, which was small with regards to the larger size fraction. Finally, below 30 kDa, the fractions were mainly comprised of organic colloids and/or molecules. In this smaller size fraction, As was present as inorganic species (arsenite and/or arsenate) and as organic As(V) species. Both seemed to be bound to the colloidal phases either via a direct interaction or via Fe monomers or small clusters, in a ternary system, with organic colloids. Stolpe and Hassellöv (2007) demonstrated that, in aquatic systems, organic-rich colloids are more mobile than Fe-rich colloids, which are subject to aggregation and sedimentation. For both the 0.2 µm-30 kDa and < 30 kDa fractions, the mobility of As will be controlled by the ability of the colloids to be maintained in solution relative to their affinity with the soil components and water flux in the soil porosity where they were produced. However, it should be noted that the potential (bio)degradation of organic As(V) species as inorganic As(V) (Ritchie, 2004) should be considered although their binding to colloids should decrease their (bio)degradation.
These results shed new light on the control of the As dynamics by wetlands. Wetlands are often regarded as sources of As for groundwater and/or rivers (Kocar et al., 2008; Polizzotto et al., 2008;
26 Fendorf, 2010; Neubauer, Köhler, et al., 2013; Neubauer, v.d. Kammer, et al., 2013). However, these studies were mainly interested in the < 0.2 µm fraction in the water sample. They demonstrated that the As was released in the solution as labile inorganic species or bound to Fe/OM colloids. The present work showed that the most removable As was the As that was bound, not only as inorganic species but also as organic species, to colloids with a size < 0.2 µm. The proportion (8%) of this As was low with regards to the As contained in the higher size fractions, in which the As speciation seemed to be controlled by the biological activity and binding to particulate Fe-oxyhydroxides. Therefore, if riparian wetlands are able to produce labile As(III) under the reducing period (Takahashi et al., 2004; Fendorf, 2010), several mechanisms could interfere in its transfer to rivers and aquifers and therefore limit As mobility. The most studied As is the As bound to soil particulates or colloidal Fe(III)-oxyhydroxides; the latter, as shown here and elsewhere, is closely associated with OM (Pokrovsky and Schott, 2002; Stolpe and Hassellöv, 2007; Neubauer, Köhler, et al., 2013). A second mechanism concerns the biological uptake of As (e.g. for the detoxification process), resulting in the production of organic As(V) species that can be scavenged by plants and organisms or bound to Fe(III) oxyhydroxides. This decrease in As mobility, subsequent to the establishment of oxidizing conditions, was previously discussed by Frohne et al. (2014) and Shaheen et al. (2016). The proposed mechanism was the precipitation of Fe(III)-oxyhydroxides and subsequent As binding. However, the present results provided evidence that this process was not the only one and is not be the most important in riparian wetlands.
5. Conclusion
In this study we provided new insight in the control of As behavior during the oxidation of a reduced wetland soil solution. We highlighted the large variation in As speciation in the various size compartments of a suspension provided by the reoxidation of a riparian wetland soil solution. In the oxidized solution, As is mostly bound to Fe and to OM via C. Three main products were evidenced: i)
27 particulate biological material inherited from soil biological activities, ii) Fe-OM-rich colloids with a size ranging from 0.2 µm to 30 kDa and ii) OM-rich colloids below 30 kDa in which Fe was present as monomers or small clusters. The characterization of the OM revealed that the fractions above 0.2 µm were mainly composed of fatty acids (with carboxyl groups) whereas the < 0.2 µm fractions, lignin and tannin markers (with phenolic groups) were in the majority. The 0.2 µm-30 kDa fraction corresponded to a transition phase in terms of degradation and the composition of the main functional group. Fractions < 30 kDa were enriched in phenolic groups suggesting a higher affinity for Fe as confirmed by the EXAFS records where Fe-C was detected in the < 30 kDa fraction. Despite oxidizing conditions, a small amount of reduced inorganic As was still present in the sample. Arsenic occurred as As(III) or As(V) bound to Fe(III) as particulates, colloids or small clusters. Most surprisingly, methylated As(V) species were formed during the oxidation period and detected in all of the size fractions. These organic As(V) species are usually biologically produced and could be bound to Fe(III) as particulates, colloids or clusters, to colloidal OM or could remain integrated in the biological residual material found in the soil.
We provided evidence that As was primarily distributed in the high size fraction (> 0.2 µm), i.e. in the non-transferable fractions of the suspension. Only 8% of the As was present in the smaller fractions that was expected to be removable.
Acknowledgements
We acknowledge the SOLEIL synchrotron for provision of synchrotron radiation facilities and we would like to thank the beamlines staff for their support, especially D. Thiaudière for his assistance on the DiffAbs beamline. Dr. S. Mullin is acknowledged for post-editing the English style (http://www.proz.com/profile/677614).
This study was funded by the French ANR through the “Programme Jeunes Chercheurs” (ANR-JC-11-JS56-0010, ARSENORG) and by the IUF (Institut Universitaire de France) allocation of Melanie Davranche.
28 Bibliography
AFNOR (1982) Essais des eaux - Dosage du fer - Méthode spectrométrique à la
phénantroline-1,10.
Al-Sid-Cheikh M., Pédrot M., Dia A., Guenet H., Vantelon D., Davranche M., Gruau G. and
Delhaye T. (2015) Interactions between natural organic matter, sulfur, arsenic and iron
oxides in re-oxidation compounds within riparian wetlands: NanoSIMS and X-ray
adsorption spectroscopy evidences. Sci. Total Environ. 515-516, 118–128.
Anawar H. M., Akai J., Komaki K., Terao H., Yoshioka T., Ishizuka T., Safiullah S. and Kato K.
(2003) Geochemical occurrence of arsenic in groundwater of Bangladesh: sources and
mobilization processes. J. Geochem. Explor. 77, 109–131.
Arai Y., Elzinga E. J. and Sparks D. L. (2001) X-ray Absorption Spectroscopic Investigation of
Arsenite and Arsenate Adsorption at the Aluminum Oxide–Water Interface. J. Colloid
Interface Sci. 235, 80–88.
Arčon I., van Elteren J. T., Glass H. J., Kodre A. and Šlejkovec Z. (2005) EXAFS and XANES
study of arsenic in contaminated soil. X-Ray Spectrom. 34, 435–438.
Aström M. and Corin N. (2000) Abundance, sources and speciation of trace elements in
humus-rich streams affected by acid sulphate soils. Aquat. Geochem. 6, 367–383.
Bardelli F., Benvenuti M., Costagliola P., Di Benedetto F., Lattanzi P., Meneghini C., Romanelli
M. and Valenzano L. (2011) Arsenic uptake by natural calcite: An XAS study. Geochim.
Cosmochim. Acta 75, 3011–3023.
Bauer M. and Blodau C. (2009) Arsenic distribution in the dissolved, colloidal and particulate
size fraction of experimental solutions rich in dissolved organic matter and ferric iron.
Geochim. Cosmochim. Acta 73, 529–542.
Bottero J. Y., Manceau A., Villieras F. and Tchoubar D. (1994) Structure and mechanisms of
formation of FeOOH(Cl) polymers. Langmuir 10.
o rr G., Trolard ., Ja re c J.- . . G., a tre . and Abdelmoula M. (1999) Iron control
by equilibria between hydroxy-green rusts and solutions in hydromorphic soils. Geochim.
Cosmochim. Acta 63, 3417–3427.
Bowell R. J. (1994) Sorption of arsenic by iron oxides and oxyhydroxides in soils. Appl.
Geochem. 9, 279–286.
Buschmann J., Kappeler A., Lindauer U., Kistler D., Berg M. and Sigg L. (2006) Arsenite and
arsenate binding to dissolved humic acids: Influence of pH, type of humic acid, and
aluminum. Environ. Sci. Technol. 40, 6015–6020.
29