HAL Id: halshs-00967229
https://halshs.archives-ouvertes.fr/halshs-00967229v3
Preprint submitted on 19 May 2014HAL is a multi-disciplinary open access archive for the deposit and dissemination of sci-entific research documents, whether they are pub-lished or not. The documents may come from teaching and research institutions in France or
L’archive ouverte pluridisciplinaire HAL, est destinée au dépôt et à la diffusion de documents scientifiques de niveau recherche, publiés ou non, émanant des établissements d’enseignement et de recherche français ou étrangers, des laboratoires
Does Education Affect Risk Aversion?: Evidence from
the 1973 British Education Reform
Seeun Jung
To cite this version:
Seeun Jung. Does Education Affect Risk Aversion?: Evidence from the 1973 British Education Reform. 2014. �halshs-00967229v3�
WORKING PAPER N° 2014
– 13
Does Education Affect Risk Aversion?:
Evidence from the 1973 British Education Reform
Seeun JungJEL Codes: C36 ; I21 ; I28 ; J24
Keywords: Risk Aversion; Education Reform; Instrumental Variable
P
ARIS-
JOURDANS
CIENCESE
CONOMIQUES48, BD JOURDAN – E.N.S. – 75014 PARIS
TÉL. : 33(0) 1 43 13 63 00 – FAX : 33 (0) 1 43 13 63 10
Does Education Affect Risk Aversion?:
Evidence from the 1973 British Education Reform
Seeun Jung
Paris School of Economics
Abstract
Individual risk attitudes are widely used in order to predict decisions regarding education. These uses of risk attitudes as a control variable for education decisions, however, have been criticized due to potential reverse causality. The causality be-tween risk aversion and education is not clear, and it is hard to disentangle the different directions. We here investigate the causal effect of education on risk aver-sion by looking at the 1973 British Education Reform. With the educational reform in 1973 when the end of compulsory education increased from 15 to 16, it is pos-sible to see the average treatment effect of education reform on the individual risk attitude for different cohort groups. We find that years of schooling increase risk aversion level via IV2SLS, which is contrary to the existing literature to our
knowl-edge. This result is especially stronger for those with lower education. We suggest that in early education, education makes individuals more risk averse, whereas in more adult education such as tertiary education, years of schooling diminish risk aversion as suggested in other literatures. In addition, this negative causal effect of education on risk aversion could relieve our concerns about the endogeneity/reverse causality issue when using risk aversion as an explanatory variable for education decisions, because the sign would still credible as coefficients are underestimated. JEL Classification: C36 ; I21 ; I28 ; J24
Keywords: Risk Aversion; Education Reform; Instrumental Variable
1
Introduction
Can risk aversion explain individual educational decisions? In human capital theory, ed-ucation is generally perceived as an investment in the future since the worker is giving up present earnings for potentially higher income later. Though future wages, unemploy-ment and economic labor market conditions are unknown and fluctuating, they could be greatly affected by the education investment. It is well known that education could re-duce the risk of unemployment and increase wages on average. However, as long as these future wages are still uncertain, education could be perceived as a risk by those who are risk averse, making it an interesting subject for the various economic analyses that have focused on education as an investment in future income. Therefore, education is an important independent variable that individuals choose in order to maximize their total utility. In general, risk-averse workers are not willing to exchange present job certainty for further education. It seems that individuals’ risk attitudes could be closely related to their educational decisions, which leads to future wage differentials.
Many economic analyses have attempted to measure the impact of schooling on future
outcomes. Levhari and Weiss (1974) found that income uncertainty reduces schooling.
Mincer(1974) investigated how the variance of earnings differs across schooling levels over the life cycle. However, as schooling choice is also an endogenous variable, the standard reduced-form technique is not really well-defined. For these reasons, the effects of risk aversion on future consumption smoothing have been studied by only few researchers.
Cameron and Taber (2004),Keane and Wolpin (2001), andSauer (2004) studied the re-lationship between the financing of education and future consumption smoothing, as well as the impacts of borrowing constraints on schooling decisions. They suggested that
also showed empirically that borrowing constraints and parental income have little impact on education decisions. However, one can only reach a conclusion about the first moment of earning distributions. What would be useful to investigate is the relationship between earnings dispersion (wage and employment rate volatility) and education, which has been
studied by Belzil and Hansen (2004). They stress the importance of risk aversion in the
educational decision making by using panel data with dynamic programming models . However, this reasoning is debatable as one is concerned about the role of education in determining individual risk aversion. This literature assumes that risk aversion is uniquely given to individuals and does not vary over time. Yet, it is also suggested that early childhood can determine individual risk aversion as well as other characteristics.
Dohmen et al. (2005) found that risk attitudes are correlated with gender, age, height, and parental background. One finding is that the presence of highly-educated parents diminishes risk aversion. Parents can socialize their children by putting in some effort, and this could lead to a strong correlation between parents’ characteristics and those of their child. Dohmen et al. (2012) provide empirical evidence of the intergenerational transmission of a number of attitudes, including risk aversion.
We explore this issue by carrying out an analysis using the British educational reform in 1973 as a natural experiment. The effect of compulsory schooling on economic
out-comes has been widely studied. Following Acemoglu and Angrist (2001) who estimated
the monetary return to schooling in the United States, the econometric foundation and the economic consequences of the compulsory-schooling change have been widely
ex-amined: it improved educational levels (Lleras-Muney (2002), Goldin and Katz (2008),
Oreopoulos (2006)). Most of the papers about early compulsory schooling follow an
instrumental-variable strategy. Using the British education reform of 1973, Harmon and
Walker(1995) used a standard Mincerian wage equation where the minimum school
leav-ing age instrumented the years of schoolleav-ing (education). They found that the Two-Stage Least Squares (2SLS) estimates of the returns to schooling are higher than the Ordinary Least Squares (OLS) estimates. Similar results were provided by the application of this
instrument approach (Callan and Harmon(1999),Levine and Plug(1999),Vieira(1999),
and Brunello and Miniaci (1999). On the other hand, Pischke and von Wachter (2008)
found zero returns from the rise in the minimum school leaving age in West German
states during the period from 1948 to 1970, and Oosterbeek and Webbink (2007) found
no beneficial effect from the extension from 3 to 4 years in the length of vocational train-ing programs in the Netherlands. The Regression Discontinuity Design analysis carried
out by Devereux and Hart (2010) found no return for women and a modest return for
men using the 1947 British compulsory schooling law previously analyzed byHarmon and
Walker(1995) andOreopoulos(2006). More recently,Grenet(2013) made a comparative study of the compulsory schooling law change between France and the UK. He found a significant wage increase per an additional year of compulsory schooling by the British reform, whereas there was no impact of the French reform.
In addition, not only the economic outcomes, but also other features of the compulsory
schooling change have been considered. Lochner and Moretti (2004), Milligan et al.
(2004), andLleras-Muney(2005) investigated the effect of the compulsory schooling laws on criminal behaviors, political participation, and health status, respectively. Moreover,
subjective well-being and teenage childbirth have been examined by Oreopoulos (2007)
and Black et al. (2008). Oreopoulos et al. (2006) evaluated the intergenerational effects of the changes in compulsory schooling. They found that indeed parental education affects children’s grade retention and dropping-out rates, while Black et al. (2005) did not find any significant intergenerational effect of compulsory schooling laws on children’s
education in Norway. More recently, using PSID dataHryshko et al. (2011) found that a
change in compulsory schooling years reduces the risk aversion of children whose parents were affected by the law.
A few studies state that the education is negatively correlated with risk aversion (Donkers et al. (2001), Hartog et al. (2002)). However, there is no study looking at the direct impact of education on determining individual risk aversion due to the lack of data containing both risk aversion and exogenous educational shocks. Our contribution lies
here. This paper is a first attempt to look at the direct causal effect of education on risk aversion, thanks to the recent wave of British Household Panel Survey where we could elicit individual risk aversion and also use the British education reform of 1973.
In this paper, we use the British education reform of 1973 as an instrument for educa-tion, which enables us to observe a jump in the average education level before and after September 1, 1973. We can therefore use this reform as an exogenous education variable,
and observe the direct impact of education on individual risk aversion by using IV2SLS.
We find that, in contrast to the existing literature, the reform increased risk aversion. This effect is significant only for individuals with lower education (having at most high school diploma or left school before); and in fact those with a higher education level were not significantly affected. From this, we may infer that the negative relationship between education and risk aversion mainly comes from higher education (tertiary education).
The remainder of this paper is organized as follows. In Section 2, the institutional background will be described. We present our data and the empirical method in Sections 3 and 4. We discuss the results in Section 5, then Section 6 concludes.
2
Background: 1973 British Education Reform
The school year begins on September 1. Education is compulsory for all children from their fifth birthday to the last Friday in June of the school year in which they turn 16. The change in minimum school leaving age analyzed in our paper was part of the 1973 Education Act and took effect on September 1st, 1973. Individuals who were born before September 1957 and who turned 15 before the Law changed could leave school at the end of the term in which they turned 15 (the UK school year is divided into three terms). Individuals who were born in September 1957 or later and who turned 15 after the Law changed had to stay in school until the end of the term in which they turned 16, i.e. until the Summer of 1974. This Law change had a huge effect on the average age at which British pupils left school (Harmon and Walker (1995),Oreopoulos (2006)).
The objective of the 1973 Education Act was to expand access to Secondary Education in England and Wales. Before the reform, in the early 1950s, the system was exclusive so that only one quarter of good students could enter to the selective Grammar schools (the
academic track) which leads to higher education.1
This elite promotion in Secondary Education raised criticism, which triggered the need for the education reform. As a replacement for the old system, the more open and equal ‘Comprehensive’ system was,
then, introduced by the reform (Pischke and Manning (2006)).
With this background, the 1973 British Education Act is considered to be an impor-tant change in many aspects not only in terms of institutions, but also in the way in which affected individuals who were treated by this reform in various aspects of their lives as we discussed above. This is the reason why we use this reform as a reliable exogenous change in education in order to evaluate its effect on individual characteristics: here we specifically consider risk aversion.
3
Data
We use the 18th wave of the British Household Panel Survey which was collected in 2009, where the self-reported risk-aversion question is asked to respondents. The question is given as “Are you generally a person who is fully prepared to take risks or do you try to avoid taking risks?” and respondents are asked to answer in a 10-ladder Likert scale from 1 (Not willing at all) to 10 (Fully). We converted this measure by subtracting it from 10, in order to create a risk aversion measure which is increasing with risk aversion. Only individuals who were born between 1945 and 1975 are considered as within these years the reform was implemented (for the cohort of 1957). Another reason to select only a subsample of the wave is to reduce the age effect by having too old or too young genera-tions. We are left with a working sample of 6,513 observagenera-tions. Descriptive statistics are found in Table 1.
1
There were three categories in Secondary Education: Grammar schools, Technical schools and Mod-ern schools.
Table 1: Summary Statistics
Variable Mean s.d. Min Max Observations
Individual Characteristics: School Cohort 1960.27 8.62 1945 1975 6,513 % Woman 0.54 0.50 0 1 6,513 Age 47.07 8.64 32 64 6,513 Risk Aversion 4.54 2.03 0 9 6,513 Income 1,419 1,086 0 32,619 5,032 Married (=1) 0.68 0.47 0 1 6,513 Schooling: Reform in 1973 0.65 0.48 0 1 6,513
Age Left School 19.25 5.98 9 29 6,513
Years of Schooling 12.22 3.61 2.42 20 6,513
∗ p < 0.05,∗∗ p < 0.01,∗∗∗ p < 0.001
Table 2: Descriptive Statistics: By Reform
(1) Not In Reform (2) In Reform
Variable Mean s.d. Mean s.d. diff (1)-(2)
Individual Characteristics: School Cohort 1950.41 3.46 1965.62 5.18 *** % Woman 0.54 .50 0.55 0.50 Age 56.94 3.50 41.72 5.20 *** Risk Aversion 4.78 2.05 4.40 2.01 *** Income 1,358 1,307 1,445 974 * Married (=1) 0.73 0.44 0.65 0.48 *** Schooling: Reform in 1973 0 0 1 0
Age Left School 18.64 6.19 19.57 5.84 ***
Years of Schooling 11.69 3.60 12.51 3.59 ***
Observations 2,292 4,221
* p < 0.05, ** p < 0.01, *** p < 0.001
As the reform divides cohorts into two groups according to their dates of birth, Table 2 presents summary statistics between those who were affected by the reform and those who were not affected by the reform. The average age of those who were treated by the reform is, of course, lower than that of those who were not treated. The number of years of schooling differs between the treated and untreated individuals: after the reform: the average years of education increases by about 1.7 years. Two reasons can
explain this difference: one is from the reform and the other is the general cohort effect that younger generation tends to go on to higher education. On the other hand, the risk aversion score decreases from before to after the reform, yet it is not clear whether risk aversion decreases due to the reform or due to the age difference in the samples2
as the young individuals are found to be less risk averse than the older. Tables 3 compares the
Table 3: Descriptive Statistics: By Education Low Education High Education
Variable Mean s.d. Mean s.d. diff (1)-(2)
Individual Characteristics: School Cohort 1959.33 8.64 1961.40 8.47 *** % Woman 0.55 .50 0.54 .50 Age 48.02 8.66 45.94 8.48 *** Risk Aversion 4.73 2.06 4.30 1.98 *** Income 1,212 1059 1,634 1,072 *** Married (=1) 0.67 0.47 0.69 0.46 Schooling: Reform in 1973 0.60 0.49 0.70 0.46 ***
Age Left School 15.88 0.76 23.29 6.93 ***
Years of Schooling 9.52 0.97 15.46 2.89 ***
Observations 3,554 2,959
* p < 0.05, ** p < 0.01, *** p < 0.001
two groups: those who have lower education (at most high school diploma) and those who have higher education. Clearly, those who attained higher education have different characteristics; they are younger, they earn more, and they are less risk averse. Table 4 shows the comparison among three birth groups. We categorize individuals into three groups depending on whether they were born in the beginning/middle/end of the year as we will use these dummies for instruments of education in the next section. the number of years of schooling is lower when an individual was born later in the year. It is clearer with those who have lower education. However, the number of years of schooling does not decrease with the later month of birth for those with higher education.
2
Table 4: Descriptive Statistics: By Month of Birth
(1) Jan.-Apr. (2) May-Aug. (3)Sep.-Dec.
Variable Mean s.d. Mean s.d. Mean s.d. F-test
Individual Characteristics: School Cohort 1960.32 8.67 1960.40 8.57 1960.07 8.63 % Woman 0.54 0.50 0.54 0.50 0.55 0.50 Age 46.70 8.67 46.62 8.57 47.96 8.63 *** Risk Aversion 4.56 2.04 4.51 2.06 4.54 1.99 Income 1,444 1,121 1,429 1,17 1379 941 Married (=1) 0.68 0.47 0.67 0.47 0.68 0.46 Schooling: Reform in 1973 0.65 0.48 0.66 0.47 0.64 0.48
Age Left School 19.35 6.09 19.23 5.95 19.14 5.88
Years of Schooling Full Sample 12.40 3.53 12.21 3.67 12.03 3.64 * Low Education 9.78 0.80 9.43 1.02 9.34 1.03 *** High Education 15.49 2.95 15.47 2.89 15.41 2.84 Observations 2,274 2,178 2,061 * p < 0.05, ** p < 0.01, *** p < 0.001
4
Empirical Method
Table 5 presents the correlation matrix for the variables of interest such as risk aversion, being female, age, years of schooling, and marital status. As found in other work (Dohmen et al. (2005)), risk aversion is positively correlated with being female and with age, while negatively correlated with years of schooling (as noted above from the human-capital theory). Unlike being female and age which are given exogenously, education
per se is an individual choice. Therefore with this correlation, we can not identify the causality, whereas we can clearly state that women are more risk averse and the older an individual is, the more risk averse he would be. In human capital theory, less risk averse individuals tend to choose another year of schooling as an investment for the future income. Considering the possibility of risk aversion being time varying, early child education might formulate the individual characteristics such as risk aversion. Therefore, this correlation consists of two directions of composite effects: one from risk aversion to educational choices, and the other from education to determining individual risk aversion. In this section, we set up our empirical strategy in order to investigate the direction from
education to risk aversion using instrumental variable methods. Table 5: Correlation Matrix of Variables of Interest
Risk Aversion Woman (=1) 0.18* Age 0.26* Years of Schooling -0.15* Tertiary Education (=1) -0.13* Married (=1) 0.03* * p < 0.05
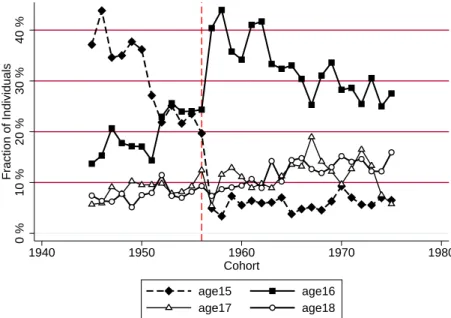
We investigate how education influences individual risk aversion. To do so, we use the 1973 British Education Reform, which increased compulsory schooling by one year. In this setting, we can divide our sample into two groups: one after the reform and the other before the reform. This reform allows us to observe a discontinuity in average education in terms of people with lower education level who are at the margin and would have left school early; this reform does not really affect those who would have gone on to college education anyway. We will treat these two different types of impact later in the section. Figure 1: Distribution of school leaving ages in the UK across school cohorts 1945-1970
0 % 20 % 10 % 30 % 40 % Fraction of Individuals 1940 1950 1960 1970 1980 Cohort age15 age16 age17 age18
Our empirical model follows a regression-discontinuity design. We observe a disconti-nuity in compulsory education before and after the reform of 1973. This education reform can explain the real impact of education on individual risk attitudes. Figure 1 shows the distribution of school leaving ages across school cohorts 1945-1970 in the UK. Each curve presents the fraction of the individuals who left school by given age. This graph shows that the new law of compulsory schooling introduced by the 1973 British reform signif-icantly shifts up the fraction of individuals who would have left at the age 15 without the reform which forced them to stay until the age 16. As a consequence, the fraction of individuals who left at the age 16 sharply increased as much as the fraction lost from school leavers at the age 15 after the reform (i.e. cohort 1957). With this figure, we do observe a jump of years of schooling for individuals after the reform was implemented.
We consider risk aversion as a function of education and other socio-demographic characteristics such as gender and age, which are all found to be correlated with risk aversion: women are more risk averse and young individuals are less risk averse. We set
treatment status Ref ormi as a deterministic and discontinuous function of a covariate
“date of birth” DOBi.
Ref ormi = {
1 if DOBi is after September 1957
0 if DOBi is before September 1957
Therefore, potential outcomes can be described by a linear constant-effects model:
E[RAoi|Xi] = α + Xiβ
RA1i= RA0i+ ρ
where Xi is the vector of socio-demographic controls such as gender, age, marital status, number of children, father’s occupation (social status), region, and employment status. Here the risk-aversion level when treated rises by ρ compared to the risk-aversion level
when not treated. This leads to the regression:
RAi = α + Xiβ+ ρRef ormi+ ηi
This is the reduced form of the impact of education on risk aversion. In general, the direction of causality between risk aversion and education is not very clear. Often we use risk aversion as an explanatory variable for individual education decisions, where one might argue that early education modifies individuals’ risk aversion. This is why we need to investigate an exogenous effect, which deals with the reverse causality issue of risk aversion on education. In our specification, we do not face an endogeneity problem; we use “Reform” as an instrument which varies exogenously with the policy change in 1973. Therefore, we can directly observe the impact of education on individual risk attitudes.
In the first stage, we observe the impact of the reform on education:
Y ears of Schoolingi = a + Xib+ cRef ormi+ ǫi
In addition to using the reform dummy as an instrument for education, we also added
dummies for the month of birth. We follow the famous approach suggested by Angrist
and Krueger (1991), which is to use the month of birth as an instrument for education. For those who left school as soon as they could (when they turned 15 if they were born before 1957 or 16 if they were born after 1957), the month of birth would make years of schooling different as they all enter a school in September, but the compulsory schooling ends differently depending on the month of birth. In the UK, children begin to enter
a primary school during the academic year they turn age 5.3
Therefore, students who were born in the end of the year can reach the legal dropout age with shorter duration
3
In comparison toAngrist and Krueger (1991), the education system in the UK is slightly different from that in the US. While American schools do not admit students to the first grade until they become age 6 by January 1 of the academic year in which they enter school (Angrist and Krueger (1991)), in England, children begin primary education during the academic year they become age 5. Therefore, in
Angrist and Krueger (1991), students who were born in the beginning of the year are older in the US, whereas students who were born in the end of the year are older in the UK.
of education as they were older when they entered a primary school. We create three dummies for the month of birth: (1) born in the beginning of the year (January, February, March, and April), (2) born in the middle of the year (May, June, July, and August), and (3) born in the end of the year (September, October, November, and December). Then our augmented first stage and the reduced form are as follows:
Y ears of Schoolingi = a + Xib+ c1Ref ormi+ c2Born1 + c3Born2 + ǫi (F irst Stage)
RAi = α + Xiβ+ ρ1Ref ormi+ ρ2Born1 + ρ3Born2 + ηi (Reduced F orm) Then finally we can estimate the impact of education on risk aversion via instrumental
variable method. With the IV2SLS results, we can see whether the general causal impact
of risk aversion on educational choices is biased due to endogeneity/reverse causality.
5
Results
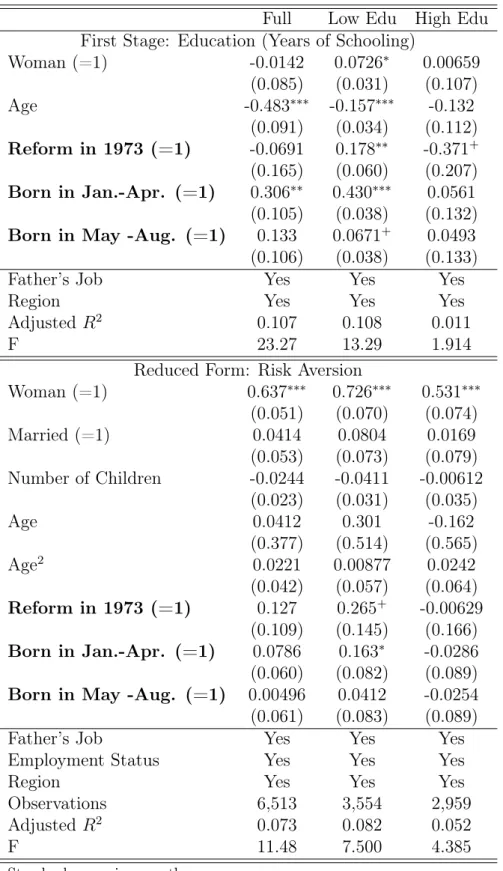
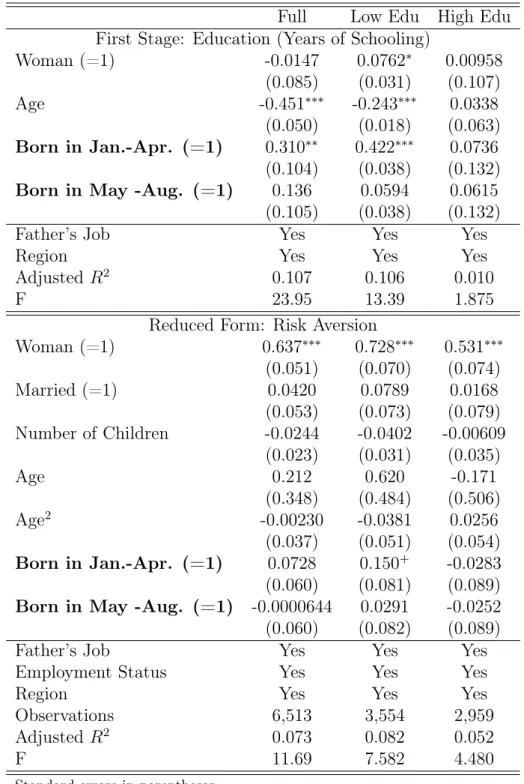
Table 6 presents the results from the first-stage regression and the reduced form. The results from the first-stage regression are found in the first panel. As expected the reform significantly increased years of schooling. In addition, the season of birth also increases the years of schooling. In order to see the impact in more detail, we selected two sub-samples depending on their education level. Column “Low Edu” corresponds to those who have at most high school diploma, while the Column “High Edu” is for those with tertiary education. In the sub-sample analysis, we can see that the reform and the season of birth affect more strongly those with lower education. This is obviously because the increase in compulsory schooling would not affect so much those who would have gone on to higher education anyway. The second panel shows the results from the reduced form. We take the reform variable and also season of birth dummies in order to explain the level of risk aversion. The reform which increased years of schooling, increases the level of risk aversion. It implies that the more educated, the more risk averse. This result contrasts
Table 6: Education Reform and Risk Aversion
Full Low Edu High Edu
First Stage: Education (Years of Schooling)
Woman (=1) -0.0142 0.0726∗ 0.00659 (0.085) (0.031) (0.107) Age -0.483∗∗∗ -0.157∗∗∗ -0.132 (0.091) (0.034) (0.112) Reform in 1973 (=1) -0.0691 0.178∗∗ -0.371+ (0.165) (0.060) (0.207) Born in Jan.-Apr. (=1) 0.306∗∗ 0.430∗∗∗ 0.0561 (0.105) (0.038) (0.132)
Born in May -Aug. (=1) 0.133 0.0671+
0.0493
(0.106) (0.038) (0.133)
Father’s Job Yes Yes Yes
Region Yes Yes Yes
Adjusted R2
0.107 0.108 0.011
F 23.27 13.29 1.914
Reduced Form: Risk Aversion
Woman (=1) 0.637∗∗∗ 0.726∗∗∗ 0.531∗∗∗ (0.051) (0.070) (0.074) Married (=1) 0.0414 0.0804 0.0169 (0.053) (0.073) (0.079) Number of Children -0.0244 -0.0411 -0.00612 (0.023) (0.031) (0.035) Age 0.0412 0.301 -0.162 (0.377) (0.514) (0.565) Age2 0.0221 0.00877 0.0242 (0.042) (0.057) (0.064) Reform in 1973 (=1) 0.127 0.265+ -0.00629 (0.109) (0.145) (0.166) Born in Jan.-Apr. (=1) 0.0786 0.163∗ -0.0286 (0.060) (0.082) (0.089)
Born in May -Aug. (=1) 0.00496 0.0412 -0.0254
(0.061) (0.083) (0.089)
Father’s Job Yes Yes Yes
Employment Status Yes Yes Yes
Region Yes Yes Yes
Observations 6,513 3,554 2,959
Adjusted R2
0.073 0.082 0.052
F 11.48 7.500 4.385
Standard errors in parentheses
+ p < 0.10,∗ p < 0.05,∗∗ p < 0.01,∗∗∗ p < 0.001
with other studies where education is found to decrease risk aversion (Dohmen et al.
(2005), Hryshko et al. (2011)). It is more interesting to look at the sub-sample analysis. Whereas the reform does not affect so much those with higher education, the reform does affect the low-educated: they become more risk averse after a rise in compulsory schooling. From this result, we infer that the negative correlation between education and risk aversion is not always clear. The finding that education reduces risk aversion may only work for higher education as lower education may in fact increase risk aversion.
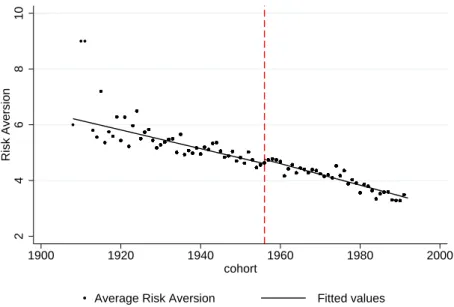
Figure 2: Full Sample: Cohort Average Risk Aversion
2 4 6 8 10 Risk Aversion 1900 1920 1940 1960 1980 2000 cohort
Average Risk Aversion Fitted values
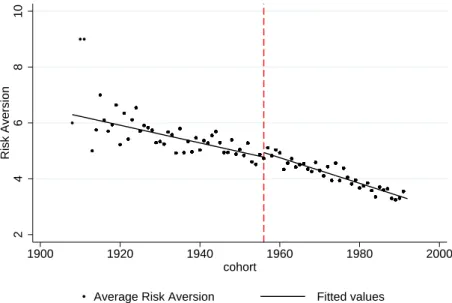
Figure 2 shows the average risk aversion and the fitted values for average risk aversion for each cohort. We clearly see a jump before and after the reform. Figure 3 restricts the sample to those with lower education, and the cutoff is much more significant, here, whereas the jump for those with higher education is much less clear and not significant in Figure 4. These figures again show that indeed the education reform has increased average risk aversion level in total with a stronger and more significant effect for those with lower education levels. In other words, the low-educated were the most affected by the reform that increased compulsory schooling.
esti-Figure 3: Lower Education: Cohort Average Risk Aversion 2 4 6 8 10 Risk Aversion 1900 1920 1940 1960 1980 2000 cohort
Average Risk Aversion Fitted values
Figure 4: Higher Education: Cohort Average Risk Aversion
0 2 4 6 8 10 Risk Aversion 1900 1920 1940 1960 1980 2000 cohort
Average Risk Aversion Fitted values
mations.4
In the full sample analysis, OLS gives a negative coefficient for the impact of
4
We also tried to include the individual income in order to estimate the risk aversion equation. The impact of income on risk aversion is close to zero but significantly negative. Also it does not change much for the coefficients of years of schooling which is our interests. However we lose about 4,000 sample size by including income (due to many missing data on income variable) and losing the explanatory power. Therefore we only report the risk aversion equation without income.
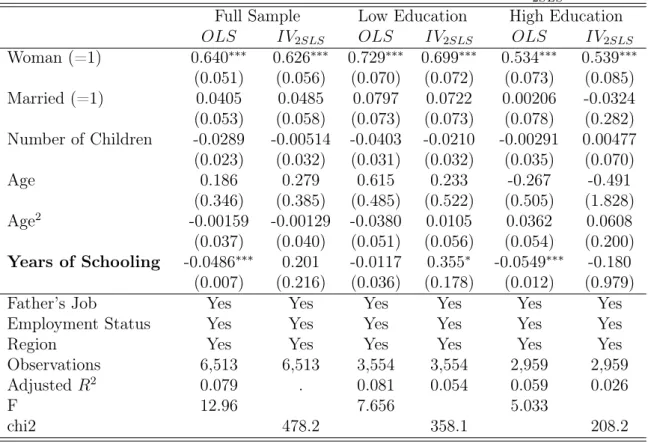
Table 7: Education Reform and Risk Aversion : OLS vs IV2SLS
Full Sample Low Education High Education
OLS IV2SLS OLS IV2SLS OLS IV2SLS
Woman (=1) 0.640∗∗∗ 0.626∗∗∗ 0.729∗∗∗ 0.699∗∗∗ 0.534∗∗∗ 0.539∗∗∗ (0.051) (0.056) (0.070) (0.072) (0.073) (0.085) Married (=1) 0.0405 0.0485 0.0797 0.0722 0.00206 -0.0324 (0.053) (0.058) (0.073) (0.073) (0.078) (0.282) Number of Children -0.0289 -0.00514 -0.0403 -0.0210 -0.00291 0.00477 (0.023) (0.032) (0.031) (0.032) (0.035) (0.070) Age 0.186 0.279 0.615 0.233 -0.267 -0.491 (0.346) (0.385) (0.485) (0.522) (0.505) (1.828) Age2 -0.00159 -0.00129 -0.0380 0.0105 0.0362 0.0608 (0.037) (0.040) (0.051) (0.056) (0.054) (0.200) Years of Schooling -0.0486∗∗∗ 0.201 -0.0117 0.355∗ -0.0549∗∗∗ -0.180 (0.007) (0.216) (0.036) (0.178) (0.012) (0.979)
Father’s Job Yes Yes Yes Yes Yes Yes
Employment Status Yes Yes Yes Yes Yes Yes
Region Yes Yes Yes Yes Yes Yes
Observations 6,513 6,513 3,554 3,554 2,959 2,959
Adjusted R2 0.079 . 0.081 0.054 0.059 0.026
F 12.96 7.656 5.033
chi2 478.2 358.1 208.2
Standard errors in parentheses
+p < 0.10,∗p < 0.05,∗∗p < 0.01,∗∗∗p < 0.001
Age is divided by 10.
education (years of schooling), which is consistent with what is generally found in other studies suggesting that risk aversion is a determinant of education. However, from this correlation, we cannot tell that education diminishes risk aversion, because of possible endogeneity or reverse causality. Quite differently, IV2SLS suggests the opposite direction of correlation: years of schooling increase risk aversion. Education here is instrumented by the reform variable and the season of birth. Then, a positive coefficient is found. This finding is stronger and significant only for those with lower education: with OLS, the impact of education is negative, whereas with IV2SLS, it is positive and significant. In general, risk aversion is negatively correlated with education for those with lower ed-ucation. However, the causal impact of education on risk aversion via the instrument variable method is positive. From this result, we can infer that the impact of risk aver-sion on the choice of education level for those with lower education may be even higher than the OLS coefficient, as there is an opposite direction of the education effect on risk
aversion. Therefore, when we use risk aversion as an explanatory variable for education choice, the coefficient might be underestimated (biased toward zero). This may support the use of risk aversion as an explanatory variable for educational choices because we could still insist that there is an impact of risk aversion on the decision making although it is biased. Again, the results are different for those with higher education as they were less affected by the reform. Here, the impact of education is negative, which is in line with other research, although it is not significant: the more educated, the less risk averse. To check the robustness of this analysis, we estimate the same two steps, but without the reform variable. We only take the season of birth dummies as instruments for educa-tion, and check whether it gives similar results. Table 8 is the first stage and the reduced form. Similar to the previous result with the reform variable, the season of birth dummies have positive (but not significant) coefficients. The IV2SLS coefficients are found in Table 9. Even though the coefficient of schooling for those with lower education is larger than that for those with higher education, the coefficients are weakly significant. This is be-cause the variation of risk aversion with the small difference in years of schooling (within one year) is too noisy with big standard errors to have strong statistical significance. At least, the sign of the coefficient of years of schooling on risk aversion is still positive and (weakly) significant for those with lower education, while there is almost no impact of years of schooling on risk aversion for those with higher education. This reassures that years of schooling increase the risk-aversion level of the low-educated. The reason behind why early education increases risk aversion is complex to suggest. One possible explana-tion is that early educaexplana-tion may make individuals better able to evaluate the risks they face and their ability to deal with them. Education can unveil the risks and that is why education may increase the risk-aversion level.
Last, we look at sub-samples to see if there is a local average treatment impact of the reform on risk aversion. We only take the cohort group of individuals who were born around 1957, and then compare average risk aversion of those who were treated (who were born after September 1957) to that of those who were not treated (who were born
Table 8: Education Reform and Risk Aversion: Robustness Check (without Reform Vari-able)
Full Low Edu High Edu
First Stage: Education (Years of Schooling)
Woman (=1) -0.0147 0.0762∗ 0.00958 (0.085) (0.031) (0.107) Age -0.451∗∗∗ -0.243∗∗∗ 0.0338 (0.050) (0.018) (0.063) Born in Jan.-Apr. (=1) 0.310∗∗ 0.422∗∗∗ 0.0736 (0.104) (0.038) (0.132)
Born in May -Aug. (=1) 0.136 0.0594 0.0615
(0.105) (0.038) (0.132)
Father’s Job Yes Yes Yes
Region Yes Yes Yes
Adjusted R2
0.107 0.106 0.010
F 23.95 13.39 1.875
Reduced Form: Risk Aversion
Woman (=1) 0.637∗∗∗ 0.728∗∗∗ 0.531∗∗∗ (0.051) (0.070) (0.074) Married (=1) 0.0420 0.0789 0.0168 (0.053) (0.073) (0.079) Number of Children -0.0244 -0.0402 -0.00609 (0.023) (0.031) (0.035) Age 0.212 0.620 -0.171 (0.348) (0.484) (0.506) Age2 -0.00230 -0.0381 0.0256 (0.037) (0.051) (0.054) Born in Jan.-Apr. (=1) 0.0728 0.150+ -0.0283 (0.060) (0.081) (0.089)
Born in May -Aug. (=1) -0.0000644 0.0291 -0.0252
(0.060) (0.082) (0.089)
Father’s Job Yes Yes Yes
Employment Status Yes Yes Yes
Region Yes Yes Yes
Observations 6,513 3,554 2,959
Adjusted R2
0.073 0.082 0.052
F 11.69 7.582 4.480
Standard errors in parentheses
+ p < 0.10,∗ p < 0.05,∗∗ p < 0.01,∗∗∗ p < 0.001
Age is divided by 10. Age2 is Age2divided by 100.
before September 1957). Using the full sample in Table 8, we do not observe a significant rise in average risk aversion from the reform in 1973. Table 9 gives the results for the
Table 9: Education Reform and Risk Aversion : OLS vs IV2SLS: Robustness Check (without Reform Variable)
Full Sample Low Education High Education
OLS IV2SLS OLS IV2SLS OLS IV2SLS
Woman (=1) 0.640∗∗∗ 0.623∗∗∗ 0.729∗∗∗ 0.700∗∗∗ 0.534∗∗∗ 0.539∗∗∗ (0.051) (0.059) (0.070) (0.072) (0.073) (0.085) Married (=1) 0.0405 0.0503 0.0797 0.0723 0.00206 -0.0324 (0.053) (0.060) (0.073) (0.073) (0.078) (0.282) Number of Children -0.0289 0.000302 -0.0403 -0.0214 -0.00291 0.00477 (0.023) (0.034) (0.031) (0.032) (0.035) (0.070) Age 0.186 0.300 0.615 0.241 -0.267 -0.491 (0.346) (0.400) (0.485) (0.521) (0.505) (1.828) Age2 -0.00159 -0.00122 -0.0380 0.00947 0.0362 0.0608 (0.037) (0.041) (0.051) (0.056) (0.054) (0.200) Years of Schooling -0.0486∗∗∗ 0.259 -0.0117 0.347+ -0.0549∗∗∗ -0.180 (0.007) (0.229) (0.036) (0.178) (0.012) (0.979)
Father’s Job Yes Yes Yes Yes Yes Yes
Employment Status Yes Yes Yes Yes Yes Yes
Region Yes Yes Yes Yes Yes Yes
Observations 6,513 6,513 3,554 3,554 2,959 2,959
Adjusted R2 0.079 . 0.081 0.055 0.059 0.026
F 12.96 7.656 5.033
chi2 442.9 358.4 208.2
Standard errors in parentheses
+p < 0.10,∗ p < 0.05,∗∗p < 0.01,∗∗∗ p < 0.001
Age is divided by 10.
samples with only lower education. From 5-year window of cohorts born around 1957, the marginal effects are positive and sometimes significant. However, these analyses do not clearly show that the reform increased the average risk aversion across cohorts, probably due to the small sample size. If we allow for a wider interval of cohorts, we may get more significant results, but then we need to take age into account which makes the analyses more complicated.
6
Conclusion
We have carried out an empirical analysis to investigate the impact of education on risk aversion. The correlation between risk aversion and education has been widely studied, but the direction of causality remains unclear. Researchers have attempted to use risk aversion in order to explain education decisions, and found that education is negatively
Table 10: Education Reform and Risk Aversion: Regression Discontinuity: Various Win-dows: Full Sample
1957 3yrs 5yrs 7yrs 9yrs 11yrs
Reform73 -0.0343 0.0420 0.163 0.155 0.0614 -0.0140 (0.303) (0.275) (0.150) (0.117) (0.100) (0.089) Constant 4.757∗∗∗ 4.681∗∗∗ 4.588∗∗∗ 4.605∗∗∗ 4.695∗∗∗ 4.699∗∗∗ (0.172) (0.113) (0.089) (0.075) (0.067) (0.061) Observations 201 388 770 1,185 1,593 2,037 Adjusted R2 -0.005 -0.003 0.000 0.001 -0.000 -0.000 F 0.0128 0.0233 1.194 1.751 0.374 0.0248
Standard errors in parentheses
+ p < 0.10,∗ p < 0.05,∗∗ p < 0.01,∗∗∗ p < 0.001
Table 11: Education Reform and Risk Aversion: Regression Discontinuity: Various Win-dows: Lower Education
1957 3yrs 5yrs 7yrs 9yrs 11yrs
Reform73 -0.0390 -0.192 0.319 0.372∗ 0.193 0.0544 (0.515) (0.468) (0.232) (0.183) (0.157) (0.136) Constant 4.735∗∗∗ 4.887∗∗∗ 4.788∗∗∗ 4.783∗∗∗ 4.920∗∗∗ 4.985∗∗∗ (0.291) (0.180) (0.141) (0.116) (0.105) (0.093) Observations 72 156 329 499 676 873 Adjusted R2 -0.014 -0.005 0.003 0.006 0.001 -0.001 F 0.00575 0.167 1.888 4.136 1.510 0.160
Standard errors in parentheses
+ p < 0.10,∗ p < 0.05,∗∗ p < 0.01,∗∗∗ p < 0.001
correlated with risk aversion: the more risk averse an individual is, the earlier she quits school. However, there are concerns about endogeneity or reverse causality, suggesting that education per se influences the formation of individual risk aversion. To deal with these potential problems, we take the 1973 British Education Act and use this reform as an instrument for education as it exogenously increased compulsory schooling by one
year. We conducted IV2SLS analyses to investigate the causal impact of education on risk
aversion.
Our finding is that a one-year increase in compulsory schooling has a positive impact on being risk averse. From that we can infer that education may increase risk aversion which contrasts with the existing literature. This result is clearer only for those with lower
education. The reform did not have a significant impact on the risk aversion of those with higher education, which makes sense as they would have gone on to higher education even without the reform. This finding is different from the general belief that education reduces risk aversion (Dohmen et al.(2005), Hryshko et al.(2011)). We suggest that the role of education for lower and higher levels may be different. As we found a negative coefficient for the impact of education on risk aversion for those with higher education, tertiary education may diminish one’s risk aversion by encouraging people to take more risk with better understanding of dealing with risks, whereas education at younger age may increase risk aversion by making individuals get to learn more about the risks they face.
Finding a positive impact of education on risk aversion may encourage the use of risk aversion as an explanatory variable for educational choice. Although the coefficient on risk aversion is biased, we can still argue that there is an impact, because the coefficient is underestimated. In other words, as the potential reverse causality issue is in the direction which reduces the size of the impact towards zero, we can rely on the sign of the risk aversion impact on education.
Last, we look at the local average treatment effect of the reform on risk aversion by focusing on sub-samples of cohorts who were born around 1957. Although we observe positive effects of the reform on cohort average risk aversion for those with lower educa-tion, the results are not significant. This may be because we do not have a sample size that is large enough to reveal a clear difference. Further investigation of that average treatment effect therefore probably requires larger sample size.
References
Acemoglu, D. and J. Angrist, “How Large are Human-Capital Externalities? Ev-idence from Compulsory-Schooling Laws,” in NBER Macroeconomics Annual 2000,
Angrist, J. D. and A. B. Krueger, “Does Compulsory School Attendance Affect Schooling and Earnings?,” The Quarterly Journal of Economics 106 (November 1991), 979–1014.
Barsky, R. B., F. T. Juster, M. S. Kimball and M. D. Shapiro, “Preference Parameters and Behavioral Heterogeneity: An Experimental Approach in the Health and Retirement Study,” The Quarterly Journal of Economics 112 (May 1997), 537–79. Belzil, C. and J. Hansen, “Earnings Dispersion, Risk Aversion and Education,”
Post-Print halshs-00180125, HAL, April 2004.
Belzil, C. and M. Leonardi, “Risk Aversion and Schooling Decisions,” IZA Discussion Papers 2994, Institute for the Study of Labor (IZA), August 2007.
Black, S. E., P. J. Devereux and K. G. Salvanes, “Why the Apple Doesn’t Fall Far: Understanding Intergenerational Transmission of Human Capital,” American Economic
Review 95 (2005), 437–449.
———, “Staying in the Classroom and out of the maternity ward? The effect of compul-sory schooling laws on teenage births*,” The Economic Journal 118 (2008), 1025–1054. Brunello, G. and R. Miniaci, “The Economic Return to Schooling for Italian Men. An Evaluation Based on Instrumental Variables,” Labour Economics 6(4) (1999), 509– 519.
Callan, T. and C. Harmon, “The Economic Return to Schooling in Ireland,” Labour
Economics 6(4) (1999), 543–550.
Cameron, S. V. and J. J. Heckman, “Life Cycle Schooling and Dynamic Selection Bias: Models and Evidence for Five Cohorts of American Males,” Journal of Political
Cameron, S. V. and C. Taber, “Estimation of Educational Borrowing Constraints Using Returns to Schooling,” Journal of Political Economy 112 (February 2004), 132– 182.
Chiswick, B. R. and J. Mincer, “Time-Series Changes in Personal Income Inequality in the United States from 1939, with Projections to 1985,” Journal of Political Economy 80 (Part II, 1972), S34–S66.
Devereux, P. J. and R. A. Hart, “Forced to be Rich? Returns to Compulsory Schooling in Britain,” Economic Journal 120 (December 2010), 1345–1364.
Dohmen, T., A. Falk, D. Huffman and U. Sunde, “The Intergenerational Trans-mission of Risk and Trust Attitudes,” Review of Economic Studies 79 (2012), 645–677. Dohmen, T., A. Falk, D. Huffman, U. Sunde, J. Schupp and G. G. Wagner, “In-dividual Risk Attitudes: New Evidence from a Large, Representative, Experimentally-Validated Survey,” Discussion Papers of DIW Berlin 511, DIW Berlin, German Institute for Economic Research, 2005.
Donkers, B., B. Melenberg and A. Van Soest, “Estimating Risk Attitudes using Lotteries: A Large Sample Approach,” Journal of Risk and Uncertainty 22 (2001), 165–95.
Goldin, C. and L. F. Katz, “Mass Secondary Schooling and the State: The Role of State Compulsion in the High School Movement,” in Understanding Long-Run
Eco-nomic Growth: Geography, Institutions, and the Knowledge EconomyNBER Chapters (National Bureau of Economic Research, Inc, 2008), 275–310.
Grenet, J., “Is Extending Compulsory Schooling Alone Enough to Raise Earnings? Evidence from French and British Compulsory Schooling Laws,” Scandinavian Journal
Harmon, C. and I. Walker, “Estimates of the Economic Return to Schooling for the United Kingdom,” American Economic Review 85 (December 1995), 1278–86.
Hartog, J., A. Ferrer-i âĂŞ Carbonell and N. Jonker, “Linking Measured risk Aversion to Individual characteristics,” Kyklos 55 (2002), 3–26.
Holt, C. A. and S. K. Laury, “Risk Aversion and Incentive Effects,” American
Eco-nomic Review 92 (December 2002), 1644–1655.
———, “Risk Aversion and Incentive Effects: New Data without Order Effects,” American
Economic Review 95 (June 2005), 902–912.
Hryshko, D., M. J. LuengoâĂŘPrado and B. E. Sorensen, “Childhood deter-minants of risk aversion: The long shadow of compulsory education,” Quantitative
Economics 2 (03 2011), 37–72.
Imbens, G. W. and T. Lemieux, “Regression discontinuity designs: A guide to prac-tice,” Journal of Econometrics 142 (February 2008), 615–635.
Keane, M. P. and K. I. Wolpin, “The Effect of Parental Transfers and Borrowing Constraints on Educational Attainment,” International Economic Review 42 (Novem-ber 2001), 1051–1103.
Levhari, D. and Y. Weiss, “The Effect of Risk on the Investment in Human Capital,”
American Economic Review 64 (December 1974), 950–63.
Levine, J. and E. Plug, “Instrumenting Education and the Returns to Schooling in the Netherlands,” Labour Economics 6(4) (1999), 521–534.
Lleras-Muney, A., “Were Compulsory Attendance and Child Labor Laws Effective? An Analysis from 1915 to 1939,” Journal of Law and Economics 45 (2) 1 (April 2002). ———, “The Relationship Between Education and Adult Mortality in the United States,”
Lochner, L. and E. Moretti, “The Effect of Education on Crime: Evidence from Prison Inmates, Arrests, and Self-Reports,” American Economic Review 94 (2004), 155–189.
Milligan, K., E. Moretti and P. Oreopoulos, “Does Education Improve Citizen-ship? Evidence from the United States and the United Kingdom,” Journal of Public
Economics 88(9-10) (2004), 1667–1695.
Mincer, J. A., Schooling, Experience, and Earnings, number minc74-1 in NBER Books (New York: Columbia University, 1974).
Oosterbeek, H. and D. Webbink, “Wage effects of an extra year of basic vocational education,” Economics of Education Review 26 (August 2007), 408–419.
Oreopoulos, P., “Estimating Average and Local Average Treatment Effects of Educa-tion when Compulsory Schooling Laws Really Matter,” American Economic Review 96 (March 2006), 152–175.
———, “Do dropouts drop out too soon? Wealth, health and happiness from compulsory schooling,” Journal of Public Economics 91 (December 2007), 2213–2229.
Oreopoulos, P., M. E. Page and A. H. Stevens, “Does Human Capital Transfer from Parent to Child? The Intergenerational Effects of Compulsory Schooling,” Journal
of Labor Economics 24 (4) (December 2006), 729–760.
Pischke, J.-S. and A. Manning, “Comprehensive Versus Selective Schooling in Eng-land and Wales: What Do We Know?,” NBER Working Paper No. 12176. (2006). Pischke, J.-S. and T. von Wachter, “Zero Returns to Compulsory Schooling in
Germany: Evidence and Interpretation,” Review of Economics and Statistics 90(3) (2008), 592–598.
Sauer, R. M., “Educational Financing and Lifetime Earnings,” Review of Economic