HAL Id: halshs-00469499
https://halshs.archives-ouvertes.fr/halshs-00469499
Submitted on 1 Apr 2010
HAL is a multi-disciplinary open access archive for the deposit and dissemination of sci-entific research documents, whether they are pub-lished or not. The documents may come from teaching and research institutions in France or
L’archive ouverte pluridisciplinaire HAL, est destinée au dépôt et à la diffusion de documents scientifiques de niveau recherche, publiés ou non, émanant des établissements d’enseignement et de recherche français ou étrangers, des laboratoires
Financial integration and financial development in
transition economies: what happens during financial
crises?
Arjana Brezigar-Masten, Fabrizio Coricelli, Igor Masten
To cite this version:
Arjana Brezigar-Masten, Fabrizio Coricelli, Igor Masten. Financial integration and financial develop-ment in transition economies: what happens during financial crises?. 2010. �halshs-00469499�
Documents de Travail du
Centre d’Economie de la Sorbonne
Financial integration and financial development in
transition economies : What happens during financial
crises ?
Arjana B
REZIGAR-M
ASTEN,Fabrizio C
ORICELLI,Igor M
ASTENFinancial integration and financial development in transition economies:
What happens during financial crises?
Arjana Brezigar-Masten‡
Fabrizio Coricelli*
Igor Masten†
Abstract
This paper provides an empirical analysis of the role of financial development and financial integration in the growth dynamics of transition countries. We focus on the role of financial integration in determining the impact of financial development on growth, distinguishing “normal times” from periods of financial crises. In addition to confirming the significant positive effect on growth exerted by financial development and financial integration, our estimates show that a higher degree of financial openness tends to reduce the contractionary effect of financial crises, by cushioning the effect on the domestic supply of credit. Consequently, the high reliance on international capital flows by transition countries does not necessarily increase their financial fragility. This implies that financial protectionism is a self-defeating policy, at least for transition countries.
JEL codes: F33, F36, G15
Keywords: transition economies, financial integration, financial crises, economic growth, threshold effects
‡
Institute for Macroeconomic Analysis and Development, Gregorčičeva 27, 1000 Ljubljana, email: arjanabm@gmail.com
* Université Paris 1 Panthéon-Sorbonne and CEPR, email: fabrizio.coricelli@gmail.com †
European University Institute and University of Ljubljana, Kardeljeva pl. 17, 1000 Ljubljana, email: igor.masten@ef.uni-lj.si
1INTRODUCTION
In contrast with initial optimistic expectations, transition economies experienced significant and prolonged output declines after the start of transition. The magnitude of these declines was such that, at the end of the first decade of transition, only a few countries had a GDP per capita above their 1989 levels (Campos and Coricelli, 2002), which induced divergence from the incomes of developed countries. Indeed, relative to the EU income levels, incomes per capita of Central-Eastern European countries (CEECs) in 2002 were lower than in 1989 (Coricelli et al., 2008).
Following the Russian financial crisis in 1998 that adversely affected the whole region, transition countries experienced a more prosperous decade. The long-expected catching up with respect to the developed Western Europe was set in motion at significant speed (WEO, 2009). Both the development of national financial systems and international financial integration were likely two main ingredients of such a process.
For financial development, the empirical analysis in Coricelli et al. (2008), using industry-level data for EU and transition countries, revealed that it indeed significantly contributed to growth and catching-up in transition economies. Similarly, financial integration seemed to play a comparably important role in the growth performance of transition economies. Transition countries participated fully in the increased volume of international financial flows,although, as documented in Lane and Milesi-Ferretti (2007), transition countries differed sharply from other emerging countries. Significant capital inflows to transition countries resulted in persistent current account deficits associated with a sizable increase in private investment, well above domestic private savings. The most important component of capital inflows was foreign direct investment, which in 2004 for the region as a whole accounted for almost half of total external liabilities (Lane and Milesi-Ferretti, 2007). Furthermore, there was a significant process of financial integration through cross-border bank acquisitions and lending, led by large Western European banking groups. An estimate by the IMF shows that European Banks’ claims in Emerging Europe peaked at almost 60% of destination countries’ GDP in 2007 (WEO April 2009). The empirical evidence also suggests that these developments significantly contributed to growth and income convergence of transition countries (Brezigar-Masten et al., 2008).
Persistent current account deficits, however, raise the issue of sustainability of the negative foreign asset positions. Until recently, the outlook in this respect seemed quite favorable. Estimates by Lane and Milesi-Ferretti (2007) revealed a need of substantial future current account adjustments only for the Baltic countries, Bulgaria and Romania. Among the factors contributing to this rather favorable assessment, they outlined strong export growth, low spreads on external debt, large EU transfers and large labor remittances. However, the worst financial and economic crisis since WWII that spread throughout the global economy at the end of 2008 calls for a reassessment of these issues.
Heavy reliance on inflows of foreign capital (similarly to the developed world, these flows also significantly contributed to asset price and real estate bubbles in transition countries) implies that the global credit crunch had a much more severe effect on transition economies than on other emerging countries, which on average had positive current account positions in the period prior to
the crisis. Not surprisingly, transition countries are disproportionally represented in the list of recipients of financial assistance by the IMF.
Especially when comparing transition countries with Asian and Latin American countries, the question arises whether reliance on international financial flows may have been excessive, and consequently whether most of the benefits of previous financial integration are at risk of being wiped out by the international financial turmoil of 2008. For instance, in their analysis of the effect of crises on economic growth, Cerra in Saxena (2007) show that in more financially open countries crises produce higher and persistent output losses. Edwards (2006) reaches similar conclusions. While he finds no conclusive evidence that higher capital mobility increases the incidence of crisis, his results suggest that that once a crisis occurs, countries with higher capital mobility may face higher reductions in output growth. The issue of a high degree of dependence on foreign sources of financing and potentially amplified effects of financial distress thus challenges the policymakers in transition countries and the rest of Europe (given the exposure of western financial institutions) to rethink the appropriateness of past policies and design necessary measures for the future.
This paper provides a novel contribution to the literature field, by analyzing the impact of financial integration on domestic financial development during periods of crises, focusing on European countries. We concentrate directly on the financial integration-financial development nexus for two reasons. Firstly, it has been shown that financial integration affects growth mainly indirectly, through the effect of financial integration on domestic financial development (Kose et al., 2009). Secondly, the key issue is to determine whether high reliance on foreign funds magnifies the impact of a crisis on the domestic financial sector. Such magnified effects can have adverse effects on the real economy.
This empirical analysis proceeds in two steps. In the first step, we provide evidence of a positive direct effect of financial development and financial integration on growth. This positive effect appears to be non-uniform across countries (and time) with a generally larger impact on transition economies, which leads to the conclusion that the increasing supply of finance and financial integration indeed fueled the income convergence observed in the last decade.
However, financial development and financial integration are not independent processes: they move in parallel with one possibly being a catalyst for the other or even acting as a substitute.1 The
mechanics behind their co-movement are likely to be complex, with different channels operating
1 If the domestic financial sector is unable to meet a higher demand for finance, cross-border borrowing may serve as a
substitute in the case of sufficient degree of institutional homogeneity between donor and recipient countries. Conversely, increased competition from foreign financial institutions and/or their entry to the market may stimulate the development of domestic financial institutions. The latter group also benefits from access to foreign sources of funds.
during periods of output expansions and periods of crises. This is why in the second step we use the data on financial crises dates from Cerra and Saxena (2007) and show that the overall supply of finance significantly decreases in crises, which suppresses growth or deepens the recession in addition to other direct effects of the crisis. A higher degree of financial openness, however, does not seem to aggravate the effects of a crisis. On the contrary, financially more open countries experience a smaller decline in the supply of finance and thus a smaller amplification of the business cycle through the channel between financial development and growth. In other words, financial integration offers a steadier provision of finance through domestic financial markets also in crisis times.
Calvo et al. (2008) found a similar result in connection with the probability of a sudden stop in capital flows, although they find the relationship to be non-linear. In a large cross-country analysis, they find that passed a given threshold, higher financial integration reduces the probability of a sudden stop.
The rest of the paper is organized as follows: Section 2 discusses the role of finance and financial integration in economic growth in transition countries. We present the basic stylized empirical facts underlying the process and provide estimates of the direct effect of financial development and financial integration on growth. Section 3 commences with the identification of the indirect effect of financial integration on growth through the effect on the development of national financial markets. In addition, the section evaluates how episodes of financial crises interfere with this indirect effect. This enables us to evaluate whether financially more open countries suffer from higher financial disruptions in times of crises. Section 4 concludes with a discussion of policy implications.
2TWO DECADES OF TRANSITION – THE ROLE OF FINANCE AND FINANCIAL INTEGRATION
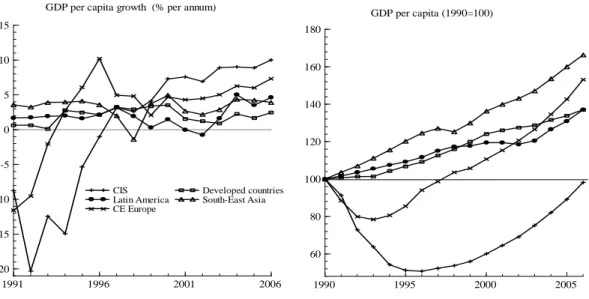
Transition countries suffered from severe initial output collapses. The magnitude of negative growth rates at the beginning of transition (see left panel of Figure 1) was indeed remarkable. Furthermore, during the 1991-1997 period output grew on average only in Hungary, Poland and Slovenia (Campos and Coricelli, 2002). Output losses were particularly severe in the CIS, for which output decline continued until 1997, resulting in a cumulative loss of output of almost 50%.
Convergence towards developed countries in Central and Eastern Europe started in 1994 and accelerated after 2000. However, because of the initial collapse, the right panel of Figure 1 reveals that CEE countries as a whole started to fill the gap with developed countries only in 2003. As whole, CEE countries fared better than Latin America during this period, and were also catching up with the pace of convergence of Emerging Asia.
By contrast, the picture of convergence for the CIS has been dismal. The size of the initial slump was such that it took them more than 15 years for real incomes to recover their pre-transition levels. This essentially implies that after two decades of transition the CIS diverged rather than
converged. The outlook from the present crisis reveals additional risks for their convergence, as soaring commodity prices were the main cause of the growth in the CIS after 1999.
Figure 1: GDP per capita growth and income convergence across world regions
1991 1996 2001 2006 -20 -15 -10 -5 0 5 10 15
GDP per capita growth (% per annum)
CIS Latin America CE Europe Developed countries South-East Asia 1990 1995 2000 2005 60 80 100 120 140 160 180 GDP per capita (1990=100)
Source: World Development Indicators
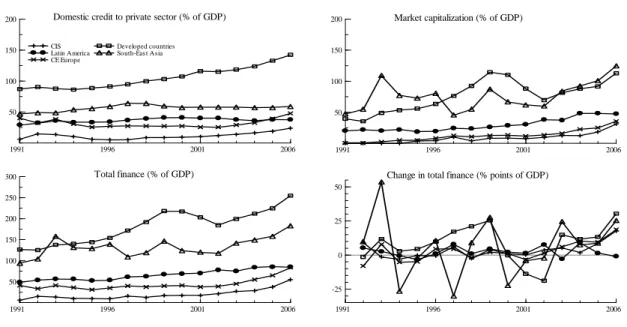
Financial markets played a crucial role in determining the output dynamics in transition countries, both during the phase of the initial collapse and during the subsequent recovery. Calvo and Coricelli (1992, 1993) argued that the initial collapse in output could be interpreted as a trade implosion due to the sudden drying-up of financing for firms induced by the initial liberalization and stabilization programs. This is also confirmed by looking at aggregate data on the GDP shares of domestic credit to private sector. In the upper-left panel of Figure 2, we can observe that credit indeed contracted in the initial years of transition both in Central and Eastern European countries and the CIS group. In the same period, the rest of the world expanded credit.
Subsequently, financial markets in transition countries went through a process of considerable deepening, starting from an initial position of extreme shallowness. This is especially evident for the case of the previously non-existent stock market. Compared to other regions, stock markets remain shallow, with practically no signs of convergence towards shares in GDP observed in developed world and Emerging Asia. A similar observation applies to the depth of credit market in the CIS. In CEE, the process of deepening accelerated to some extent after 2002, and outpaced the levels observed in Latin America. As seen from bottom-right panel of Figure 2, this was mainly because Latin America never joined the significant financial expansion that was common to the rest of the world.
In this respect, we can say that the increased pace of financial deepening in transition countries belonged to a common trend, while in relative terms their financial markets remain shallow when compared to developed world. Nevertheless, we show below that transition countries benefited
more from the process and that financial development may have been a very important factor in income convergence.
Figure 2: Financial deepening by world regions, 1991-2006
1991 1996 2001 2006
50 100 150
200 Domestic credit to private sector (% of GDP)
CIS Latin America CE Europe Developed countries South-East Asia 1991 1996 2001 2006 50 100 150 200 Market capitalization (% of GDP) 1991 1996 2001 2006 50 100 150 200 250 300 Total finance (% of GDP) 1991 1996 2001 2006 -25 0 25 50
Change in total finance (% points of GDP)
Source: World Development Indicators
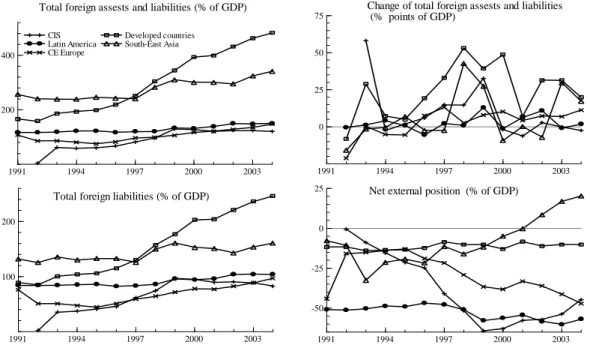
Similar observations apply to measures of financial integration. The upper-left panel of Figure 3 plots the share of total foreign assets and liabilities in the GDP. Starting from low levels, transition countries caught up with Latin America, but remained far less financially integrated than Emerging Asia and the developed world. From the upper-right panel of Figure 3, we can also observe that the latter group of countries shows a faster process of integration throughout the period, again leading to the conclusion that no relative convergence in the levels of financial integration occurred in transition countries. The same observations also hold when looking only at the shares of total foreign liabilities in bottom-left panel of Figure 3.
The bottom-right panel of Figure 3 reveals some details of the net international capital flows that accompanied the growth process in different regions of the world. The relative stability of the net foreign asset position of developed countries suggests that a large expansion of financial integration came through a balanced increase in both inflows and outflows.2 At the upper extreme
lies Emerging Asia. From the negative net asset position, they went into a surplus, which clearly demonstrates that they coupled their fast growth (see Figure 1) with domestic saving growing faster than investments.
Figure 3: Dynamics of financial integration, 1991-2004.
1991 1994 1997 2000 2003 200
400
Total foreign assests and liabilities (% of GDP) CIS Latin America CE Europe Developed countries South-East Asia 1991 1994 1997 2000 2003 0 25 50 75
Change of total foreign assests and liabilities (% points of GDP)
1991 1994 1997 2000 2003 100
200
Total foreign liabilities (% of GDP)
1991 1994 1997 2000 2003 -50
-25 0
25 Net external position (% of GDP)
Source: Lane and Milesi-Ferretti (2006)
Transition countries reveal a rather different pattern. They comply with the standard theoretical view that capital flows into faster growing countries. They accumulated significant negative net asset positions, comparable to the highly indebted Latin American countries.3 The fact that
transition countries have been the fastest growing region in the world, after the initial transition depression, suggests that financial development and financial integration may have crucially contributed to it. The next section presents an econometric assessment of this conjecture.
3 A significant improvement after 1999 can be observed for the CIS. This is related to rising commodity prices in world
3THE ROLE OF FINANCIAL INTEGRATION AND FINANCIAL DEVELOPMENT DURING CRISES
The bulk of the literature on financial integration and financial crises analyzes whether financial openness acts as a catalyst of financial crises (see the literature review in Kose et al., 2009). In this respect, many authors do not find that higher financial integration increases the incidence of financial crises, regardless of whether financial openness is measured through capital mobility (Edwards, 2006) or stocks of foreign assets and liabilities (Bonfiglioli, 2008). The focus of our analysis is different. In the light of 2008’s global financial turmoil, we think it is more appropriate to analyze how financial openness affects macroeconomic dynamics after the crisis has occurred. Loosely speaking, our interest is not in the causes of the financial crises, but in the causal effects of the financial crises, and how these causal effects interact with financial integration.4 The literature
on this latter point is much scarcer. Some evidence can be found in Edwards (2006), who reports that countries with higher capital mobility may face higher reductions in output growth once a crisis occurs.
Although similar in its basic objective, this analysis still differs from the analysis of Edwards (2006) in one important aspect. Financial integration is usually a process that is only a part of a wider process of economic integration that most importantly also includes trade integration. In this respect, the analysis of the role of financial integration in times of financial crisis needs to avoid confounding the effects of the financial crisis on output that are due to general levels of international economic integration, such as openness to trade, given that a financial crisis may also be accompanied by reductions in export demand. For this reason, we concentrate on the effects of financial integration through the finance channel and evaluate the effects of financial integration in times of crises through the finance and growth relation. In this way, we isolate the effects financial integration may have on growth through amplification or compression of credit crunches caused by the crises.
The empirical analysis proceeds in two stages. The first stage, presented in Section 3.1, consists of evaluating the effect of finance on the growth of GDP. Even though we are mainly interested in estimating the effect of financial development on growth, we also acknowledge that financial integration may have a direct effect on growth. In the second step, presented in Section 3.2, we model the depth of financial markets conditional on the level of financial integration (and other controlling variables). With this we want to evaluate whether financial integration stimulates the development of national financial markets or not, and whether there also exists an indirect channel,
4
Given that not all financial crises events can be treated as exogenous, we treat them as endogenous in our empirical application.
through which financial integration affects growth. However, financial openness may also increase exposure to financial shocks. For this reason, we also control in the second stage for the effects of crises on financial development by including dummy variables corresponding to the dates of financial crises given in Cerra and Saxena (2007). Our prior is that financial crises lead to contractions in credit supply, and in this way adversely affect output through the finance and growth relation. To test whether financial openness aggravates or ameliorates the problem, we interact crises dummies with a measure of financial openness. The coefficient pertaining to this interaction term then measures whether a higher degree of financial openness amplifies or cushions the contractionary effect of crises on the supply of credit. At the same time, this also identifies the effect of financial integration on output in times of crises through the finance channel.
3.1The non-linear growth effects of financial development and financial integration in Europe
The empirical approach used in this section is an extension of the analysis in Brezigar-Masten et al. (2008), who analyze threshold effects in the relationship between financial integration, financial development and growth. Given that the focus of the analysis are transition countries, whose profile of international financial linkages is tightly linked to the EU, our selection of country sample concentrates on Europe. In this way, we use aggregate-level annual data for 31 European countries (EU27, Croatia, Ukraine, Russian Federation, Iceland and Norway) for the 1996-2004 period5, and we estimate the following dynamic panel equation:
GDPgrowthit =ρGDPgrowthi,t−1+βFDit+γFIit+µπit+αi+δt+uit, (1)
where the dependent variable equals real GDP per capita growth in country i and period t. In order to capture the persistence of GDP growth, we specify the growth equation dynamically and include lagged GDP per capita growth on the right side of the equation.
FD is a measure of the depth of national financial markets, which we use as a proxy for financial market development. Following Rajan and Zingales (1998) and Guiso et al. (2004), among others, we use a wide measure of financial depth: market capitalization and domestic credit provided by the banking sector as share of GDP. The corresponding coefficient β is the key parameter of interest in this part of the analysis.
5 The dataset ends in 2004 because this is the final year for which the data on measures of financial integration are
FI measures international financial integration. In principle, there are three main sets of measures of financial integration: price-based, news-based and size-based measures (Beale et al., 2004). For the purposes of our analysis, it is important to use a measure that exhibits sufficient time variation. In this respect, we prefer to a use size-based measure, because its construction can be based on more objective statistical grounds. In addition, we follow Prasad et al. (2003) in using stock rather than flow size-based measures. Stocks are less volatile between years and are less prone to measurement error (assuming that such errors are not correlated over time) than measures based on capital flows. Moreover, they are closer to the theoretical concept of financial openness that emphasizes both the ability of foreigners to invest into and lend to a country, and domestic agents to borrow from and invest abroad. In this application, we measure financial integration with the sum of stock of total foreign assets and liabilities as a percentage of GDP. Brezigar-Masten et al. (2008), show that these types of estimations are also very robust to other, more disaggregate, measures of financial integration (FDI, portfolio, etc.).
The empirical model also contains inflation as a proxy for macroeconomic stability. In addition, we considered the public balance, which generally resulted as insignificant, and estimates are thus not reported here.6
αi are fixed effects that allow us to control for time-invariant determinants of growth such as
human capital (the literature usually proxies this with measures of educational attainment, but given the short time period under analysis we assume it is fixed), institutional factors (protection of property rights, administrative barriers, etc.) and other time-invariant unobservable factors that may otherwise bias the coefficients. δt are common time effects that capture the business-cycle effects
that may otherwise cause spurious correlations between growth and explanatory variables.
The source of data, including size-based measures of financial development, is the World Bank’s World Development Indicators database. The source of stock size-based measures of financial integration is the dataset constructed by Lane and Milesi-Ferretti (2006).
Given the dynamic specification of the panel equation (1), the proper estimator is the Arellano and Bond (1991) GMM estimator. It is also very convenient that the GMM procedure at the same time allows us to control for endogeneity bias induced by reverse causality running from GDP growth to financial integration, the development of national financial markets and other explanatory variables.
We focus on the results of the one-step estimator, because simulation studies (Arellano and Bond (1991), Blundell and Bond (1998), Bond and Windmeijer (2000)) show very modest efficiency gains from the two-step estimator, even in the presence of considerable heteroskedasticity. Furthermore, the dependence of the two-step weight matrix on estimated parameters makes the usual asymptotic distribution approximations less reliable for the two-step estimator. Simulation studies showed that the asymptotic standard errors tend to be much too small or the asymptotic t-ratios much too big for the two-step estimator, in the sample sizes where the equivalent tests based on the one-step estimator are quite accurate.
The consistency of the GMM estimator depends on the validity of its instrument set. To address this issue, we consider two specification tests suggested by Arellano and Bond (1991), Arellano and Bover (1995), and Blundell and Bond (1997). The first is the Sargan test of over-identifying restrictions, which tests the overall validity of instruments by analyzing the sample analog of moment conditions used in the estimation process. Since the Sargan test over-rejects in the presence of heteroscedasticity, we use its two-step version. The second test examines the hypothesis that the error terms are not serially correlated. In the difference regression, we test whether the differenced error term is second-order serially uncorrelated (by construction, the differenced error term is first-order serially correlated even if the original error term is not).
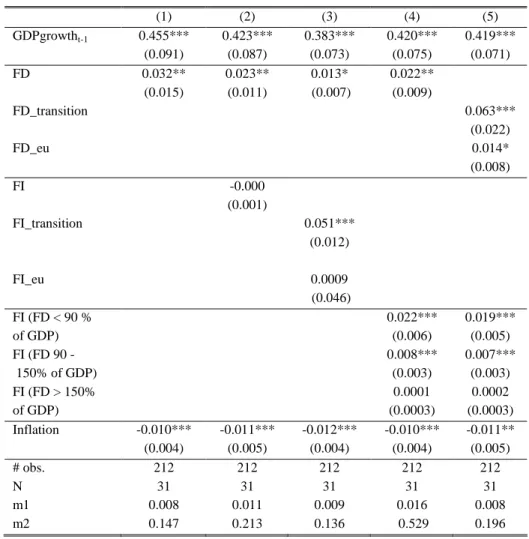
The results of estimation of model (1) are given in Table 1. As mentioned earlier, our main interest lies in parameter β, the coefficient of the financial development variable, FD. In the baseline specification in column (1), the coefficient is significantly positive. Thus, a higher supply of finance stimulates growth both in the short and long run. In column (2) we add a measure of financial integration to the model. The variable FI is insignificant, while the coefficient of financial development remains significantly positive. In our previous work (see Brezigar-Masten et al., 2008) we argued that financial integration affects growth in a non-linear manner. Here, we capture this non-linearity in two ways. The first is by allowing the coefficient of FI to differ between transition countries (FI_transition) and developed European economies (FD_eu).
Returning our attention to estimates of the parameter β, we see that controlling for threshold effects in financial integration reinforces the estimated effect of financial development on growth. For this reason, we consider one additional modification of the model by splitting the effect of financial development between transition and developed European countries (see column 5). As it turns out, both coefficients are significantly positive, but the stimulus that financial development of financial markets gives to growth in transition economies exceeds the one in developed Europe by a factor of 4.
Table 1: The effect of financial development and financial integration on growth in Europe, 1995-2004 (dependent variable: GDP per capita growth)
(1) (2) (3) (4) (5) GDPgrowtht-1 0.455*** 0.423*** 0.383*** 0.420*** 0.419*** (0.091) (0.087) (0.073) (0.075) (0.071) FD 0.032** 0.023** 0.013* 0.022** (0.015) (0.011) (0.007) (0.009) FD_transition 0.063*** (0.022) FD_eu 0.014* (0.008) FI -0.000 (0.001) FI_transition 0.051*** (0.012) FI_eu 0.0009 (0.046) FI (FD < 90 % 0.022*** 0.019*** of GDP) (0.006) (0.005) FI (FD 90 - 0.008*** 0.007*** 150% of GDP) (0.003) (0.003) FI (FD > 150% 0.0001 0.0002 of GDP) (0.0003) (0.0003) Inflation -0.010*** -0.011*** -0.012*** -0.010*** -0.011** (0.004) (0.005) (0.004) (0.004) (0.005) # obs. 212 212 212 212 212 N 31 31 31 31 31 m1 0.008 0.011 0.009 0.016 0.008 m2 0.147 0.213 0.136 0.529 0.196
Notes: First step GMM results. All regressions include common time effects. Robust standard errors in parentheses. ***, ** and * denote statistical significance at 1, 5 and 10%, respectively. Four lags of all variables used as instruments in the GMM procedure. Sargan test of over-identifying restrictions (obtained from second-step results) in all cases indicate the validity of instrument set (available upon request). m1 and m2 are p-values of tests for first and second order autocorrelation in differenced residuals. Constant not reported. The measure of financial integration (FI) is sum of total assets and liabilities, end-of-period stocks, expressed as a percentage of GDP. The measure of financial development (FD) is the sum of stock market capitalization and domestic credit in percentage of GDP.
3.2Financial development and financial integration during crises
The previous subsection provides evidence of a positive direct effect of financial development and financial integration on growth, which leads to the conclusion that the increasing supply of finance and financial integration indeed fuelled income convergence observed in the previous decade. Financial development and financial integration, however, are not independent processes; on the contrary, they can run in parallel or even act as substitutes. Financial integration can bring similar benefits to those associated with financial deepening; for example, international financial markets may channel funds to profitable investment activities, and portfolio diversification in the world may smooth consumption of households allowing the economy to improve profitability of investment. This raises important policy issues. Firstly, it is important to know whether the deepening of domestic financial markets in transition countries can be fostered by international
financial integration. Secondly, transition countries opened their capital accounts whereby domestic financial markets became not only more competitive, but also more integrated with the rest of the world. In this respect, a natural question arises whether the absorptive capacity of financial markets of transition economies is sufficient to support the pre-crisis levels of financial integration. For all these reasons, the analysis of the indirect channel through which financial integration affect growth in transition economies lies at the centre of our analysis. In other words, in the second stage of analysis, we proceed to examine whether the increase in financial openness contributes to financial development and thereby stimulates growth through the relation confirmed at the first stage. More importantly, within this framework, we can also test how financial integration interacts with financial development in financial crises.
Figure 4: Collapse of global export demand (growth of world merchandise trade)
2000 2001 2002 2003 2004 2005 2006 2007 2008 2009 -60 -50 -40 -30 -20 -10 0 10 20 30 40 %
Source: World Economic Outlook, April 2009.
Financial crises happen for a number of complex reasons, while international financial flows and cross-border ownership of assets provide a channel for their transmission to other countries. In the evaluation of financial openness during periods of crisis, we need to avoid confounding it with other shocks observed during a crisis. As an illustration, consider the example of the collapse of sub-prime mortgage market in the US in 2007, which through a snowball effect grew in 2008 into the largest financial and economic crisis since WWII. Collapse in asset prices and bad loans led the banks to tighten credit. The same causes resulted in a sharp contraction of consumer spending. Both factors together cumulated in an economic slump. Cross-border ownership of toxic US assets created trouble for banks in the rest of the world, extending the credit crunch, with similar consequences, to other parts of the world. Financial integration thus provided a channel of financial contagion. However, the US crisis also affected the rest of the world through trade flows, which may have had a bigger impact on business confidence in manufacturing than financial contagion itself. Figure 4 clearly demonstrates how global trade virtually collapsed at the end of 2008. In our analysis of the effect of financial integration in crises, we want to abstract from the transmission of crises through trade and sharp swings of consumer and business sentiment. Our aim is to disentangle the effects of financial integration in crises on the national supply of finance as we
argue that this is the most important channel through which financial integration potentially amplifies the business cycle in case of adverse shocks.
The empirical analysis of this section estimates the following dynamic panel equation:
FDit=ρFDi,t−1+λFIit+Dcrisisit+ϕFIit×Dcrisisit+γ' Xit+αi+δt+vit , (2)
where, as above, FD denotes the development of national financial markets measured as the share of market capitalization and domestic credit provided by banking sector in GDP (totfin), and FI is a measure of international financial integration. As above, we use the stock of total foreign assets and liabilities as a percentage of GDP (tfinint); however, as a robustness check we also report results using the stock of total foreign assets and liabilities without foreign direct investments (tped). The vector of control variables X contains GDP per capita and captures the demand-for-finance effect. As additional control variables, openness (measured as exports in percentage of GDP), and inflation were also considered, but the results were insignificant. The term αi controls for all time-invariant institutional factors that determine the level of financial development. Dcrisis is a dummy variable that takes on value 1 if country i suffers from a financial crisis, either banking crisis or a currency crisis, in period t. The data on dates of financial crises are taken from the database of Cerra and Saxena (2007), which covers the 1970-2001 period. The empirical analysis of the previous section considered the 1996-2004 sample. The starting date was determined by the availability of data for a wider set of transition economies, while the ending date by the time coverage of financial integration of Lane and Milesi-Ferretti (2006). Combining this dataset with the data on financial crises that ended in 2001 would entail a significant loss of observations. For this reason, the empirical analysis of this section extends the coverage of countries in the sample outside Europe to also include Latin America, Asia and Africa (see appendix for details and descriptive statistic of data). Altogether, the sample contains 64 countries with annual data for 1988-2001; the sources of data are the same as above. Common with previous section are also the reasons to estimate model (2) with the GMM procedure developed by Arellano and Bond (1991). The results are presented in Table 2.
Columns (1) and (2) of Table 2 present the estimates of the baseline model without interaction terms FI×Dcrisis. They show that higher financial integration significantly increases the depth of national financial markets and thus contributes to a higher supply of finance through domestic financial intermediaries. This confirms that in addition to the direct effect of financial integration on growth estimated in Table 1, there also exists the indirect positive effect of financial integration that operates through the development of domestic financial markets.
Columns (3) to (6) contain estimation results for models that incorporate information on financial crises. In columns (3) and (4) only a financial crisis dummy is included, without its interaction with the measures of financial integration. Point estimates of the corresponding coefficient comply with expectations that financial crises reduce the supply of finance. The coefficient, however, is insignificant. When the crisis dummy is interacted with, measures of financial integration results improve. The “credit crunch” effect of financial crises becomes statistically significant, while the interaction term with financial integration is significantly positive. These results demonstrate that a
However, this negative effect on growth is smaller in financially more open countries. Larger access to foreign financial markets thus reduces the contractionary effects of crises. These results therefore reject the view that financial markets in financially more integrated countries suffer more from the credit crunch effects in crises.
Table 2: Effect of financial integration on financial development during crises
tfinint tped tfinint tped tfinint tped
(1) (2) (3) (4) (5) (6) 0.333*** 0.328*** 0.354*** 0.350*** 0.363*** 0.358*** FDt-1 (0.095) (0.094) (0.099) (0.098) (0.096) (0.094) 0.112* 0.138* 0.148** 0.174** 0.166*** 0.198*** FIt (0.064) (0.081) (0.067) (0.0867) (0.062) (0.074) -5.897 -5.612 -11.527** -11.60*** Dcrisist (4.506) (4.570) (4.899) (4.790) 0.037** 0.048** FIxDcrisist (0.019) (0.022) 0.009** -0.0003 0.007** 0.007** 0.006* 0.006* GDPpct (0.004) (0.0002) (0.003) (0.004) (0.003) (0.003) # obs 565 565 565 565 565 565 N 64 64 64 64 64 64 m1 0.035 0.039 0.030 0.032 0.033 0.034 m2 0.268 0.267 0.292 0.293 0.264 0.266
Notes: First step GMM results. All regressions include common time effects. Robust standard errors in parentheses. ***, ** and * denote statistical significance at 1, 5 and 10% respectively. Four lags of all variables used as instruments in the GMM procedure. Sargan test of over-identifying restrictions (obtained from second-step results) in all cases indicate the validity of instrument set (available upon request). m1 and m2 are p-values of tests for first and second order autocorrelation in differenced residuals. Constant not reported.
Key: tfinint - sum of total assets and liabilities, tped - sum of portfolio equity and other debt instruments inflow and outflow. All variables are end-of-period stocks, expressed as a percentage of GDP. The measures of financial development (FD) is the sum of stock market capitalization and domestic credit in percentage of GDP. Dcrisis is a dummy variable for the episodes of banking and currency crisis. GDPpc is GDP per capita in 2000 US$.
4CONCLUDING REMARKS
While distress in financial markets may have been one of the key determinants of output collapses at the onset of transition, this paper also shows that the process of financial development and integration into international capital markets contributed positively to subsequent growth in transition economies.
In this process, many transition economies accumulated considerable levels of negative net foreign asset positions. If it was previously thought that high export growth and low spreads on sovereign and corporate debt make such a situation sustainable and with only modest current account adjustments required in the future, the severity and expected longevity of the financial crisis of 2008 significantly overturns the economic outlook in the region. In such circumstances, a natural question arises: whether policymakers should rethink or even change the supportive policy stance towards financial integration.
In this respect, our estimates show that a higher degree of financial openness does not aggravate the effects of financial crises. Quite the opposite, financially more open countries experience a smaller
decline in the supply of finance and thus a smaller amplification of the business cycle through the finance-growth nexus. In other words, financial integration stimulates a steadier provision of finance through domestic financial markets also in crisis times.
These findings lead to important implications for the future policy of financial integration. Our results show that responding to financial crises through financial protectionism is bound to be counter-productive. Such policies may insulate domestic financial institutions from international financial shocks, but they also deprive them of sufficient sources of finance and risk-hedging opportunities. To pay the price, the domestic economy faces higher financial constraints. Protectionist measures of many countries are thus bound to results in a bad global equilibrium and prolong the effects of the crisis. Intense efforts of developed countries and international financial institutions to stabilize international flows of capital represent a correct policy response. Transition countries, as the region that has suffered the most from this in the present crisis, would benefit from such policies the most.
Politicians find it particularly difficult not to endorse short-sighted and populist measures. Financial openness makes countries more exposed to international financial turmoil. In addition, financial markets react swiftly – very often also in speculative manner – to domestic economic imbalances. The process of financial integration is in such cases easily held responsible for the crises and serves as scapegoat for short-sighted protectionist measures that very often do not acknowledge policy mistakes from the past, and hinder the need for structural reform. In such circumstances, ideas of protectionist measures quickly move to the top of the political agenda.
The crisis of 2008 has also hit the developed countries very hard. The fiscal cost of rescue packages of financial institution and the worst recession since WWII will be huge. In spite of compelling evidence that protectionist policies are self-defeating, this makes the prospects for the future financial integration of transition countries uncertain. However, it is precisely the first two decades of transition that offer good lessons in support of further financial integration. The most successful transition economies are the ones that joined the process of EU integration and subsequently became members of the European Union. More importantly, even within this group we can observe that those countries that adopted the euro are better off in the current crisis.
REFERENCES
1. Arellano, M. and S. Bond (1991), “Some Tests of Specification for Panel Data: Monte Carlo Evidence and an Application to Employment Equations“, The Review of Economic Studies, 58, 277-297.
2. Arellano, M. and O. Bover (1995), “Another Look at the Instrumental Variable Estimation of Error-Components Models”, Journal of Econometrics, 68 (1), 29-51.
3. Baele, L., A. Ferrando, P. Hördahl, E. Krylova and C. Monnet, (2004), “Measuring financial integration in the euro area”, ECB Occasional Paper No. 14.
4. Blundell, R. and S. Bond (1997), “Initial conditions and moment restrictions in dynamic panel data models”, Journal of Econometrics, 87 (1), 115-143.
5. Bond, S. and F. Windemeijer (2000), “Estimation in dynamic panel data models: improving on the performance of the standard GMM estimator”, IFS Working Papers W00/12, Institute for Fiscal Studies.
6. Bonfiglioli, A. (2008), “Financial Integration, Productivity and Capital Accumulation”, Journal of
International Economics, 76, 337-355.
7. Brezigar-Masten, A., F. Coricelli and I. Masten (2008), “Non-linear Growth Effects of Financial Development: Does Financial Integration Matter”, Journal of International Money and Finance Vol. 27 No. 2.
8. Calvo, G. and F. Coricelli (1992), “Stagflationary effects of stabilization programs in reforming socialist countries: Enterprise-side and household-side factors”, World Bank Economic Review, vol. 6
9. Calvo, G. and F. Coricelli (1993), “Output collapse in Eastern Europe: The role of credit”, IMF Staff
Papers, vol. 40, n. 1, 32-52.
10. Campos, N.F. and F. Coricelli, (2002), “Growth in transition: what we know , what we don't, and what we should”, Journal of Economic Literature, Vol. XL, 793-836.
11. Cerra, V. and S. C. Saxena (2007), “Growth Dynamics: The Myth of Economic Recovery”, American
Economic Review.
12. Coricelli, F., B. Jazbec and I. Masten (2008), “Sources and Obstacles for Growth in Transition Economies: the Role of Credit”, Festschrift in Honor of G. Calvo, MIT Press.
13. Edwards, S. (2001), “Capital Mobility and Economic Performance: Are Emerging Economies Different?” NBER Working Paper No. 8076 (Cambridge, Mass.: National Bureau of Economic Research).
14. Edwards, S. (2008), “Financial Openness, Currency Crises, and Output Losses” In: Financial Markets Volatility and Performance in Emerging Markets, eds: Edwards, S. and M. G. P. Garcia, NBER books, 2008, 97-120.
15. Guiso, L., T. Jappelli, M. Padula, and M. Pagano, (2004), “Financial Market Integration and Economic Growth in the EU”, Economic Policy, 523-577.
16. Kose, A. M., E. Prasad, K. Rogoff and S-J. Wei (2009), “Financial Globalization: A Reappraisal”, IMF
Staff Papers, 56(1), p. 8-62.
17. Lane, P. R. and G. M. Milesi-Ferretti (2006), “The External Wealth of Nations Mark II: Revised and Extended Estimates of Foreign Assets and Liabilities, 1970-2004”, IMF Working Paper 06/69
18. Lane, P. R. and G. M. Milesi-Ferretti (2007), “Capital Flows to Central and Eastern Europe”, Emerging
Markets Review 8, 106 – 123.
19. Prasad, E. S., K. Rogoff, Wei, S. and M. A. Kose (2003), “Effects of Financial Globalization on Developing Countries: Some Empirical Evidence”, IMF Occasional Paper 220.
20. Rajan, R. and L. Zingales (1998), “Financial dependence and growth”, American Economic Review, 88, 559-586.
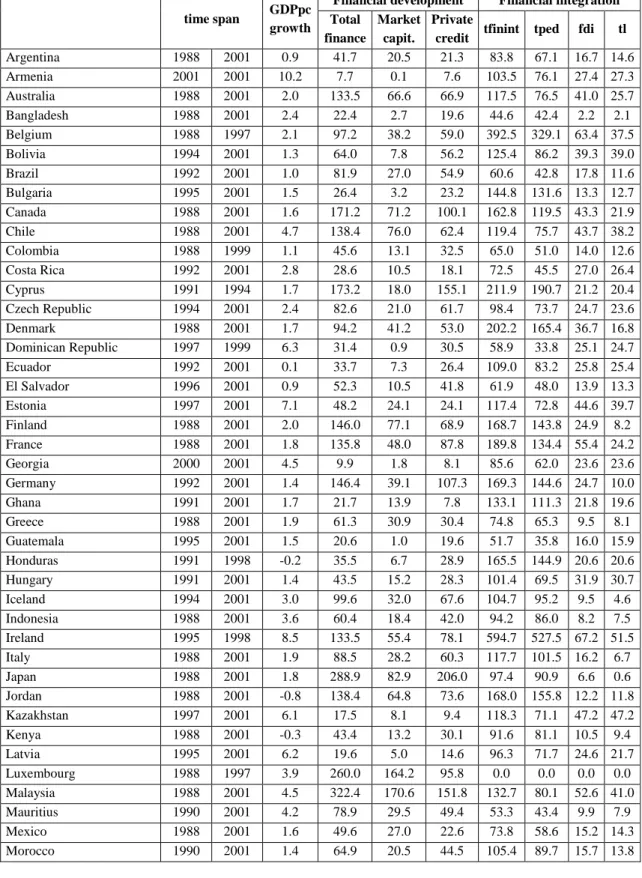
DATA APPENDIX
Table A1: Descriptive statistics of data used in Section 3.2
Financial development Financial integration time span GDPpc growth Total finance Market capit. Private
credit tfinint tped fdi tl
Argentina 1988 2001 0.9 41.7 20.5 21.3 83.8 67.1 16.7 14.6 Armenia 2001 2001 10.2 7.7 0.1 7.6 103.5 76.1 27.4 27.3 Australia 1988 2001 2.0 133.5 66.6 66.9 117.5 76.5 41.0 25.7 Bangladesh 1988 2001 2.4 22.4 2.7 19.6 44.6 42.4 2.2 2.1 Belgium 1988 1997 2.1 97.2 38.2 59.0 392.5 329.1 63.4 37.5 Bolivia 1994 2001 1.3 64.0 7.8 56.2 125.4 86.2 39.3 39.0 Brazil 1992 2001 1.0 81.9 27.0 54.9 60.6 42.8 17.8 11.6 Bulgaria 1995 2001 1.5 26.4 3.2 23.2 144.8 131.6 13.3 12.7 Canada 1988 2001 1.6 171.2 71.2 100.1 162.8 119.5 43.3 21.9 Chile 1988 2001 4.7 138.4 76.0 62.4 119.4 75.7 43.7 38.2 Colombia 1988 1999 1.1 45.6 13.1 32.5 65.0 51.0 14.0 12.6 Costa Rica 1992 2001 2.8 28.6 10.5 18.1 72.5 45.5 27.0 26.4 Cyprus 1991 1994 1.7 173.2 18.0 155.1 211.9 190.7 21.2 20.4 Czech Republic 1994 2001 2.4 82.6 21.0 61.7 98.4 73.7 24.7 23.6 Denmark 1988 2001 1.7 94.2 41.2 53.0 202.2 165.4 36.7 16.8 Dominican Republic 1997 1999 6.3 31.4 0.9 30.5 58.9 33.8 25.1 24.7 Ecuador 1992 2001 0.1 33.7 7.3 26.4 109.0 83.2 25.8 25.4 El Salvador 1996 2001 0.9 52.3 10.5 41.8 61.9 48.0 13.9 13.3 Estonia 1997 2001 7.1 48.2 24.1 24.1 117.4 72.8 44.6 39.7 Finland 1988 2001 2.0 146.0 77.1 68.9 168.7 143.8 24.9 8.2 France 1988 2001 1.8 135.8 48.0 87.8 189.8 134.4 55.4 24.2 Georgia 2000 2001 4.5 9.9 1.8 8.1 85.6 62.0 23.6 23.6 Germany 1992 2001 1.4 146.4 39.1 107.3 169.3 144.6 24.7 10.0 Ghana 1991 2001 1.7 21.7 13.9 7.8 133.1 111.3 21.8 19.6 Greece 1988 2001 1.9 61.3 30.9 30.4 74.8 65.3 9.5 8.1 Guatemala 1995 2001 1.5 20.6 1.0 19.6 51.7 35.8 16.0 15.9 Honduras 1991 1998 -0.2 35.5 6.7 28.9 165.5 144.9 20.6 20.6 Hungary 1991 2001 1.4 43.5 15.2 28.3 101.4 69.5 31.9 30.7 Iceland 1994 2001 3.0 99.6 32.0 67.6 104.7 95.2 9.5 4.6 Indonesia 1988 2001 3.6 60.4 18.4 42.0 94.2 86.0 8.2 7.5 Ireland 1995 1998 8.5 133.5 55.4 78.1 594.7 527.5 67.2 51.5 Italy 1988 2001 1.9 88.5 28.2 60.3 117.7 101.5 16.2 6.7 Japan 1988 2001 1.8 288.9 82.9 206.0 97.4 90.9 6.6 0.6 Jordan 1988 2001 -0.8 138.4 64.8 73.6 168.0 155.8 12.2 11.8 Kazakhstan 1997 2001 6.1 17.5 8.1 9.4 118.3 71.1 47.2 47.2 Kenya 1988 2001 -0.3 43.4 13.2 30.1 91.6 81.1 10.5 9.4 Latvia 1995 2001 6.2 19.6 5.0 14.6 96.3 71.7 24.6 21.7 Luxembourg 1988 1997 3.9 260.0 164.2 95.8 0.0 0.0 0.0 0.0 Malaysia 1988 2001 4.5 322.4 170.6 151.8 132.7 80.1 52.6 41.0 Mauritius 1990 2001 4.2 78.9 29.5 49.4 53.3 43.4 9.9 7.9 Mexico 1988 2001 1.6 49.6 27.0 22.6 73.8 58.6 15.2 14.3 Morocco 1990 2001 1.4 64.9 20.5 44.5 105.4 89.7 15.7 13.8
Netherlands 1988 1997 2.5 154.3 67.2 87.1 265.7 200.9 64.8 25.1
New Zealand 1988 2001 1.2 133.3 41.5 91.8 152.8 92.1 60.7 47.6
Nigeria 1988 1998 1.3 17.6 7.0 10.6 185.2 131.9 53.3 45.6
Financial development Financial integration time span GDPpc growth Total finance Market capit. Private
credit tfinint tped fdi tl
Norway 1988 2001 2.4 105.4 28.9 76.5 124.6 98.3 26.3 10.9 Pakistan 1988 2001 1.6 37.3 13.1 24.2 61.9 55.9 6.0 5.4 Paraguay 1993 2001 -0.1 32.9 3.1 29.8 69.3 53.4 15.9 14.4 Peru 1990 2001 1.3 36.2 17.3 19.0 93.2 76.2 17.0 16.3 Philippines 1988 2001 1.2 86.4 49.0 37.3 105.1 91.2 13.9 12.7 Poland 1991 2001 3.6 29.9 7.7 22.2 65.0 55.2 9.8 9.3 Portugal 1988 1998 3.4 81.8 20.0 61.8 107.4 90.2 17.2 14.3 Romania 1996 2001 0.4 11.7 2.5 9.2 56.6 44.3 12.3 12.0 Slovak Republic 1994 2001 4.1 53.1 6.8 46.2 94.0 79.1 14.9 13.6 Slovenia 1994 2001 4.0 38.9 8.3 30.6 68.8 54.2 14.6 11.6 South Africa 1988 2001 0.0 251.2 140.1 111.0 75.6 45.3 30.3 14.3 Spain 1988 2001 2.9 123.9 42.6 81.3 113.4 85.6 27.8 17.8 Sri Lanka 1988 2001 3.4 35.2 13.4 21.8 87.6 78.0 9.6 9.5 Sweden 1988 2001 1.5 180.7 79.1 101.6 233.9 154.0 79.9 26.3 Switzerland 1988 2001 0.9 317.6 155.9 161.7 547.3 471.9 75.4 24.4 Thailand 1988 2001 4.9 160.2 46.5 113.7 88.3 71.4 16.9 15.3
Trinidad and Tobago 1991 2001 2.7 76.5 35.0 41.5 149.3 60.5 88.8 87.3
Turkey 1988 2001 1.0 41.0 20.0 21.0 63.7 59.3 4.3 3.9 Uganda 2001 2001 1.7 6.5 0.6 5.9 103.4 83.0 20.4 17.2 Ukraine 1997 2001 2.9 13.0 4.4 8.6 75.7 66.2 9.4 9.3 United Kingdom 1988 2001 2.2 246.2 129.3 117.0 439.6 383.4 56.2 23.4 United States 1988 2001 1.9 243.5 102.1 141.4 115.4 79.6 35.7 16.5 Uruguay 1993 2000 1.8 35.8 1.1 34.7 112.8 102.0 10.8 10.5 Zambia 1995 2001 -0.1 16.2 8.2 8.1 267.0 207.1 59.8 59.9 Zimbabwe 1988 2001 -0.1 55.6 28.1 27.5 64.6 56.2 8.4 6.5