HAL Id: hal-00000658
https://hal.archives-ouvertes.fr/hal-00000658
Preprint submitted on 30 Sep 2003
HAL is a multi-disciplinary open access
archive for the deposit and dissemination of sci-entific research documents, whether they are pub-lished or not. The documents may come from teaching and research institutions in France or abroad, or from public or private research centers.
L’archive ouverte pluridisciplinaire HAL, est destinée au dépôt et à la diffusion de documents scientifiques de niveau recherche, publiés ou non, émanant des établissements d’enseignement et de recherche français ou étrangers, des laboratoires publics ou privés.
KLUN+ peculiar velocity survey
M. Hanski
To cite this version:
ccsd-00000658 (version 1) : 30 Sep 2003
KLUN+ peculiar velocity survey
M.O. Hanski
Laboratoire de Physique et Chimie de l’Environnement, CNRS Orl´eans
The enhanced Kinematics of the Local Universe (KLUN+) galaxy sample is a collection of galaxies suitable for Tully-Fisher (TF) or Faber-Jackson (FJ) distance estimation. Here we extract a subsample of 6229 KLUN+ galaxies closer than 80h−1 Mpc, and calculate their
distances and peculiar velocities with the Iterative Normalized Distance method. Within this method we can derive an analytical formula, independent from the density inhomogeneities, for correcting the selection biases. The radial peculiar velocities can then be derived from the redshifts and the corrected distances. The velocities are smoothed, and the smoothed velocity field is used as a correction term at the next derivation of normalized distances. This iterative procedure is repeated until converging values are reached. Here we present the resulting map of the radial peculiar velocity field at the < 80h−1 Mpc environment. The infall patterns
towards the main galaxy clusters are clearly visible. The color version of the map, other figures, and animations are provided on the project web site.
1 Background
Peculiar velocities give direct observational information of the gravitationally induced structure formation in action. A peculiar velocity catalog can be used for studying cosmological param-eters, bulk flows, and the theory of structure formation. The data can also be used for setting the initial conditions for constrained simulations.
The largest published peculiar velocity catalog has been the MARK III (Willick et al.5
), which is a compilation of six TF surveys and a sample of ellipticals with Dn-σ distances. There
the spiral samples are converted to a common system and combined with the ellipticals. In the KLUN+ survey we use the same strategy. Our attempt is to use all the available data suitable for TF or FJ studies; the sample is constantly updated by the new published data, most notably those provided by our observational program at the Nan¸cay radiotelescope (Theureau2
). Data obtained from different sources are carefully homogenized to a common system. Presently the sample contains about 20 000 galaxies, with magnitudes in B, I, J, H, and/or K bands, radial
velocities, and rotational velocities (spirals) or central velocity dispersions (ellipticals). For studying the peculiar velocity field, we extract a magnitude limited sample, and exclude galaxies having large errors in the observables. In the present study, the 80h−1 Mpc sphere around us,
we finally have 6229 KLUN+ galaxies. In MARK III the number of galaxies within this distance is only 3442.
2 Iterative Normalized Distance method
The derivation of peculiar velocities requires that we obtain galaxy distances using redshift independent distance indicators, such as the TF or the FJ relation. These have to be corrected for the selection biases, the errors in the derived distances caused by the scatter of the relations and the detection limits. In KLUN studies, a “normalized distance” method has been used for correcting the bias (Theureau et al.3
). There the distances are scaled so that for all objects at a fixed normalized distance the amount of bias is the same. An analytical correction formula can then be applied (Theureau et al.4
).
For obtaining the peculiar velocities, an “Iterative Normalized Distance” method can be used. There the main steps are (only the TF relation is mentioned, but the same procedure works for the FJ relation):
1. Calculate the absolute magnitudes and the normalized distances using the kinematical (redshift) distances.
2. Calculate the TF relation using the unbiased part of the normalized distance diagram. 3. Use the unbiased TF relations and the analytical bias correction formula for estimating
real space galaxy distances beyond the unbiased plateau limit.
4. Interpolate the peculiar velocity field in a Cartesian grid in the redshift space by smoothing the individual peculiar velocities given by the bias corrected TF distances.
5. Go back to step 1, and use the corrected kinematical distances by subtracting the smoothed peculiar velocity field values from the redshift velocities.
This loop is repeated until converging values for the peculiar velocities are obtained. 5–10 iterations are sufficient.
We then use a bootstrap technique to exclude some of the objects causing large uncertainties. From 50 bootstrap replications of the original sample, we seek for any correspondence of a presence/absence of a galaxy in a sample, and large deviations in the peculiar velocity field at the corresponding region. We set a threshold for acceptable deviation, and exclude about 2% of the original sample, causing uncertainties larger than this limit. Finally, the peculiar velocity field is recalculated with the reduced sample.
3 Results
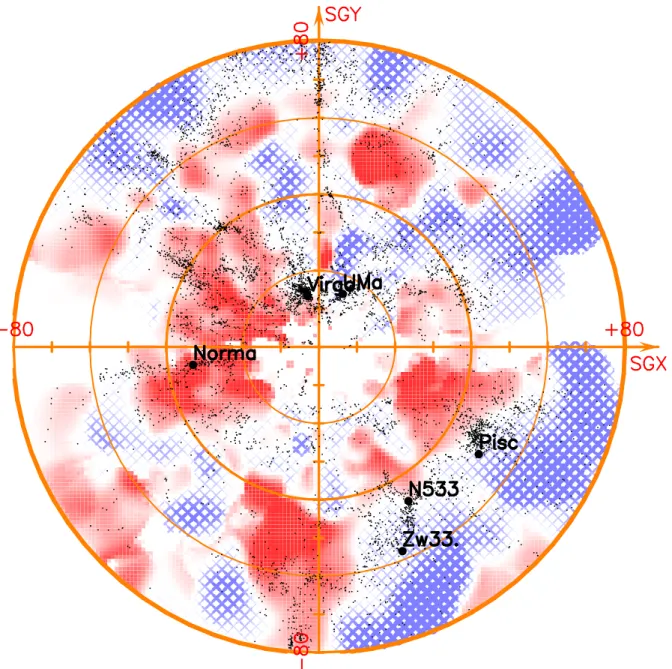
Figure 1 shows a map of the smoothed radial peculiar velocity field in a disc centered on the supergalactic plane. Our galaxy is in the center. The thickness of the disc is zero in the center and increases towards the edge. The opening angle is 15◦ so that at the edge the thickness is
roughly 20 h−1 Mpc. The hatched regions correspond to negative velocities, these regions are
falling towards us. The solid regions are moving away. The darkness of the colors corresponds to the amplitude of the velocity. Regions where the velocity is not defined are white. The black dots are all the galaxies in the HYPERLEDAa
database with measured redshifts (there are about
a
Figure 1: Radial peculiar velocity field in the supergalactic plane. The coordinates are in “real space”, i.e. redshift distances corrected for the smoothed peculiar velocity field, in units of h−1Mpc.
32 000 galaxies in HYPERLEDA with redshift distances < 80 h−1 Mpc). Circles mark some
well known clusters – Virgo, Ursa Major, Norma, Pisces, N533, and Zwicky33. The map is in real space coordinates.
It is worth noting that in the map one observes both the front and backside infall patterns around the main superclusters and structures. It is particularly obvious for the regions of Virgo, Perseus-Pisces, N533, Norma, or even along the Great Wall, which spans from 10 o’clock, 60 h−1 Mpc to 12 o’clock, 80 h−1 Mpc.
In order to present the peculiar velocity field of the whole 80 h−1 Mpc sphere we have
constructed animations showing the disc rotating around one of its axes. These animations, and more figures are available at the website http://klun.obs-nancay.fr/VPEC/vpec.html.
The results presented here are preliminary; the details of the method and the final results will be published shortly (Hanski et al.1
). Acknowledgments
This work has been supported by the Academy of Finland, project “Mapping and numerical modeling of the local galaxy universe”, and the R´egion Centre.
References
1. Hanski, M.O., Theureau, G., and Paturel, G., Astron. & Astrophys. , (submitted) (2003). 2. Theureau, G., These proceedings , (2003).
3. Theureau, G., Hanski, M., Ekholm, T. et al., Astron. & Astrophys. 322, 730 (1997). 4. Theureau, G., Rauzy, S., Bottinelli, L., and Gouguenheim, L., Astron. & Astrophys. 340,
21 (1998).