HAL Id: hal-00160010
https://hal.archives-ouvertes.fr/hal-00160010
Submitted on 4 Jul 2007
HAL is a multi-disciplinary open access
archive for the deposit and dissemination of sci-entific research documents, whether they are pub-lished or not. The documents may come from teaching and research institutions in France or abroad, or from public or private research centers.
L’archive ouverte pluridisciplinaire HAL, est destinée au dépôt et à la diffusion de documents scientifiques de niveau recherche, publiés ou non, émanant des établissements d’enseignement et de recherche français ou étrangers, des laboratoires publics ou privés.
Recombination of vesicles during freeze-drying
Bernard Cabane, Sylvène Blanchon, Carole Neves
To cite this version:
Bernard Cabane, Sylvène Blanchon, Carole Neves. Recombination of vesicles during freeze-drying. Langmuir, American Chemical Society, 2006, 22, pp.1982. �hal-00160010�
Recombination of nanometric vesicles
during freeze-drying
‡
B. Cabane+, S. Blanchon∗ and C. Neves∗
+
PMMH, ESPCI, 10 rue Vauquelin, 75231 Paris Cedex 05, France
∗
Aventis, Department of Pharmaceutical Sciences, Paris Research Center, 94400 Vitry-sur-Seine, France
Abstract
Concentrated dispersions of nanometric lipid vesicles (mean diameter 20 nm) in water/maltose solutions have been freeze-dried, and then redispersed in water, yielding again dispersions of lipid vesicles. At each stage of the freeze-drying process, the organization of the vesicles in the dispersion and their size distribution were examined through Small Angle Neutron Scattering and Gel Permeation Chromatography. It was found that the osmotic deswelling of the vesicles caused them to recombine into larger vesicles. A single burst of recombination events occurred when the maltose concentration in the aqueous phase rose above 100 g/L. The final vesicle population was monopopulated, with a central diameter about twice as large as that of the original dispersion.
‡
1
Introduction
Lipids can dissolve many drug substances that are only sparingly soluble in water. Drug Delivery Vehicles can be obtained by dispersing the lipids in water, as vesicles, or cubosomes (small pieces of cubic phases), or Solid Lipid Nanoparticles. All such aqueous dispersions are susceptible to chemical or biological degradation. In order to avoid degradation, water may be removed through freeze-drying (or spray-drying) after addition of a cryoprotector. It may then be possible, immediately before use, to redisperse the freeze-dried powder into water, and recover an aqueous lipid dispersion. However, there is a concern that the lipid particles in the
redispersed product may not be identical to those in the original dispersion [1-12] For instance, in some circumstances, vesicles are known to aggregate, recombine (fuse) and even transform into multilamellar stacks [2, 6, 10, 11]. A change in vesicle size could have a significant impact on the pharmacological properties of the drug [13]; therefore it is necessary to control phenomena that occur during freeze-drying and could lead to aggregation and recombination of the vesicles [6, 9].
In the present work, aqueous dispersions of extremely small unilamellar vesicles were freeze-dried, after addition of maltose as a cryoprotecting agent. Next, the freeze-dried powder was redispersed in water, and the characteristics of this dispersion were compared to those of the original dispersion. It was found that the redispersed product still contained unilamellar vesicles; however the average vesicle diameter was 45-60 nm, instead of 25 nm in the original dispersion. This change in average size indicated that extensive recombination had occurred at some stage during the process (an average of 5 recombination events would yield a vesicle at the final size). Hence, the freeze-drying process was considered as a critical part of the manufacturing process of the Drug Delivery Vehicles, since the final vesicle sizes were determined at this stage.
The complete manufacturing and freeze-drying process was made of the following stages. (1) The lipids were dissolved in ethanol, dispersed in water, and cycled through a high-pressure homogenizer. At the end of this stage, a homogeneous population of nanometric vesicles was obtained. (2) The cryoprotector (maltose) wad dissolved into this solution. (3) The dispersion was cooled, causing ice crystals to nucleate and grow. (4) Sublimation of the ice yielded the freeze-dried powder. (5) The powder was redispersed, either in water or in an aqueous solution of maltose.
The recombination of vesicles may thus have two possible causes. (a) During step 3, the transfer of water molecules to the ice crystals increases the lipid concentration in the remaining aqueous solution. Hence, the separations between vesicles are reduced, which enhances the frequency of intervesicle contacts possible and the probability of recombination events. (b) During steps 2 and 3, the vesicles find themselves in a medium where the maltose concentration becomes extremely high. Since their bilayers are not permeable to large hydrophilic molecules such as maltose, the sugar must be confined to the interstitial solution outside the vesicles. This produces an osmotic stress on the vesicles. This osmotic deswelling forces the vesicles to take unfavorable curvatures, which may be released by recombination events.
In order to understand these phenomena, it was decided to examine the state of the lipid dispersion at each stage of the manufacturing and freeze-drying process. Two methods were used. Firstly, the lipid dispersion was recovered from the freeze-drying equipment, diluted in water, and the size distribution of the vesicles was analyzed through Size Exclusion Chromatography (SEC) [14, 15]. Changes in the size distribution were taken as evidence of recombination events that occurred during freeze-drying. Secondly, the vesicle dispersion (or the freeze-dried powder) was again recovered from the freeze-drying equipment and examined without dilution through Small Angle Neutron Scattering (SANS). The interference patterns yielded the average center-center distance between vesicles, and hence the average mass of lipid per vesicle. Changes in this number indicated that recombination events had occurred. Moreover, the vesicle diameter and the separation between the surfaces of neighboring vesicles could be calculated according to a geometrical model for spherical vesicles. This made it possible to search for deviations from this model, which would indicate that the vesicles had changed shapes.
Additional experiments were also performed in order to test the two main hypotheses, i.e. recombination caused by increased vesicle concentration or recombination caused by changes in vesicle shapes. The first hypothesis was tested by evaporating water from the dispersion, which forced the vesicles closer together, in absence of any osmotic stress. The other one was tested by deswelling the vesicles through osmotic stress, without changing their distances, simply by adding maltose to the dispersion (Figure 1). The effects of both treatments were compared with the phenomena that have been observed during freeze-drying. From this comparison, it was possible to determine the mechanisms through which nanometric vesicles
Figure 1. The recombination of vesicles may result from two phenomena: (a) extraction of water in the absence of osmotic stress; (b) deswelling of the vesicles through osmotic stress, at a constant lipid concentration in water. During freeze-drying, both phenomena are combined.
2
Manufacturing and freeze-drying process
2.1 Chemicals
The vesicles were made with the two following lipids. Phospholipon 90G (PL90) is diacyl-glycerol phosphatidylcholine, with a fatty acid composition typical of soybean (palmitic acid 12%, stearic acid 3%, oleic acid 10%, linoleic acid 66% and linolenic acid 5%). The molecular formula is C44H75O8PN corresponding to a mean molecular mass of 776 Da. Its
typical content in PC is 93%. Minor components of this lipid are lysophosphatidylcholine (3%) and α-tocopherol (0.1 %). PGNa is a diacylphosphatidylglycerol sodium salt with fatty acid composition typical of soybean. The molecular formula is C42H78O9PNa corresponding to
a mean molecular mass of 780 Da. The content in PG is around 98%. These lipids were purchased from Lipoid and used without further purifications. All studies were performed, however, with the same batch and quality of Phospholipon 90G to avoid variability. Moreover, some homogenization experiments were also performed using pure Phospholipon, and the obtained vesicles were of the same size and shape.
Maltose monohydrate (C12H22O11 + H2O, molar mass 360 + 18 Da), sodium chloride and
ethanol were of analytical grade, purchased from Solvay. For neutrons scattering experiments, H2O was replaced by D2O.
2.2 Liposomes
Multilamellar liposomes were prepared with the classical “film” method. A mixture of PL90 (96 %) and PG-Na (4 %) was dissolved in sufficient amount of ethanol at a temperature of 50°C. The ethanol was evaporated in a rotating evaporator to yield a film, which contained less than 2% ethanol. The film was then redispersed in an aqueous salt solution (NaCl 150 ppm) using a rotor-stator mixer. The final composition is: lipid 100g/L, NaCl 0.115g/L, EtOH 2g/L. This dispersion was homogenized using a laboratory high-pressure homogenizer (Microfluidizer 110Y, Microfluidics International Technology). The dispersion passed continuously through an interaction chamber at 600-800 bar, during a period of time corresponding to at last 10 cycles. Finally, different amounts of maltose (100 to 600 g/L) were added to this dispersion. The scale of the preparation was from 100 ml to 1 000 ml.
2.2 Freeze-drying
Glass vials containing 4.6 ml of dispersions were placed into a pilot freeze-dryer with shelves of 0.9 m2
(SMH 90, Usifroid). They were cooled to a temperature of – 35°C and maintained in this frozen state for 90 minutes. At regular intervals during this freeze-drying process, samples of the partly frozen mixtures were collected and brought back to room temperature. In these samples, the ice crystals dissolved in the interstitial maltose solution, to give lipid dispersions with the same lipid concentration as the original dispersion.
The shelves were then heated up to 0°C during the sublimation stage. The pressure was set to 320 µbar, leading to a product temperature around 20°C. For the secondary desiccation, the shelves temperature was increased up to 30°C with a lower pressure of 80 µbar. The freeze-dried products were then closed under nitrogen atmosphere. Samples were also collected after sublimation of the ice crystals (then the final lipid concentration was higher) and after complete evaporation of water and ethanol (dry powders). Finally, for particle size measurements, the freeze-dried products were reconstituted with 3.6 ml water or in water containing maltose at an isotonic concentration. The dispersion was quasi-instantaneous, and did not require any mechanical agitation.
In the following, this homogenization and freeze-drying process will be called the “standard process”
2.2 Concentration without freeze-drying
Other experiments were performed in order to produce either a higher lipid concentration (reducing the separation between neighboring vesicles) or a higher maltose concentration (deswelling the vesicles through osmotic stress), without any freeze-drying. In order to increase the lipid concentration, the dispersion obtained after high-pressure homogenization was evaporated at room temperature and reduced pressure, until the lipid volume fraction was 0.35. In order to increase the maltose concentration, dry maltose was dissolved at room temperature in the aqueous dispersion obtained through high-pressure homogenization, until the maltose concentration was 400 g/L. Finally, both concentrations were raised simultaneously, through evaporation of a dispersion containing maltose at 100 g/L.
2.3 Freeze-drying with maltose inside the vesicles
Other processes were tried in order to avoid the recombination of vesicles. In one experiment, maltose (100 g/L) was added before high-pressure homogenization, in order to produce dispersions where maltose would be evenly distributed between the interior and the exterior of the vesicles. These dispersions were freeze-dried as described in the standard process.
3
Analytical methods
3.1 Size exclusion chromatography (SEC)
The vesicles were physically separated according to their sizes in chromatography columns. For this purpose, vesicle dispersions were diluted (to 1 g/L) in aqueous LiNO3 (0.01 M)
solutions and a small volume of each (200 µL) was injected at a flow rate of 1mL/min into a set of chromatography columns (TSK PW 6000, PW 5000 and PW 4000).
The eluted vesicles were detected through a refractometer. The index of refraction of the eluent was 1.335 and the index of refraction increment of the vesicle dispersions was dn/dc = 0.15 ml/g. The refractive index elution profile gave the distribution of lipid mass vs. elution volume. The total mass of eluted lipid was close to the injected amount, indicating that the vesicles were eluted according to their sizes and not retained in the columns. The elution volumes were calibrated with standard polymers (pullulans). Through this calibration, the
distribution of lipid mass vs. hydrodynamic radius was obtained; the average hydrodynamic radius of the vesicles was determined from the peak of this distribution.
There is a concern that the hydrodynamic radii determined in this way may not correspond to the geometrical radii of the vesicles, because vesicles may not be eluted through the columns in the same way as the standard polymers used for calibration. For this reason, a light scattering detector (Chromatix KMX 6 operated at a scattering angle of 6 °) was used to obtain the weight average and number average mass per vesicle. These values were compared with the mass calculated from the hydrodynamic radii, using a simple model of the vesicle (bilayer thickness e = 4 nm). Good agreement was obtained between the weight-averaged mass determined through light scattering and the weight-averaged mass calculated from hydrodynamic radii, confirming that the vesicles were eluted according to their geometrical sizes.
3.2 Transmission electron microscopy
The vesicle shapes and sizes were also observed through Cryo-Transmission Electron microscopy (CRYO-TEM) [16]. Thin liquid films of diluted dispersions (x10) were prepared on perforated carbon films supported on 3 mm electron microscope grids. A specimen was prepared by applying a small (about 3µl) drop onto the grid, blotting most of it to the desired thickness (under 200 nm) and plunging it into liquid ethane at its melting point. This ultra-fast cooling caused vitrification of the liquid phase, i.e., specimens became solid-like (vitreous) without change of phase that leads to structural rearrangement. These cryo-specimens were stored under liquid nitrogen, and transferred to the cooling-holder (Gatan 626) of the TEM (JEOL 1200EX), where they were equilibrated at –170°C, and examined with an acceleration voltage of 100 kV.
3.3 Small Angle Neutron Scattering
Scattering methods are based on interference experiments that measure the distribution of all distances within the sample. In neutron scattering, the relevant distances may be chosen through selective deuteration of some components of the sample, since neutrons are scattered by nuclei. The strength of interaction between a neutron and a nucleus is characterized by a nuclear scattering length. These scattering lengths vary according to the type of nuclei. In particular, there is a large difference between the scattering lengths of H and D nuclei. This makes it possible to obtain a strong contrast between hydrogenated and deuterated materials.
In the present work, normal lipids (with H nuclei) and deuterated water were used, so that the scattering reflected the organization of lipids in D2O.
The scattering pattern results from interferences between neutrons scattered by all nuclei in the irradiated volume. The phase differences that control these interferences are determined by the scalar product Q.r, where r is the vector joining 2 nuclei, and Q is the scattering vector, whose magnitude Q depends on the neutron wavelength λ and scattering angle θ according to:
Q = (4π/λ) sin(θ/2) /1/
In the present work, we used Q values ranging from 0.04 to 0.4 nm-1
, corresponding to real space distances between 150 and 15 nm respectively. At this scale, individual nuclei are not resolved. Instead, the interferences are determined by spatial variations of the density of scattering length, ρ(r). For protonated lipids, this density is ρ = – 0.39 x 10¹⁰
cm–2
; for D2O, it
is ρ = 6.4 x 10¹⁰
cm–2. The difference between these scattering densities is Δρ = 6.71 x 10¹⁰
cm–2
; it is about the largest contrast that can be obtained with organic materials, and it results in a very strong scattering. On the other hand, the scattering density of maltose is much closer to that of the lipid, because maltose is hydrogenated, like the lipid, rather than deuterated. In this case, the difference in scattering density was Δρ = 1.47 x 10¹⁰
cm–2
, which is only 22 % of the scattering density difference obtained in D2O. This low contrast is nevertheless sufficient
to give a weak scattering for lipid vesicles dispersed in dry maltose.
The measured interference pattern is a Fourier Transform of the pair correlation function P(r) of the spatial variation of Δρ:
I(Q) / Iincident = ∫ P(r) exp (i Q.r) dr /2/
P(r) = ∫ Δρ(r’) Δρ(r+r’) dr’ /3/
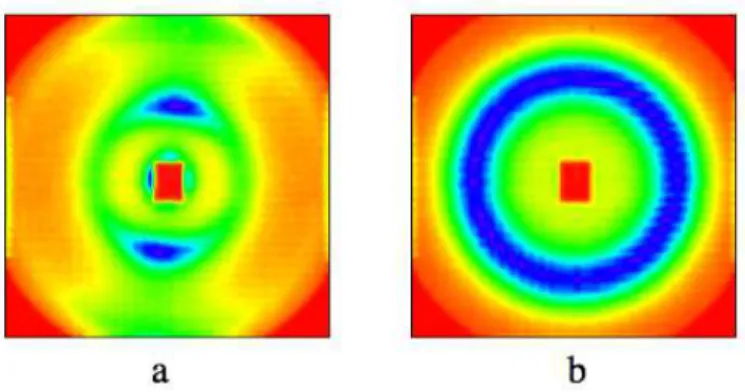
If the spatial distribution of ρ(r) is periodic, then P(r) is an oscillating function, and I(Q) has a set of peaks located at Q.d = 2nπ, where d is lattice vector of ρ(r). For anisotropic ordering, the pattern shows diffraction spots located on either side of the beam, in the direction of repetition. As an example, Figure 2a shows the scattering pattern of the initial dispersion of lipids in water + ethanol. This pattern has 2 strong diffraction spots, on either side of the beam, and 2 weaker ones at a larger spacing. The location of these spots matches the Bragg rule for a lamellar phase, Qd = 2nπ, where the repeat period is d = 41.3 nm. This period is unusually large: for comparison, in the high temperature lamellar phase formed by DPPC in
excess water, the period is only 6.6 nm (bilayer thickness 4.2 nm and water layer thickness 2.4 nm) [18]. In the present lipid mixture, the large period of the lamellar phase is due to a swelling of the water layers, caused by ionic repulsions between lipid bilayers containing PGNa. Since the volume fraction of lipids is known (φ = 0.1), the thickness e of a dry bilayer may be calculated according to φ = e/d, which yields e = 4.13 nm. X ray diffraction experiments performed on lamellar phases of the same lipid mixture with reduced water contents gave a more accurate value e = 4 nm.
Figure 2. (a) Interference pattern obtained from the initial dispersion, made by mixing the lipids with ethanol and water. The two bright spots are diffraction peaks produced by lipid bilayers, extending in the horizontal direction and regularly spaced in the vertical direction. (b) Same dispersion, after 20 cycles through a high-pressure homogenizer. The bright ring corresponds to the isotropic short-range order of vesicles.
For liquid-like ordering, the scattering pattern is isotropic, and it shows rings instead of peaks. As an example, Figure 2b shows the scattering pattern of the same lipid dispersion, after it has been cycled 20 times through the high pressure homogenizer. The isotropic ring shows that the bilayers of the lamellar phase have been fragmented into small objects (presumably SUV), which have only liquid-like ordering instead of anisotropic ordering. The scattering pattern may be radially averaged, yielding a curve of intensity I vs. magnitude Q of the scattering vector. In the case of dispersions with long range repulsions, the scattering curves have a peak at Q = 2π/d where d is the distance between planes of particles. For instance, in a face centered cubic structure, the repetition distance d111 corresponds to the distance between 111
planes; the distance between neighboring particles is then d110 = d111 (√3/√2). If the repulsions
are weak, or only short range, then the peak broadens, and its location is no longer related to the average interparticle distance; nevertheless, the scattering curve may still be calculated
4
Results
4.1 Dispersions made through high pressure homogenization
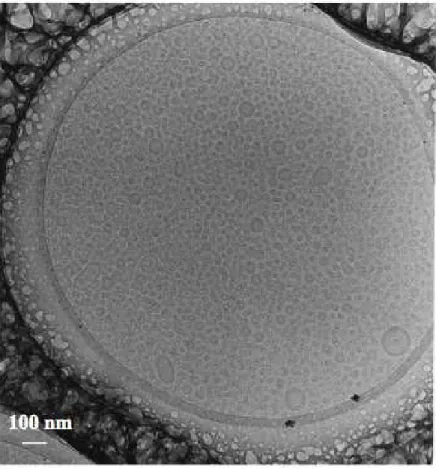
A qualitative view of these dispersions was obtained through CRYOTEM. The image (Figure 3) shows a collection of small unilamellar vesicles, with diameters broadly distributed around 20 nm. NMR experiments using paramagnetic probes dissolved in the external aqueous phase were also performed in order to confirm that the lipid particles were unilamellar vesicles. In these experiments, the NMR signals of lipids contained in the outer monolayer of the vesicles were separated from the NMR signals of inner lipids. The respective intensities were in quantitative agreement with the intensity ratio expected for unilamellar vesicles.
Figure 3. CRYOTEM image of a dispersion made through high-pressure homogenization. Note that most lipid aggregates are SUV, with diameters centered at 20 nm. In a few cases, small vesicles can be seen bound to a large one, or to each other, but this may be a result of the CRYOTEM procedure.
Quantitative data on vesicle sizes were obtained through SEC of diluted dispersions. Dispersions made through high pressure homogenization contain a single vesicle population, with a mean diameter at 25 nm. The addition of maltose at a concentration of 100 g/L, as done in the “standard process”, caused only small changes to this distribution (Figure 4).
Figure 4. Mass distribution curves of a vesicle dispersion made through high-pressure homogenization (), of the same dispersion after maltose addition at 100 g/L (∆), and of the dispersion obtained after freeze-drying and rehydration (x).
The structure of the undiluted dispersions was also examined through SANS. The lipid dispersion made through high-pressure homogenization gave an isotropic interference pattern with a very bright ring (Figure 2b). This interference pattern was radially averaged to give a scattering curve, with a peak located at Q = 0.22 nm-1 (Figure 5). The peak also had the same location in dispersions where maltose was added at a concentration of 100 g/L (for further effects of maltose addition, see section 4.3).
The scattering peak corresponds to the repetition of vesicles in the concentrated dispersion. We assume that the ordering is face-centered cubic, which is the most common type of ordering for repelling particles (for body centered cubic ordering, the relations would be quite similar). In this case, the repetition distance of planes of particles is d111 = 2π/Q = 28 nm, and
Figure 5. Small angle neutron scattering curves of the dispersion made through high-pressure homogenization (), and of dispersions collected at various stages during the freeze-drying process (temperatures indicated in the insert).
The volume of the unit cell is Vunit cell = (d111 √3) 3
= 12100 nm3. In a face centered cubic structure, each unit cell contains 4 particles. Since we know the volume fraction φ of lipids in the dispersion (or in the unit cell), we may calculate the volume of lipid per vesicle:
Vlipid/vesicle = (1/4) φ Vunit cell =(1/4) φ (d111 √3) 3
= 3000 nm3
/4/
This volume is related to the radius R and bilayer thickness e of the vesicles through:
Vlipid/vesicle =(4π/3) [R 3
– (R – e)3
] /5/
Since the bilayer thickness e is known (e = 4 nm), this equation can be inverted to yield the vesicle mean diameter 2R = 19 nm, in good agreement with the SEC distribution. This agreement between the outer diameter 2R calculated from the volume of lipid per particle and the hydrodynamic diameter confirms that the lipid particles are indeed unilamellar vesicles.
Moreover, the comparison of the center - center distance of neighboring vesicles, d110, with
their diameter, 2R, yields the separation between their outer surfaces, D = d110 – 2R = 16 nm.
These distances provide an accurate geometrical picture of the undiluted vesicle dispersion. It has two remarkable features: the very small size of the vesicles, and the fact that their separations are nearly equal to their diameters. The origin of this coincidence will be examined in the discussion.
4.2 Dispersions obtained after freeze-drying and rehydration
A qualitative view of these dispersions was obtained through CRYOTEM. The image (Figure 6) shows that the vesicles are still unilamellar, but with diameters approximately 45-60nm.
Figure 6. CRYOTEM image of the dispersion obtained after freeze-drying, and rehydration. Note that the lipid aggregates are SUV, with diameters centered at 45-60nm.
Quantitative data on vesicle sizes were obtained through SEC of diluted dispersions. Remarkably, the vesicles obtained after freeze-drying, rehydration and dilution still form a
single population; however the mean diameter of this population is at 50 – 70 nm, depending on the freeze-drying conditions (Figure 4)
The structures of dispersions collected during the freeze-drying process were determined through neutron scattering. Since these samples were brought back to room temperature, the ice crystals had melted, and the vesicles were dispersed in the same amount of water regardless of the stage at which they were collected.
The first sample was taken immediately after the formation of ice crystals, signaled by an exothermic event in the sample temperature reading. All the SANS spectra show the same peak, located at Q = 0.12 nm-1, a location which differs from the peak position in the original dispersion (Figure 5). The corresponding center-center distance of vesicles is d = 64 nm. Since the volume fraction of lipids in all these dispersions was the same (φ = 0.1) as in the original dispersion, the volume of lipid per vesicle may be calculated as before; this yields Vlipid/vesicle = 18000 nm
3
, which is about 6 times larger than the original volume of lipid per vesicle. Therefore the original vesicles must have recombined. The average diameter of the “new” vesicles is 42 nm, and their surface/surface separation is D = 22 nm.
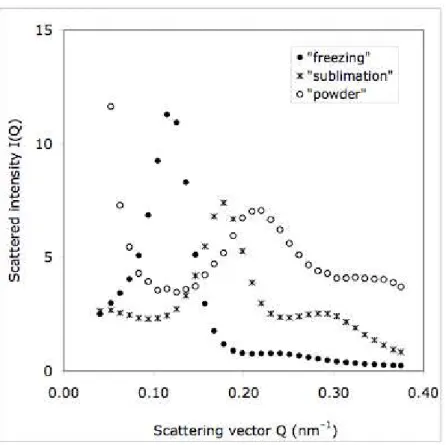
The samples taken at the end of sublimation, and the freeze–dried powders, show peaks at higher Q values; therefore the vesicle - vesicle distance is now shorter (Figure 7). This is a result of the increased lipid concentration caused by the extraction of water (φ = 0.32 at the end of sublimation, and φ = 0.5 in the final powder, after complete evaporation of residual water and ethanol). Taking into account these lipid volume fractions, the volume of lipid per vesicle may be calculated; this yields again Vlipid/vesicle = 18000 nm
3
, the same as during the freeze-drying. This freeze-drying process was repeated on other dispersions made through high-pressure homogenization, and all the measurements on the dried powders gave Vlipid/vesicle
= 15000 to 18000 nm3
Figure 7. Small angle neutron scattering curves of a dispersion collected during the freezing of ice (), of the cake obtained after sublimation of ice crystals (), and of the fully dried powder (o).
Because the lipid concentration is high at this stage, the center-center distance of the vesicles is quite short: from the peak position, d110 is calculated to be 44 nm at the end of sublimation,
and 36 nm in the dry powder. This last distance is now shorter than the outer diameter of spherical vesicles, 2R = 40 nm, as calculated from the volume of lipid per vesicle. This would not be possible if the vesicles had remained spherical. Hence, the vesicles must have been deswelled and flattened out by the osmotic stress from the increased maltose concentration; in this way a short center-center distance is not in conflict with a relatively large vesicle size.
Finally, the vesicle dispersions made through rehydration of the freeze-dried powders give a peak at the same position as the samples collected during freeze-drying (Figure 7). Therefore the addition of water had the effect of separating the vesicles contained in the freeze-dried powder, and did not cause any further recombination events.
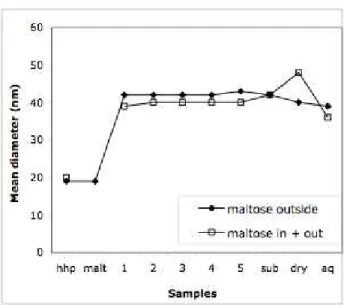
A compilation of the mean vesicle diameters for dispersions collected at various stages of the freeze-drying process, for the dry powder and for the dispersion obtained through rehydration
of this powder is shown in Figure 8. This compilation demonstrates that the first step of freeze-drying, where the ice crystals have nucleated and grown, causes the original vesicles to recombine; no recombinations are observed in subsequent stages of freeze-drying, nor during the final sublimation, nor during the subsequent rehydration. Therefore the recombination
events occurred only during the initial growth of the ice crystals. Moreover, the observation of sharp peaks in the spectra indicates that the vesicle sizes were narrowly distributed (otherwise the intervesicle distances would be spread out, and no peaks would be observed). This confirms the hypothesis of a single burst of recombination events.
Figure 8. Variation of the mean diameter of vesicles after freeze-drying. () “Standard process”: high pressure homogenization (label “hhp”), maltose addition at 100 g/l (“malt”), cooling (temperatures: 1 = –14 °C, 2 = –25, 3 = –28, 4.= –32, 5 = –33), sublimation (labels “sub” and “dry”) and rehydration (label “aq”). The steep increase of vesicle diameters at T = – 14 °C is correlated with the exothermic peak indicating the formation of ice crystals. () Process with maltose inside and outside the vesicles: high pressure homogenization (label “hhp”), cooling (temperatures: 1 = –6 °C, 2 = –28, 3 = –35, 4.= –37, 5 = –39), sublimation (labels “sub” and “dry”) and rehydration (label “aq”). The steep increase of vesicle diameters at T = – 6 °C is correlated with the exothermic peak indicating the formation of ice crystals.
4.3 Systematic effects of maltose addition
The removal of water that resulted from the growth of ice crystals had two direct effects: it increased the concentration of maltose in the aqueous solution, and it also forced the vesicles to be closer to each other. The first of these effects was tested by adding maltose to an
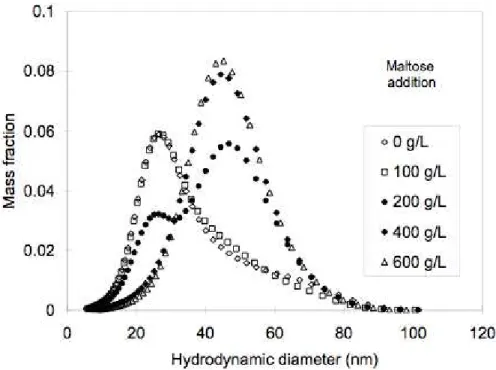
aqueous vesicle dispersion, and taking samples at each step of maltose addition. The results of SEC measurements on these samples are shown in Figure 9. The initial dispersion, prepared by high-pressure homogenization without maltose addition, was made of small vesicles at about 25nm. Maltose addition to a final concentration of 100 g/L caused only small changes in this distribution. However, all subsequent maltose additions caused the growth of a second population, centered at about 50 nm, and with a concentration of maltose of 400g/L, the small vesicles had been completely used up.
Figure 9. Mass distribution curves of vesicle dispersions made through high-pressure homogenization followed by maltose addition. The final maltose concentrations are given in the insert. The shape of the initial distribution is determined by the homogenization process. The other distributions reflect the recombination events that were caused by the addition of maltose.
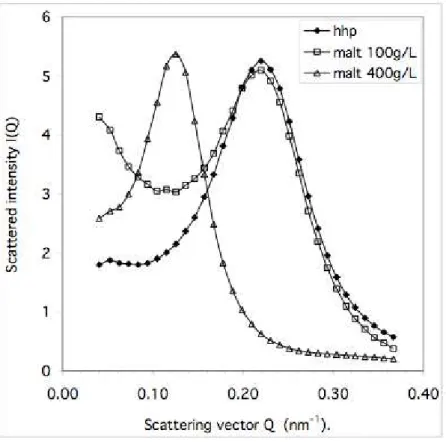
Similar results were obtained on undiluted dispersions, through neutron scattering. The radially averaged spectra of dispersions with added maltose are presented in Figure 10. The dispersion with maltose added at 100 g/L shows a peak at the exact same position as the original dispersion, indicating that the average center-center distance of the vesicles had not changed. Therefore the average volume of lipid per vesicle is the same. The spectrum also shows some excess scattering at low Q; therefore this dispersion must contain a few large
objects (these large objects are also present, but in small numbers, in the distributions of vesicle sizes of the diluted dispersions, obtained through SEC, see Fig 4 and Fig 9).
The dispersion with 400 g/L of maltose gave a peak at smaller Q, corresponding to a larger intervesicle distance, indicating that the vesicles had recombined, in agreement with the observations made through SEC (Figure 10).
Figure 10. Small angle neutron scattering curves of the dispersion made through high-pressure homogenization (), and of the same dispersion after maltose addition at 100 g/L () and at 400 g/L (∆). The rise at small Q in the dispersion with 100 g/L of maltose reflects the formation of a few large aggregates. The shift of the peak in the dispersion with 400 g/L of maltose reflects the increased intervesicle distance resulting from recombination events.
4.4 Effects of lipid concentration
During freeze-drying, the removal of water that resulted from the growth of ice crystals also forced the vesicles to be closer to each other. This effect was studied more systematically by evaporating the water from various vesicle dispersions, at room temperature.
A dispersion without maltose was concentrated by evaporation, until the lipid volume fraction went up from 0.1 to 0.35. The neutron scattering spectra taken at successive stages of
evaporation show a reduction in the center-center distances of vesicles, from 35 nm to 24 nm. Taking into account the increased lipid concentration, the volume of lipid per vesicle and the vesicle diameter can be calculated; they are found to be unchanged at 3000 nm3
and 19 nm (Figure 11). Note that the surface-surface separation of vesicles has been reduced from 16 nm to 4 nm: it is remarkable that no recombination events have occurred, despite the fact that the separation of vesicle surfaces has become quite short. Hence, in concentrated vesicle dispersions, the repulsions between neighboring vesicle surfaces are strong enough to prevent any direct contact of their lipid layers.
A dispersion with added maltose was also concentrated in the same way. The initial maltose concentration was 100 g/L, but at the end of evaporation it had risen to 400 g/L. In this case the mean vesicle diameter went up from 20 nm to 40 nm (Figure 11). The recombination events that occurred in this case must have been caused by the increase in maltose concentration, since the evaporation in absence of maltose did not cause any such events. Remarkably, this progressive increase in maltose concentration produced the same population (mean diameter 40 nm) as the continuous addition of dry maltose or the freeze-drying of dispersions that contained maltose. This demonstrates that recombination events were a systematic evolution of vesicle populations immersed in an external phase containing high concentrations of maltose.
Figure 11. Variations of the mean diameter of vesicles in dispersions that have been concentrated by evaporation at room temperature. (): Dispersion made through high-pressure homogenization, without maltose: the vesicles do not recombine, despite their high volume fraction. (): Dispersion with maltose, initial maltose concentration 100 g/L, final maltose concentration 400 g/L: when the vesicles are immersed in an external phase that contains a high concentration of maltose, they do recombine.
4.5 Freeze-drying with maltose inside the vesicles
In the standard process, maltose is added to the external aqueous phase into which the vesicles are dispersed. Then, during freeze-drying, this external phase becomes more concentrated in maltose. The difference in osmotic pressure between the external and internal phases of the vesicles applies a stress on each vesicle. It has been proposed that it is more advantageous to introduce the sugar before homogenization, so that both external and internal phases contain maltose at the same concentration [2, 8]. Accordingly, a vesicle dispersion was prepared by homogenization of an aqueous solution containing maltose (100 g/L) and dispersed lipids (volume fraction 0.1). This dispersion was then freeze-dried, which caused a rise in the external maltose concentration, until the vesicles were finally dispersed in pure maltose.
Samples were collected at successive stages of freeze-drying, brought back to room temperature, and examined through neutron scattering, as in the standard process. The calculated vesicle diameters follow exactly the same pattern as in the standard process (Figure 8): there is a sudden rise in the mean diameter, indicative of a burst of recombination events when the ice crystals are formed, and then the mean diameter remains stable, indicating that there are no further recombination events after this initial burst. Therefore the extraction of water from the external phase is enough to trigger recombination events, even when both internal and external phases contain maltose.
4.6 Summary of results
All the experimental results presented above can be condensed into three statements.
(1) Extremely small vesicles (mean diameter 20 nm) do not recombine as long as they remain in the external aqueous phase in which they were synthesized. This metastability is preserved when the vesicles are brought closer together through partial evaporation of this aqueous phase.
(2) When the composition of this external phase is changed by the addition of maltose at a high concentration (beyond 100 g/L), these vesicles do recombine. Vesicles that contain maltose (100 g/L) in their internal aqueous phase also recombine during freeze-drying.
(3) Surprisingly, the recombination events stop when the population has reached a mean diameter of 40 – 50 nm, i.e. about twice the original diameter (or, each vesicle of the new population results from an average of 5 recombination events).
5
Discussion
The statements 1, 2 and 3 listed as a “summary of results” characterize a system that has a few metastable states, and is pushed from one to another one by the action of a particular stress. A thermodynamic analysis of this metastability must include consideration of the following questions:
(a) What is the stable state, and which ones are metastable?
(b) Which interactions prevent these metastable states from evolving?
(c) Which changes in solution conditions may trigger their evolution?
(d) What are the consequences of this evolution?
5.1 Why are the vesicle dispersions metastable rather than stable?
SANS experiments performed with the original mixtures of lipids, water and ethanol show that they spontaneously form a lamellar phase, once a homogeneous composition has been achieved through moderate agitation. This phase is known to be the state of lowest free energy for comparable lipids in water and also in aqueous sugar solutions. [2, 18, 19].
During high pressure homogenization, an enormous amount of energy is applied to break up this lamellar phase. The broken pieces of bilayer have a higher free energy that is associated with their edges. The resulting line tension causes the edges to shrink and close up, so that the small bilayers turn into vesicles. These vesicles still have an excess free energy (with respect to infinite flat bilayers) that is due to their curvature (the outer monolayer has a positive curvature, and the inner bilayer a negative one). The final size of the vesicles presumably corresponds to the highest curvature that the vesicles can withstand: smaller bilayers may be formed during high pressure homogenization, but they do not turn into vesicles, and therefore they recombine into larger pieces that end up as vesicles of the standard size.
After high pressure homogenization, these vesicle dispersions no longer evolve: SEC, SANS and light scattering experiments performed at various times after synthesis show no evolution at all, even though the vesicles have a very high curvature and they are quite close to each other. This metastability is maintained even when the dispersions are concentrated through evaporation. Therefore there must be some strong forces that block this evolution.
5.2 Which interactions block the evolution of the vesicle dispersions?
In order to reduce their curvature free energy, the vesicles must recombine. This is possible only through collisions where the lipid bilayers come into contact, so that the lipid molecules can rearrange to form a bridge that leads to the fusion of the vesicles. For vesicles that contain a small fraction of ionized PGNa lipids, such collisions are opposed by repulsions originating from the overlap of clouds of Na+
counterions that surround each vesicle. The Debye length that measures the decay of the counterion density profile away from the vesicle surface is κ–1
= 7 nm. Consequently, the counterion clouds overlap when vesicles approach each other at distances on the order of a few nm. The interaction energy of two approaching vesicles can be calculated according to linearized Poisson-Boltzmann theory, in the limit where each vesicle has a low surface charge, and the overlap of ionic clouds is weak [20]:
W (D) kT = Z2LB D+ 2R
(
)
1 1+κR 2 exp(
−κD)
/6/where W(D) is the interaction energy of two vesicles separated by a surface to surface distance D, kT the energy of thermal agitation, Z the number of ionized lipid molecules at the outer surface of each vesicle, R the vesicle radius and κ the inverse of the Debye length. For lipid mixtures containing 0,4 % of PGNa, there are 0.06 PGNa molecule per nm2 of surface, which yields Z = 75 for a vesicle with radius R = 10 nm. This is indeed a low surface charge, which makes the linearized PB theory adequate. With these numbers, the interaction free energy W is only 2kT for vesicles that are separated by D = 16 nm (average surface to surface separation in the standard dispersion), and it rises to 33 kT for 2 vesicles in contact (D = 0). Therefore the ionic repulsions can effectively prevent the occurrence of recombination events in aqueous vesicle dispersions, even when the vesicles are brought quite close to each other.
5.3 Which changes may trigger the recombination of vesicles?
Recombination has been observed in three different procedures, whenever the maltose concentration of the external aqueous phase exceeds 100 g/L: freeze drying (when the
crystallization of water causes the maltose concentration to increase), evaporation of a vesicle dispersion containing maltose in the external aqueous phase, and direct maltose addition in this aqueous phase. Remarkably, freeze-drying causes recombination of these extremely small vesicles even when they contain maltose in their internal aqueous phase.
In these procedures, the rise in the maltose concentration of the external aqueous phase causes an osmotic stress on the vesicles. Indeed, the bilayers are permeable to water but not to maltose. Water that is initially contained in the inner phase of the vesicles must pass to the outer phase until the solute concentrations on both sides are equal. This transfer causes a deswelling of the vesicles. Since the bilayer area is constant, the deswelling forces the vesicles to take shapes that are flattened out.
The transition to a flattened shape changes the free energy of interaction of neighboring vesicles, making it dependent on their relative orientations [21]. The repulsion is strongest when the flat vesicles are stacked as parallel plates, because their approach forces the compression of ionic clouds that contains 30-40 counterions per vesicle (Figure 12a). The interaction free energy would then be [20]:
W (D) kT =
8π Z2LB
Aκ exp −κ D
(
)
/7/where the disk area A is half the outer area of the original vesicle, i.e. 628 nm2
. This free energy is only 2 kT when the vesicles are at the average separation in the dispersion, but it rises to more than 200 kT at very short separations. On the other hand, the repulsion is much
weaker when the vesicles approach each other through their edges, because in this configuration the ionic clouds are not compressed (Figure 12b). The repulsions are lowest when the flat vesicles are normal to each other, and approach through their edges (Figure 12c). In this case, the area of contact of the two vesicles is reduced to about e2
, where e is the bilayer thickness defined above. Since e = 4 nm (see section 3.3), the area of contact is only 16 nm2
, and the average number of PGNa molecules located in this area is 0.06x16 = 1. Fluctuations in the distribution of PGNa molecules will of course bring this number sometimes to 2, and sometimes to 0. Thus, it is quite likely that one of the approaching edges does not have any PGNa located directly across the opposing edge. In this case, the ionic
repulsion must completely vanish, and the vesicles may come into direct contact.
When the strongly curved edges of neighboring vesicles come into contact, the lipid molecules may reorganize and heal the excess curvature through a recombination of the
bilayers. This process may be facilitated by the presence of edge-actant molecules, such as lysophosphatidylcholine, α-tocopherol and other minor components of PL90 [22]. It may also be facilitated by the high maltose concentration in the external aqueous phase, since it has been shown that high sucrose concentrations (40 %) degrade the stability of unilamellar vesicle dispersions [22, 23].
Figure 12. Configurations for approach of flat vesicles. (a) Stacked as plates: the normal to each vesicle is aligned with the line that separates their centers. (b) “Line” configuration: the normal to each the vesicle is parallel to the other and perpendicular to the line that joins their centers. (c) “Twisted line” configuration: the normal to each the vesicle is perpendicular to the other and to the line that joins their centers.
5.4 When do recombinations start and when do they stop?
Experiments performed on samples collected during freeze-drying show a single burst of recombination events (Figure 8). This burst occurred simultaneously with the rise of the maltose concentration that was caused by the growth of ice crystals. Experiments performed during evaporation of a dispersion that contained maltose, of after straight maltose addition, indicate that it occurred when the maltose concentration exceeded 100 g/L.
The occurrence of a single burst requires a “start” mechanism and a “stop” mechanism. The “start” mechanism is the change to a flat shape, which allows vesicles to come into contact. The condition for this change is that the osmotic pressure of the external phase exceeds that of the internal phase. For vesicles that contain ionized PGNa lipids, the internal osmotic pressure is proportional to the concentration of Na+
counterions inside the vesicles. A rough estimate through Van’t Hoff’s law yields Πint = 0.9 atm for vesicles that still have a spherical shape and
a radius Rint = 8 nm, and Πint = 9 atm when this volume is reduced by a factor of 10. Similarly,
the external osmotic pressure is calculated to be Πext = 7 atm when the maltose concentration
reaches 100 g/L. Thus, the threshold does match the condition Πext > Πint.
The “stop” mechanism operates as soon as the vesicles have reached diameters of 40 – 50 nm (see for instance the distributions of diameters presented in Figure 9: when the external maltose concentration reaches 200 g/L, a new population is formed, centered at 50 nm, instead of a continuous rise in vesicle diameters). It is well known that vesicles of this size survive freeze-drying when a cryoprotectant is added in the external and in the internal aqueous phases [2, 8]. Thus a likely explanation for the “stop” mechanism is that the larger vesicles produced by the recombination events are stable because they contain some maltose, which protects them against complete deswelling. This maltose may have been “ingested”, together with some water, during the recombinations. Indeed, the recombination of highly curved edges into a flat bilayer involves a substantial reorganization of the lipids. These molecular motions may increase the permeability of the lipid layers and facilitate the passage of comparatively large molecules such as maltose.
Another possible explanation for the stop mechanism would be that the larger vesicles have stronger ionic repulsions, simply because they are larger. This could easily be tested by using lipid compositions with different amounts of PGNa, which would change the magnitude or repulsions between neighboring vesicles.
5.5 Can recombination events be avoided?
The recombination events that occur during freeze-drying cause a limited growth of the vesicles. Therefore, if the aim is to retain a population of vesicles of extremely small sizes, it might be worth trying to avoid any recombination events. According to the previous discussion, there are two main routes that could be followed for this purpose:
- Avoid osmotic deswelling by using a cryoprotector that is capable of crossing the bilayers. However, permeating molecules such as glycerol or urea may not have the same effects as non-permeating molecules such as maltose or trehalose [24].
- Avoid forced encounters of the vesicles by enhancing their repulsions, either through the use of PEG-substituted lipids or through an increase in the concentration of PGNa
- Use lipids that are totally free from edge-actant molecules, so that vesicles do not recombine even when they come in direct contact. However, the excess free energy of highly curved bilayers may be so high that recombination is unavoidable for deswelled vesicles.
Alternatively, it may also be argued that the limited burst of recombination events results in a population that still has a very small mean diameter, and also that this final population is rather insensitive to minor changes in the freeze-drying process. Then, it may not be necessary to fight the recombination processes.
Conclusions
Extremely small lipid vesicles (mean diameter 20 nm) have a large excess of free energy with respect to the stable lamellar phase, made of flat bilayers. They can be kept in a metastable state through ionic repulsions that keep the vesicle surfaces apart from each other. This metastability is adequate as long as the vesicles retain a spherical shape: collisions that would lead to vesicle fusion are totally inhibited.
When such vesicles are osmotically deswelled, they become unstable with respect to recombination (fusion). The fusion mechanism operates through encounters where flat vesicles approach each other through their edges: in this configuration, the vesicles do not repel, and they may fuse to heal the excess curvature of their edges.
This instability appears to be a general feature of flat vesicles with highly curved edges. It takes place during freeze-drying, even when the vesicles are formed in presence of a cryoprotectant that is dissolved in their external and internal aqueous phases. It takes place through a single burst of recombination events, leading to a new, metastable population of vesicles with a larger mean diameter (40-50 nm).
The reason for the metastability of the new vesicle population may be that the new vesicles no longer have such highly curved edges, thanks to the ingestion of substantial amounts of
cryoprotectant during fusion events. The link between edge curvature and metastability is an interesting problem that deserves further investigation.
Acknowledgements
It is a pleasure for us to thank P. Lixon (Service de Chimie Moléculaire, CEA - Saclay) for the SEC measurements that are reported in this article, O. Aguerre-Chariol (Rhodia – Aubervilliers) for the TEM images and P.Lindner for help with the SANS experiments.
References
1 Henry-Michelland, S.; Ter-Minassian, L.; Poly, P.A.; Delattre, J.; Puisieux, F. Coll.
Surf. 1985, 14, 269
2 Crowe, L.M.; Crowe, J.H.; Rudolph, A.; Womersley, C.; Appel, L. Arch. Biochem.
Biophys. 1985, 242, 240
3 Strauss, H.; Schurtenberger, P.; Hauser, H. Biochim. Biophys. Acta 1986, 858, 169
4 G.J. Fransen, P.J.M. Salemink and D.J.A. Crommelin, Int. J. Pharm. 1986, 33, 27
5 Crowe, J.H.; Spargo, B.J.; Crowe, L.M. Proc. Natl. Acad. Sci. USA 1987, 84, 1537
6 Talsma, H.; van Steenbergen, M.J.; Salemink, P.J.M.; Crommelin, D.J.A. Pharm.
Res. 1991, 8, 1021
7 Talsma, H.; van Steenbergen, M.J.; Crommelin, D.J.A. Cryobiology 1992, 29, 80
8 Talsma, H.; van Steenbergen, M.J.; Crommelin, D.J.A. Int. J. Pharm. 1991, 77, 119
9 Ausborn, M.; Nuhn P.; Schreier, H. Eur. J. Pharm. Biopharm. 1992, 38, 133
10 Engel, A.; Bendas, G.; Wilhelm, F.; Mannova, M.; Ausborn, M.; Nuhn, P. Int. J.
Pharmaceutics 1994, 107, 99
11 Crowe, J. H.; Leslie S.B.; Crowe, L.M. Cryobiol. 1994, 31, 355
12 Ausborn, M.; Schreier, H.; Brezesinski, G.; Fabian, H.; Meyer, H.W.; Nuhn, P. J.
Controlled Release 1994, 30, 105
13 Nagayasu, A. ; Uchiyama, K. ; Kiwada, H. Adv. Drug Deliv. Rev. 1999, 40, 75
14 Grabielle-Madelmont, C. ; Lesieur, S. ; Ollivon, M. J. Biochem. Biophys. Methods
2003, 56, 189
15 Lesieur, S. ; Grabielle-Madelmont, C.; Paternostre, M. ; Ollivon, M. Chem. Phys.
Lipids 1993, 64, 57
16 Bellare, J. R.; Davis, H.T.; Scriven, L.E.; Talmon, Y. J. Electron Microsc. Technique
1988, 10, 87
17 Inoko, Y.; Mitsui, T.; J. Phys. Soc. Jpn 1978, 44, 1918
18 LeNeveu, D.M.; Rand, R.P.; Parsegian, V.A. Biophys. J. 1977, 18, 209
20 Israelachvili, J. Intermolecular and Surface Forces, Academic Press: New York, 1991
21 Levitz, P.; Delville, A.; Lecolier, E.; Mourchid, A. Progr. Colloid Polym. Sci. 2001,
118, 290
22 Kawakami, K.; Nishihara, Y.; Hirano, K. Langmuir 1999, 15, 7454
23 Kiselev, M.A.; Wartewig, S.; Janich, M.; Lesieur, P.; Kiselev, A.M.; Ollivon, M.; Neubert, R. Chem. Phys. Lipids 2003, 123, 31