HAL Id: in2p3-00025259
http://hal.in2p3.fr/in2p3-00025259
Submitted on 21 Dec 2005
HAL is a multi-disciplinary open access
archive for the deposit and dissemination of
sci-entific research documents, whether they are
pub-lished or not. The documents may come from
L’archive ouverte pluridisciplinaire HAL, est
destinée au dépôt et à la diffusion de documents
scientifiques de niveau recherche, publiés ou non,
émanant des établissements d’enseignement et de
Radio Detection of Cosmic Ray Extensive Air Showers
Richard Dallier, L. Denis, T. Gousset, Fayrouz. Haddad, Pascal Lautridou, A.
Lecacheux, E. Morteau, O. Ravel, C. Rosolen, C. Roy
To cite this version:
Richard Dallier, L. Denis, T. Gousset, Fayrouz. Haddad, Pascal Lautridou, et al.. Radio Detection
of Cosmic Ray Extensive Air Showers. Semaine de l’Astrophysique Française, Jun 2003, Bordeaux,
France. pp.395. �in2p3-00025259�
Radio Detection of Cosmic Ray Extensive Air Showers
Dallier R., Denis L., Gousset T., Haddad F., Lautridou P., Lecacheux A., Morteau E., Ravel O., Rosolen C., Roy C.
Abstract
At the Radio Observatory of Nan¸cay we study the possibility of detect-ing extremely high energy cosmic rays by radio detection of the electro-magnetic pulse radiated during the development of extensive air showers in the atmosphere. Details on the experimental setup and present results on the demonstrative experiment CODALEMA are given .
1
Motivation
In order to demonstrate the existence of radio emission by extensive air showers (EAS), various experiments have been led in the 60’s (Linsley 1963, Jelley 1966, Weekes 2001). These investigations were almost completely withdrawn before the end of the 70’s, due to the increase of anthropic radio emissions, difficulty of interpretation of recorded signals and poorly adapted electronics (see Allan (1971) for a review of this period). In the late 90’s two experimental systems have again been developped (at the CASA-MIA site (Green et al. 2003) and at the KASCADE site (Falcke and Gorham 2003)). In both cases, the antennas are triggered by a particle detector array. No clear evidence for radiofrequencies transients associated with EAS was found by Green and
collaborators, indicating that only primary particles above 1017
eV were detectable with their setup at CASA-MIA. First results of simultaneous detection on KASCADE and LOPES are expected for 2004 (Horneffer et al. 2003).
Different mechanisms of electromagnetic pulse generation have been identified (Allan 1971). Among them, though not dominant, is the negative charge excess in the shower. This contribution to the total electric field depends only from the charge distribution and can be easily estimated (Ravel et al. 2003). For instance, with a primary particle
energy of 1020
eV, a vertical shower with an impact parameter of 1 km produces
via this mechanism an electric field reaching 300 µV×m−1, with a time width of
about 300 ns. Such an electric pulse is potentially measurable on the ground with an antenna. Furthermore, a determination of the pulse waveform may enable one to unfold the charge profile of the shower, while triangulation using at least 3 antennas allows one to extract the location of the shower axis.
2
The CODALEMA demonstrative experiment
Taking into account the time characteristics of the electromagnetic signal, a high sen-sitivity, low directivity antenna with a frequency bandwidth extending from a few hundreds of kHz up to 100 MHz is the best choice. To deduce the primary particle energy and its trajectory from a radio air shower signal, a minimum of 3 antennas is required. Considering those specifications, the DecAMetric array of the Radio Obser-vatory of Nan¸cay (DAM, http://www.obs-nancay.fr) is very well suited. The DAM is made, on a 85 m side square, of 9 × 16 (144) log-periodic, spiral-shaped conic anten-nas, whose gain is + 3 dB in the band 1-100 MHz and over a wide directivity diagram
(90o
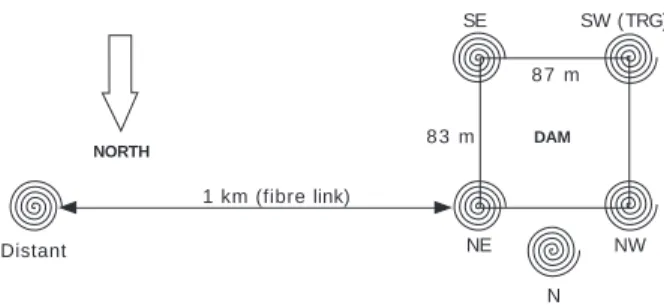
CODALEMA (Cosmic Detection Array with Logarithmic ElectroMagnetic Antennas) is a demonstrative experiment which aims at studying whether a self-triggering radio detection system of cosmic ray air showers is possible. This means that no particle detector is used : one antenna equipped with a dedicated electronics is devoted to trig the signal in a pulse limited bandwidth with a threshold discriminator. We use the 4 corners antennas of the DAM and an additionnal one, installed in the middle of the northern side (Fig. 1). Signals from each antenna come through co-axial wires of equal lengths (150 m). At last, a distant antenna, located 1 km eastbound, and whose signal is transported via an optical fibre, have been installed to serve as a test for a future long-based array, and to check the capability of a fibre link.
NORTH DAM 1 km (fibre link) 8 7 m 8 3 m NE SE NW SW (TRG) N Distant
Figure 1: Current CODALEMA setup.
For each antenna, the electronic line is constituted by a high gain amplifier (+36 dB), a low loss 150 m wire, followed by a high-pass filter (above 400 kHz, filtering AM radio transmitters). On the distant antenna, an optical transceiver is added and acts as a high-pass filter above 10 MHz. Provided that an adapted bandpass filter (33-65 MHz) is added, any of the 5 DAM antennas may be chosen as the trigger. This filter band was chosen after a study of background noises (mainly, radio broadcasting stations and many other anthropic transmitters, either periodic or sporadic). After a trigger event, the signals of the antennas are recorded using 2 GHz digital oscilloscopes (8 bits ADC, 2 GS/s, 10 µs long signal), and are stored on disk for off-line analysis.
3
First results
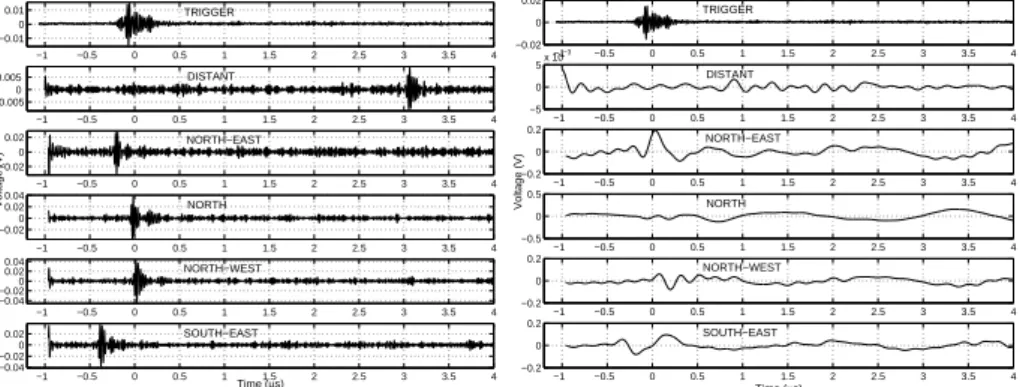
To discuss the analysis as it is presently envisaged, Fig. 2 displays a simulated particle signal with a duration of the order of 100 ns (Ravel et al. 2003) and the effect of filtering in the 0.5 - 9 MHz and 33 - 65 MHz bands. For the latter, one can see the highly oscillating response, due to the filter. Though filtering in this band allows one to cancel numerous radio noises, and thus increases overall dynamic of the signal, it appears impossible with these informations alone to infer the real shape of the original signal. However, this filter band is compatible with a correct time tagging for the event, while a lower band filtering could give informations on the received power. A typical 6 antennas coincidence signal is shown Fig. 3. After an analysis of time delays, arrival direction can be reconstructed. This event comes from a clear E-SE direction, which is not compatible with identified sources of noise. Undoubtly, it presents a wide frequency spectrum, with components both in high (33-65 MHz) and low (0.5-9 MHz) frequency bands, as expected from an electromagnetic pulse (Ravel et al. 2003).
−5 0 5 10 x 10−7 −0.01 −0.005 0 0.005 0.01 0.015 0.02 0.025 0.03 Recorded voltage (V) Time (s)
Simulated pulse H(t).t exp(−t/ ) (H(t) =0 for t < 0, H(t) = 1 for t > 0)
2 τ
Filtered pulse (0.5 − 9 MHz)
Filtered pulse X 10 (33 − 65 MHz)
Figure 2: 0.5 - 9 MHz and 33 - 65 MHz filter responses for a simulated pulse.
At last, the sensitivity of CODALEMA has been measured with the dedicated noise generation system of the DAM. This system delivers a signal whose level is similar to the sky background level on the instrument. This signal is injected in place of the trigger antenna’s signal. In the 33-65 MHz band, such a signal produces a 500 µV rms signal on the oscilloscope, and can be easily digitalized by the ADC. This corresponds
to an electric field amplitude of 2 µV×m−1 in the trigger band. Thus, CODALEMA
is sensitive to the sky background at these frequencies.
At this development stage, CODALEMA is able to detect any electric field transient above sky background level. We have also identified many anthropic noise sources, of which some can easily be removed. Main analysis investment is now put on wide band signal reconstruction, particularly by the use of an adaptive filter algorithm, and on the trajectory reconstruction.
References
[1] J. Linsley, 1963, Phys. Rev. Lett. 10, 146. [2] J.V. Jelley et al., 1966, Nuovo Cimento A46, 649.
[3] T. Weekes, 2001, in : Radio Detection of high Energy Particles, ed D.Saltzberg
and P.Gorham, Proceeding of first Int. Workshop RADHEP 2000, No
579, AIP, Melville, NY, 3.
[4] H.R. Allan, 1971, Prog. in Elem. part. and Cos. Ray Phys., ed J.G Wilson and S.A. Wouthuysen, (N. Holland Pub. Co.), Vol. 10, 171.
[5] K. Green et al., 2003, Nucl. Inst. And Meth. A, 498. [6] H. Falcke, P. Gorham, 2003, Astropart. Phys., Vol. 19, 477.
[7] A. Horneffer et al., 2003, 28th International Cosmic Ray Conference, to be pub-lished by Universal Academy Press, 969.
[8] O. Ravel et al., 2003, 9th Pisa Meeting on Advanced Detectors, to be published by Elsevier Science. See also arXiv:astro-ph/0306255 v1.
−1 −0.5 0 0.5 1 1.5 2 2.5 3 3.5 4 −0.01 0 0.01 −1 −0.5 0 0.5 1 1.5 2 2.5 3 3.5 4 −0.005 0 0.005 −1 −0.5 0 0.5 1 1.5 2 2.5 3 3.5 4 −0.02 0 0.02 Voltage (V) −1 −0.5 0 0.5 1 1.5 2 2.5 3 3.5 4 −0.02 0 0.02 0.04 −1 −0.5 0 0.5 1 1.5 2 2.5 3 3.5 4 −0.04 −0.020 0.02 0.04 −1 −0.5 0 0.5 1 1.5 2 2.5 3 3.5 4 −0.04 −0.02 0 0.02 Time (µs) TRIGGER DISTANT NORTH−EAST NORTH NORTH−WEST SOUTH−EAST −1 −0.5 0 0.5 1 1.5 2 2.5 3 3.5 4 −0.02 0 0.02 −1 −0.5 0 0.5 1 1.5 2 2.5 3 3.5 4 −5 0 5x 10 −3 −1 −0.5 0 0.5 1 1.5 2 2.5 3 3.5 4 −0.2 0 0.2 Voltage (V) −1 −0.5 0 0.5 1 1.5 2 2.5 3 3.5 4 −0.5 0 0.5 −1 −0.5 0 0.5 1 1.5 2 2.5 3 3.5 4 −0.2 0 0.2 −1 −0.5 0 0.5 1 1.5 2 2.5 3 3.5 4 −0.2 0 0.2 Time (µs) SOUTH−EAST NORTH−WEST NORTH NORTH−EAST DISTANT TRIGGER
Figure 3: Coincidence transients detected with CODALEMA. Left : signal after 33-65 MHz numerical filtering. Right : after 0.5-9 MHz numerical filtering. From Top to Bottom : trigger, distant (1 km), NE, N, NW and SW antennas respectively. No signal is expected in the 0.5-9 MHz band for the distant antenna, because of the cutting edge of the fibre optics transceiver at 10 MHz. No low frequency signal is observed here for the Northern antenna. Time delays are compatible with an E-SE direction of the event.