HAL Id: hal-01789144
https://hal.archives-ouvertes.fr/hal-01789144
Submitted on 9 May 2018
HAL is a multi-disciplinary open access
archive for the deposit and dissemination of
sci-entific research documents, whether they are
pub-lished or not. The documents may come from
teaching and research institutions in France or
abroad, or from public or private research centers.
L’archive ouverte pluridisciplinaire HAL, est
destinée au dépôt et à la diffusion de documents
scientifiques de niveau recherche, publiés ou non,
émanant des établissements d’enseignement et de
recherche français ou étrangers, des laboratoires
publics ou privés.
The EuWIn Testbed for 802.15.4/Zigbee Networks:
From the Simulation to the Real World
M. D. Abrignani, Chiara Buratti, Davide Dardari, Nancy Rachkidy,
Alexandre Guitton, Flavia Martelli, Andrea Stajkic, Roberto Verdone
To cite this version:
M. D. Abrignani, Chiara Buratti, Davide Dardari, Nancy Rachkidy, Alexandre Guitton, et al.. The
EuWIn Testbed for 802.15.4/Zigbee Networks: From the Simulation to the Real World. ISWCS
(International Symposium on Wireless Communication Systems), 2013, Ilmenau, Germany.
�hal-01789144�
The EuWIn Testbed for 802.15.4/Zigbee Networks:
From the Simulation to the Real World
M. Danilo Abrignani
†, Chiara Buratti
†, Davide Dardari
†, Nancy El Rachkidy
∗,
Alexandre Guitton
∗, Flavia Martelli
†, Andrea Stajkic
†, Roberto Verdone
††CNIT, University of Bologna, Italy
Email:{danilo.abrignani, c.buratti, davide.dardari, flavia.martelli, andrea.stajkic, roberto.verdone}@unibo.it
∗Clermont Universit´e, Universit´e Blaise Pascal, LIMOS, CNRS, France
Email: [email protected], [email protected]
Abstract—EuWIn is the ”European Laboratory of Wireless
Communications for the Future Internet” recently established and funded under the umbrella of the EC FP7 Network of Excellence on Wireless Communications, Newcom♯. The focus of the EuWIn site in Bologna (Italy) is the Internet of Things. One of its scopes is to set up a network composed of 100 radio devices compliant with the IEEE 802.15.4 standard, flexible enough to allow the development and testing of any routing algorithm compatible with such a standard. This paper reports the first comparison of results achieved through an NS-2 simulator developed at LIMOS, CNRS (France), with those of the true network available in Bologna. Results in terms of packet error rate and overhead generated achieved through the two platforms, implementing the same protocol stack, is shown. The differences raised, concerning the practical issues normally not accounted by the simulations, are carefully investigated and discussed.
I. INTRODUCTION
In recent networking research, testbeds gain more and more attention, especially in the context of Future Internet and wireless sensor networks (WSNs). This development stems from the fact that simulations are not considered sufficient for the deployment of new technologies as they often lack realism. Experimental research on testbeds is a promising alternative that can help to close the gap [5]. Motivated by this fact, within the EC FP7 Network of Excellence on Wireless
Communications, Newcom♯1, the European Laboratory of
Wireless Communications for the Future Internet (EuWIn) was established. EuWIn is composed of three sites: the lab-oratories of the research center CTTC of Barcelona (Spain), the EURECOM institute of Sophia-Antipolis (France) and the laboratory of CNIT/University of Bologna (Italy). The EuWIn site in Bologna offers facilities for testing and benchmarking radio network technologies for the future development of the Internet of Things (IoT). In particular, the lab provides more than 200 wireless nodes implementing different types of radio interfaces and distributed according to different platforms:
• Flexible Topology Testbed (Flextop): 100 nodes equipped
with IEEE 802.15.4 radio interface and distributed inside the laboratory at the University of Bologna;
• Data Sensing and Processing Testbed (DataSens): 50
wireless nodes equipped with luminosity and temperature
1See the website: http://www.newcom-project.eu/
sensors and 50 battery equipped, therefore mobile nodes to test delay tolerant routing techniques;
• Localization Testbed (LocTest): 50 Ultra-Wide Band
nodes to test localization algorithms.
This paper deals with the Flextop facility, whose main ob-jectives are: i) to test and fairly compare different routing protocols; ii) to compare results achieved through simula-tors, implementing IEEE 802.15.4-based networks, with those achieved by EuWIn, showing the impact of passing from simulations to a real deployment. More specifically, all net-work protocols to be used over IEEE 802.15.4, being ZigBee, 6lowPAN, or proprietary solutions, could be tested on Flextop. The focus of this paper is on the second objective, therefore on a comparison of results achieved through simulations and experiments.
The main strengths of the Flextop testbed are: i) it is re-motely accessible thanks to over-the-air (OTA) programming; ii) the experimental environment will be stable for the full duration of the experiment, making results certified. The latter is achieved thanks to the following features: i) devices are in fixed and known positions; ii) channel gains between each pair of devices will be measured at the beginning of each test; iii) experiments will be performed during the night, when nobody will be present, avoiding channel fluctuations and changes in the environment. Being the experimental environ-ment well controllable and known a priori, fair comparison among different protocols could be achieved, even though tests are performed at different time instances.
This paper reports the first comparison of results achieved through the Flextop platform with those of an NS-2 simulator developed at LIMOS, CNRS (France). Results in terms of packet error rate and network overhead, achieved through the two platforms implementing the same protocol stack, are presented.
II. RELATED WORKS
The importance of simulation but also the need for testbeds in case of MAC protocol evaluation is well described in [11]. In simulations, network scenarios can be easily constructed and modified, and data can be easily collected. More impor-tantly, simulations can model large scale network topologies that could be very expensive, or even impossible in testbed
experiments. However, wireless network simulators have their own limitations. Due to the abstracted physical-layer model-ing, simulators are often accused of not providing trustworthy realworld results [6].
With reference to Zigbee networks, there exist many works in the literature dealing with simulations, however, a proper study requires a reliable and efficient testbed. Currently, there are several Zigbee compliant testbeds. SmartSantander [7] is an experimental test facility for the research and experimen-tation of architectures, enabling technologies, services and applications for the Internet of Things in the context of a city. SmartSantander has conceived a 3-tiered architecture: IoT nodes (integrated in the repeaters or stand alone devices), repeaters, communicating with IoT nodes through 802.15.4 protocol and gateways, communicating with both IoT nodes and repeaters. The TKN Wireless Indoor Sensor Network Testbed (TWIST) [8] is a multi-platform, hierarchical sensor network testbed architecture developed at the Technische Uni-versitt Berlin. A total of 204 sensor nodes are distributed in a 3D grid spanning 3 floors of an office building. Another testbed is implemented at Korea Advanced Institute of Science and Technology, using Crossbows MICAz motes which are IEEE 802.15.4 compatible, running on TinyOS.
Nevertheless, to the best of Authors’ knowledge, there are no papers focusing on comparing routing overhead generated in network simulators, as NS-2, and in real test-bed, and presenting comparison between simulations and experimental results for Zigbee-based applications.
III. THEEUWINSITE INBOLOGNA
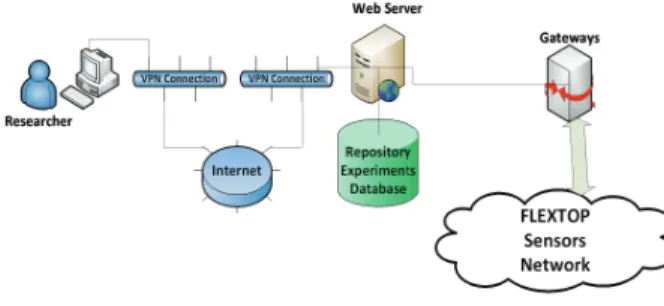
In Fig. 1, the Flextop architecture is shown. Researchers can access the lab facilities through a Virtual Private Network (VPN) client, and through a graphical user interface (GUI), they can upload their firmware and the experiment settings. The server aims at allowing the access to the lab and it is used as experiments repository database (see Fig. 1), where all data related to the experiments are stored. The server is responsible for the connection to a local gateway, able to communicate with the 802.15.4 Coordinator, sending it the firmware to be downloaded on the devices, and to store the raw experimental results, as well as the data coming from the sniffer. The sniffer is a Texas Instruments (TI) CC2531 device, listening to the channel for all the duration of the experiment, to provide researchers indication about all the data exchanged in the network. The Coordinator manages the firmware OTA download. The Coordinator and Flextop devices are TI CC2530 system on chips, having 256 KB internal flash and 256 KB external EEPROM, 8 KB of RAM, a transmit power within [0, 20] dBm and a receiver sensitivity of -85 dBm.
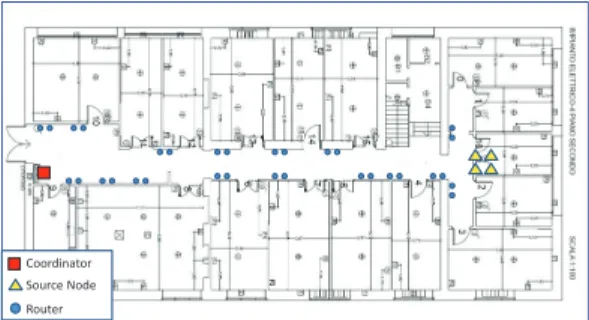
The devices are deployed according to a fixed grid of positions in a corridor of the University of Bologna (see Fig. 3). The Coordinator (the red square) is located at one end of the corridor, while the different devices are distributed on the corridor. In the first release of Flextop, considered in this paper, devices are located on the ground (i.e., not in permanent
Fig. 1. The Flextop Architecture.
positions), while in the future they will be fixed on the walls. To test different topologies, it is possible to select (through the GUI) the set of devices to be switched on and their transmit power.
IV. THEIEEE 802.15.4AND THEZIGBEEROUTING
PROTOCOL
The IEEE 802.15.4 standard defines the first two layers of the protocol hierarchy [1], while ZigBee defines the network and the application layers [2].
A. The PHY and MAC Layer
The physical layer operates in the 2.4 GHz Industrial Sci-entific and Medical (ISM) band, using a bit rate of 250 kbit/s, and deals with the transmission and reception of packets. It provides an indication of the quality of the received packets from the transceiver in terms of power of the received signal, called link quality indicator (LQI). Depending on the designer, the LQI could be a measure of the strength and/or the quality with which a packet is received.
The MAC layer manages the access to the physical channel. The non-beacon-enable mode is considered in this paper, according to which nodes use a Carrier Sense Multiple Access with Collision Avoidance (CSMA/CA) algorithm to access the channel. We refer to the standard for more details about the protocol [1], here we just underline that MAC losses may occur, due to: i) hidden terminal node problem (nodes which cannot ”hear” one another); ii) nodes find the channel busy for
more than N Bmax(being N Bmaxa MAC parameter set to 4)
subsequent times for the transmission of the same packet; iii) the maximum number of retransmissions allowed is reached.
B. The Zigbee Network layer
The default routing algorithm of ZigBee is based on Ad hoc On-Demand Distance Vector (AODV), which is a pure on-demand route acquisition algorithm. According to Zigbee,
a link, li, connecting a pair of nodes, is characterized by
link cost, given by [2]: Cli = min{7, floor(P
−4
li )}, where
f loor(.) is a function mapping the real number to the largest
previous integer, and Pli is the probability of packet delivery
on the link li. According to ZigBee specifications, Pli may
be computed through the LQI measure, however no specific methods are defined in the standard for the computation of this metric and its implementation is left to the designer. In
TABLE I
LQITO LINK COST MAPPING.
LQI LINK COST
> 12 1 9-12 2 6-9 3 4-6 4 2-4 5 1-2 6 0 7
the case of the TI CC2530 platform, the relationship between the LQI and the cost implemented in the software is provided in Table I The protocol selects the path, P , connecting a pair of nodes, characterized by the smallest total cost, C(P ), given
by: C(P ) = ∑Li=1Cli, being L the number of hops in the
path. In case there exists more than one path connecting the same pair of nodes and having the same total cost, the path characterized by the lowest value of L, will be selected.
D A T A TIMEOUT D A T A D A T A D A T A D A T A D A T A D A T A D A T A RREQ/RREP TX RREQ/RREP TX
Fig. 2. Route discovery and data transmission phases for a generic source. The control packets exchanged in Zigbee networks to find the optimum path are described in the following. The source node broadcasts a route request (RREQ) packet to its neighbors and then intermediate nodes receiving the RREQ rebroadcast it to their neighbors until the RREQ reaches the destination node. During the process of rebroadcasting the RREQ, intermediate nodes record in their route discovery tables the address of the sender from which the first copy of the broadcast packet was received, and the corresponding link cost. The comparison among different path costs related to the same RREQ allows choosing the best path. Once the destination node receives the RREQ, it responds by unicasting a route reply (RREP) packet back to its neighbor from which it received the RREQ. As the RREP is routed back along the reverse path, nodes along this path set up forward route entries in their routing tables which point to the node from which the RREP came. These forward route entries indicate that the link between the node and the destination is established. Finally, when the RREP reaches the originator, it can send data packets.
In order to reduce the overhead generated in the network, therefore collisions, in our implementation (both in Flextop and NS-2) we try to separate the route discovery phase (that is RREQ/RREP transmissions) from the data transmission phase, as shown in Fig. 2. Each source sends a RREQ and waits an interval of time, called timeout before starting the transmission of a burst of data packets. Time between two subsequent RREQ is denoted as round. Depending on the delay with
which the RREQ are propagated in the network and RREP is received by the source, the two phases could be perfectly separated or not.
V. SIMULATIONS ANDTESTBEDSET-UP
The studied topology, shown in Fig. 4, is composed of 37 devices: 4 source nodes (triangles), 32 routers (circles) and one receiver (square), that is the Zigbee Coordinator. The described topology (Fig.4) has been simulated in NS-2 and reproduced on our testbed according to scenario that can be seen in Fig.3.
Coordinator
Source Node
Router
Fig. 3. The Flextop network: nodes distribution
2 4 6 8 10 12 .……….. 34 36 1 3 5 7 9 11 ……….…….. 31 33 35 60cm 3m 60cm 30cm Sources Routers Coordinator
Fig. 4. Considered scenario.
In this first set-up of the EuWIn Flextop testbed, devices were not fixed on the walls, as they will be in the next release of the testbed, but deployed on the ground, according to a fixed grid of positions in the corridor of the laboratory at the University of Bologna (see Figure 5). The Coordinator (the red square) was located at one end of the corridor, while different devices were distributed on the floor (see Fig. 5). The software implemented at the devices is the default Texas Instruments Zigbee implementation. Once the experiments were performed, data collected by the sniffer as well as from the Coordinator through the serial interface were processed. Both in the simulator and in the real network nodes were running the following application: the sources periodically transmit data packets toward the Coordinator, passing through the routers, which just act as relays. In both tools, the transmit power was set equal to 0 dBm. To achieve the separation between route discovery and data transmission phase, the timeout that can be seen in Fig. 2 was set to 30s. As for the packet sizes, both in NS-2 and Flextop we set: the size of data packets at the PHY layer 46 bytes (6 bytes of PHY header, 11 bytes of MAC header, 17 bytes of network and application
Fig. 5. The EuWIn testbed deployment.
headers, and 12 bytes of data). The size of ACK packets is 11 bytes. RREQ and RREP packets have a size of 37 and 63 bytes respectively. The number of retransmissions for data packets as well as for RREQ was set to 3. Other MAC parameters are set to the default values [1]. During both, experiments and simulations, 100 different topologies have been generated and 50 packets per source have been transmitted. Several data rates were considered. Numerical results achieved are averaged over the 5.000 overall transmissions.
The NS-2 simulator developed at LIMOS implements the IEEE 802.15.4 physical and MAC layers, and uses the ZigBee AODV-based routing protocol at the network layer. In order to reproduce as much as possible the real environment in the NS-2 simulator, we performed some preliminary point-to-point tests, to check the level of connectivity among devices. Due to some hardware and software constraints (e.g., not being able to decrease the transmit power under a certain threshold), we deduced that all devices in the real network were able to ”hear” each other. In order to force sources to reach the Coordinator through multi-hopping, we set the relationship between the LQI and the costs as shown in Table I, such that on average each source implements at minimum two hops to reach the Coordinator. Moreover, in order to implement the same link costs in NS-2, some preliminary measurements have been performed on Flextop, to provide results as input to the simulator. The link costs matrix, C, whose elements represent the cost of a link among each couple of nodes in the network, has been derived empirically as follows. Devices one by one transmit 100 packets in broadcast, while other devices record the average LQI value received from each device. Values from this matrix are then mapped to the corresponding link cost values according to the lookup table provided in a software used in our testbed and reported in Table I. Finally, C has been provided as an input to the simulator.
In the simulator the following packet capture model is implemented: a packet is correctly received if the received
power is larger than the receiver sensitivity, PRmin and if the
signal to interference ratio (SIR), that is the ratio between the useful received power and the sum of the interfering powers, is larger or equal to the capture threshold, γ. In the simulator, we
assume that the loss in dB between a transmitter and a receiver
at distance d is given by: L[dB] = k0+ k1ln d, where k0 is a
function of the propagation coefficient and k1 = 10β/ ln 10,
where β is a constant. The received power in logarithmic scale,
denoted as PR, is given as PR[dBm] = PT[dBm]− L[dB],
where PT is the transmitted power. In order to have
connec-tivity among all the nodes in the network, we set: k0= 40 dB,
β = 3, γ = 1.3 dB (according to measurements reported in
[12]), N0 = 5· 10−18 W/Hz (to obtain a receiver sensitivity,
PRmin, equal to -85 dBm). More details on the simulator
implementation can be found in [4]. VI. NUMERICAL RESULTS
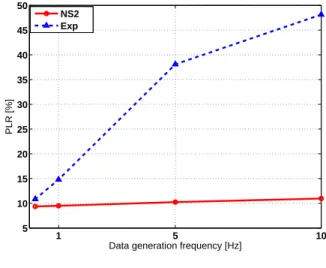
Results obtained through the simulation and experiment on a testbed were evaluated in terms of: i) packet loss rate (PLR): the percentage of source data packets lost; ii) overhead generated in the network, that is the average number of RREQ and RREP packets generated per round. Figure 6 shows the PLR for different data generation rates, achieved with Flextop and with the NS-2 simulations. As can be seen, the PLR obtained with the real network is larger with respect to the simulated, and the latter is particularly true for high data generation rates. This is mainly due to the overhead generated in the real network, which is much larger with respect to
the one simulated in NS-2. The latter is shown in Fig. 7
1 5 10 5 10 15 20 25 30 35 40 45 50
Data generation frequency [Hz]
PLR [%]
NS2 Exp
Fig. 6. Packet Loss Rate.
(see below). The reason why the difference between the two curves changes with the data generation rate is mainly because, depending on the data generation rate, we could be able to properly distinguish in the real testbed the route discovery phase from the data transmission phase, while in the NS-2 these two phases are always well separated. In particular, in Flextop when the data generation rate is large, the two phases are not separated and this generates many losses due to collisions. Due to the latter, in the simulator the PLR starts increasing for a data generation rate larger that 20 packets per second, while in Flextop it is always increasing. It can be concluded that the simulator can be considered as reliable
only when we deal with specific range of data rates, as both curves converge to the same value.
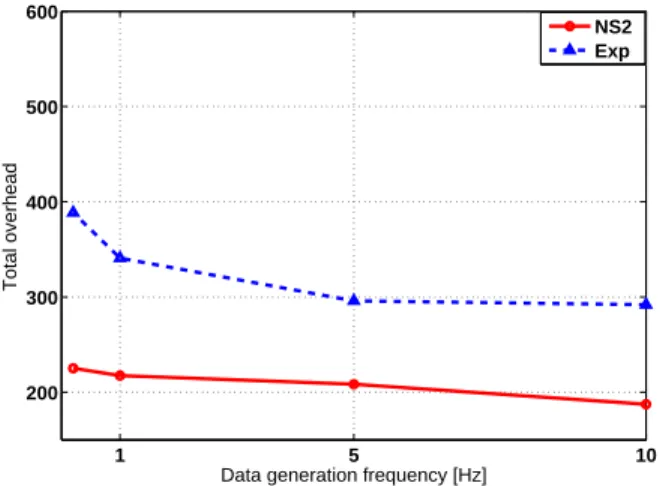
Figure 7 represents the total overhead generated by the net-work layer and averaged over the number of rounds for both simulations and experiments. As in the case of PLR, simulation results are quite stable, while experimental results vary with the data generation rate. It can be seen that the
1 5 10 200 300 400 500 600
Data generation frequency [Hz]
Total overhead
NS2 Exp
Fig. 7. Overhead generated in the network.
overhead increases as the data generation rate decreases. At the same time, it has been shown that PLR decreases with the data generation rate decrease. This is due to the fact that in the case of higher data generation rates, sources have more difficulties with the path discovery, that implies that they should transmit more RREQs, attempting to find the path. But these control packets are not forwarded by relay nodes, since they are more busy with forwarding data packets already existing in the network. On the other hand, when the data generation rate is lower, sources generate less overhead, but at that point all relay nodes are able to ”hear” and retransmit those packets. Therefore, the total overhead in the network becomes larger. Apart from the differences underline above, also the following issues should be introduced, to understand the differences among the results: i) the connectivity among devices, not exactly reproduced in the simulator, due to the impossibility to have devices on the walls, therefore in fixed positions in all the experiments; ii) the ZigbeePro software used in Flextop, meaning that link costs are updated depending on the LQI with which Link Status packets are received. In fact, while in NS-2 Link Status packets are not transmitted, during the experiments these packets are exchanged, providing the link costs between the transmitter node and all its known neighbors. The existence of these packets affects the path selection in the network.
VII. CONCLUSIONS AND FUTURE WORK
In this paper we presented first results achieved through EuWIn testbed aiming at presenting one of the objectives of EuWIn, that is comparison with the results achieved through
simulations and determining conditions under which the sim-ulator can be considered reliable for a specific scenario. The considered scenario has been reproduced both in the simulator and in the testbed. It has been shown that for a specific range of data generation rates simulator can provide proper insight in reality while some issues arise when it comes to larger data rates. We also demonstrated that although simulator has many advantages, testbed utilization may provide very useful information and give hints on potential issues in the real deployment. In this first release of the Flextop testbed, en-vironment was not perfectly characterized. In order to achieve this, in the future releases before each experiment apart from Link Cost matrix the channel gains matrix G will be evaluated as well. This matrix will contain as elements the channel gains between each pair of devices in the network. This matrix could be used by researchers to properly set the experiment settings, or for comparison with simulations.
A. Acknowlegments
This work was supported by the European Commission in the framework of the FP7 Network of Excellence in Wireless COMmunications NEWCOM♯ (Grant agreement no. 318306).
REFERENCES
[1] IEEE Computer Society, “IEEE Std.802.15.4 2006: Part 15.4: Wireless Medium Access Control (MAC) and Physical Layer (PHY) Specifications for Low-Rate Wireless Personal Area Networks (LR-WPANs)”. [2] ZigBee Alliance, “ZigBee Specification”, January 17, 2008
http://www.zigbee.org/
[3] C. Gezer, C. Buratti, R. Verdone, “Capture Effect in IEEE 802.15.4 Networks: Modelling and Experimentation”, Proc. of IEEE International Symposium on Wireless Pervasive Computing ISWPC 2010, May 5, 2010, Modena, Italy.
[4] El Rachkidy, N. and Guitton, A. and Misson, M., “Pivot routing improves wireless sensor networks performance”, JNW (Journal of Networks) 2012. [5] Hellbruck, H. ; Lubeck Univ. of Appl. Sci., Lubeck, Germany ; Pagel, M. ; Kroller, A. ; Bimschas, D., ”Using and Operating Wireless Sensor Network Testbeds with WISEBED”, Ad Hoc Networking Workshop (Med-Hoc-Net), 2011 The 10th IFIP Annual Mediterranean.
[6] Kefeng Tan ; Dept. of Comput. Sci., Univ. of California, Davis, CA, USA ; Wu, D. ; An Chan ; Mohapatra, P., ”Comparing simulation tools and experimental testbeds for wireless mesh networks”, World of Wireless Mobile and Multimedia Networks (WoWMoM), 2010.
[7] http://www.smartsantander.eu/
[8] V.Handziski, A. Kopke, A. Willig, A. Wolisz, ”TWIST: A Scalable and Recon?gurable Testbed for Wireless Indoor Experiments with Sensor Networks”, In Proceedings of 2nd International Workshop on Multi-hop Ad Hoc Networks: from Theory to Reality”, 2006.
[9] S.L. Shrestha, J. Lee, A. Lee, K. Lee, J. Lee and S. Chong,”Testbeds and Research Infrastructure for the Development of Networks and Commu-nities, 2007. TridentCom 2007”.
[10] C. Houaidia, A. V. D. Bossche, H. Idoudi, T. Val , L. A. Saidane,”Experimental Performance Analysis of Routing Metrics in Wire-less Mesh Networks”, Proceedings of the 9th International WireWire-less Communications and Mobile Computing Conference, 2013.
[11] C. Muhlberger ”Analyzing a Self-Organizing Multi-Hop Protocol:Ease of Simulations and Need for Real-World Tests”, Proceedings of the 9th International Wireless Communications and Mobile Computing Confer-ence, 2013.
[12] C. Gezer, C. Buratti, R. Verdone, “Capture Effect in IEEE 802.15.4 Networks: Modelling and Experimentation”, Proc. of IEEE International Symposium on Wireless Pervasive Computing ISWPC 2010, May 5, 2010, Modena, Italy.
![[PDF] Formation sur l’Utilisation du logiciel Audacity | Cours informatique](data:image/gif;base64,R0lGODlhAQABAIAAAP///wAAACH5BAEAAAAALAAAAAABAAEAAAICRAEAOw==)