An LCD tachistoscope with submillisecond precision
Holger F. Sperdin&Marc Repnow&Michael H. Herzog&Theodor Landis
Published online: 7 February 2013 # Psychonomic Society, Inc. 2013
Abstract Tachistoscopes allow brief visual stimulation delivery, which is crucial for experiments in which sub-liminal presentation is required. Up to now, tachistoscopes have had shortcomings with respect to timing accuracy, reliability, and flexibility of use. Here, we present a new and inexpensive two-channel tachistoscope that allows for exposure durations in the submillisecond range with an extremely high timing accuracy. The tachistoscope con-sists of two standard liquid-crystal display (LCD) moni-tors of the light-emitting diode (LED) backlight type, a semipermeable mirror, a mounting rack, and an experi-mental personal computer (PC). The monitors have been modified to provide external access to the LED back-lights, which are controlled by the PC via the standard parallel port. Photodiode measurements confirmed reliable operation of the tachistoscope and revealed switching times of 3μs. Our method may also be of great advantage in single-monitor setups, in which it allows for manipu-lating the stimulus timing with submillisecond precision in many experimental situations. Where this is not applica-ble, the monitor can be operated in standard mode by disabling the external backlight control instantaneously.
Keywords Visual perception . Tachistoscope . Subliminal stimulation . LCD . LED backlight . Visual stimulation device
Traditional mechanical and electrical tachistoscopes are cum-bersome to use and have limitations primarily due to their physical components, particularly when brief exposure dura-tions are used (see, e.g., Lancaster & Lomas,1977; Mollon & Polden,1978). Electrical tachistoscopes use fluorescent lamps working as shutter components to passively illuminate images consisting of handmade photo prints presented via manual slide-projection systems (e.g., Karlin, 1955; Kupperian & Golin,1951). These lamps exhibit rather slow and variable response times (up to 20 ms), creating noise and imprecise timing (e.g., Bohlander, 1979; Glaser,1988; Merikle,1980; Mollon & Polden, 1978). Tachistoscopes using mechanical shutters (e.g., Deutsch, 1960; Lancaster, Sayer, Scott, & Sutcliffe,1971) are often failure-prone, with variable asym-metries in rise and fall times of the order of several milli-seconds (e.g., Madigan & Johnson,1991; Naish,1979).
Presenting complex visual stimuli at ultrashort dura-tions—that is, within the submillisecond range—as op-posed to simple flashes of light (e.g., Efron, 1964) in a controlled and efficient manner has not been achieved yet with standard screens and projectors (Bukhari & Kurylo, 2008; Krantz, 2000; Wiens et al., 2004; Wiens & Öhman, 2005). Recently, tachistoscopes have been described that are based on data projectors and liquid-crystal (LC) shutters (Fischmeister et al.,2010) or on LC panels with light-emitting diode (LED) arrays (Thurgood, Patterson, Simpson, & Whitfield, 2010). Although these setups provide millisecond resolution, they rely heavily on expensive or custom-made components.
Here, we present a simple and inexpensive alternative for displaying images with a high presentation quality and timing, at exposure durations starting in the sub-millisecond range. Our tachistoscope is based on two liquid-crystal display (LCD) monitors of the LED back-light type, which are set around a semipermeable mirror. Both monitors are aligned so as to appear at the same position when viewed through the mirror. As compared H. F. Sperdin (*)
:
T. LandisDepartment of Fundamental Neuroscience, University Medical School of Geneva (CMU), 1 Rue Michel-Servet,
1211 Geneva, Switzerland e-mail: [email protected] M. Repnow
:
M. H. HerzogLaboratory of Psychophysics, Brain Mind Institute, École Polytechnique Fédérale de Lausanne (EPFL), Lausanne, Switzerland
to a slide projector tachistoscope with mechanical shut-ters, the LC panel plays the role of the slide, and the LED backlight the role of the shutter and the projector. While the backlight is off (shutter closed), the image can be changed on the LC panel without being visible to the observer. Once the image has been transmitted to the LC panel and the LC pixel cells have settled to a steady state, the backlight can be switched on (shutter open) to instantly make the image visible.
Method and materials
LCD monitors
We first explain the working principle of an LCD, as this information is closely related to how our tachistoscope operates. An LCD consists of a white backlight that illumi-nates, from behind, an array of LC pixel cells. These pixel cells serve as light valves whose transmission factors can be programmed individually. A colored filter is present in front of each pixel cell, only letting red, green, or blue light pass. A single image pixel is formed by three such pixels (red, green, and blue). The LC pixel cells and the colored filters are mechanically sealed and are here referred to as LC panel. The LC panel works independently of the backlight.
The backlight, which does not have a pixel structure, illuminates all of the pixels of the LC panel at once, even when a black screen is presented.1 The brightness of the backlight can be controlled by the user through the monitor settings (usually the brightness control). The monitor elec-tronics actually vary the brightness by digitally switching the backlight on and off repeatedly at a frequency of around 200 Hz. The on–off ratio determines the average brightness. This principle is called pulse width modulation (PWM) and is exactly what is used in our tachistoscope application, apart from that the frequency and on–off ratio take rather extreme values. This PWM principle is not only used with LED backlights, but also with cold cathode fluorescence lamp (CCFL) backlights. However, the switching character-istics of LEDs are what make LED backlights the technol-ogy of choice for the tachistoscope application.
In a standard LCD monitor, the pixel values in the LC panel are the only parameters that change over time and under computer control. This is a rather slow process, for two reasons. First, if a pixel cell has received a new value, it needs some time to settle to this new value. This time is characterized by the so-called reaction time. Second, the pixel array cannot be programmed at once, but is updated pixel-wise, from the top left of the screen to the bottom
right. Once a pixel has received a new value, it autonomous-ly keeps its value until the next update or refresh cycle. This update process is usually visible, at least in a physical sense, because the LC panel is illuminated by the backlight at all times. In our tachistoscope application this is different, as the backlight can be switched off during the update process and be switched on again at any time after all of the pixel cells have sufficiently settled to their new values.2
Tachistoscope
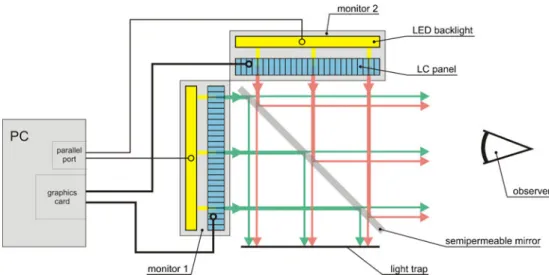
We used two LCD monitors (Samsung SyncMaster BX2240) to create the images for visual stimulation (for comments regarding monitor selection, see Appendix A). The monitors are situated around a semipermeable mirror (Glas Trösch 50:50 Luxar beam splitter), such that the observer perceives the images of both monitors superim-posed (Fig. 1). The monitors are directly connected to a graphics card with two graphics outputs. Moreover, the LCD control electronics were modified to allow an external device to take over the control of the LED backlight, in order to switch it on or off. We controlled the backlight via the parallel port of the stimulus PC.3
As compared to a traditional tachistoscope based on slide projectors, the LC panel plays the role of the slide, whereas the LED backlight plays the role of either a switchable light bulb or a mechanical shutter. As the slow changing of the slide in a traditional tachistoscope is hidden by the faster switching shutter, the relatively slow changing of the pixel states in the LC panel is hidden by the fast-switching LED backlight. Switching the LED backlight can be precisely timed and takes just a few microseconds, whereas switching traditional mechanical shutters or LC shutters takes a few milliseconds. Moreover, the switching characteristics are almost identical for both switching directions (i.e., on–off and off–on), thereby minimizing the period during which there is uncertainty about which of the images is being displayed. Having two monitors (i.e., two channels) allows for presenting a stimulus over or embedded in an arbitrary background.
The timing of a briefly flashed stimulus on a background is illustrated in Fig.2. Noteworthily, as the LED backlights of the two monitors can not only be switched in a comple-mentary manner, but also on or off for both monitors, other stimulus sequences are possible as well. For example, pre-senting a stimulus and a mask over a black background is possible, with hardly any limitations regarding the timing.
1
This is not true when special techniques are applied, including dynamic contrast, flashed backlight, scanning backlight, and so forth.
2This description of LCD monitors refers to standard consumer
prod-ucts and cannot be accurate for all different types and variations of LCD monitors.
3
We used MATLAB (The MathWorks, Natick, MA) with the Psychophysics Toolbox extensions (Brainard,1997) to program the device.
Fig. 1 Each monitor has a light-emitting diode (LED) backlight (yel-low), which can be instantly switched on or off for the complete screen. The light is modulated by the liquid-crystal (LC) panel (blue), which, in contrast to the backlight, has a pixel structure and reacts rather slowly when the pixel values are changed. The image is only visible when the backlight is switched on, because the single-pixel cells in the LC panel work like programmable light valves that just modulate the
light coming from the backlight but are not light sources themselves. The light output of each monitor (illustrated as green beams for Monitor 1 and red beams for Monitor 2) is split by a 50:50 semiper-meable mirror. One output path of the semipersemiper-meable mirror is absorbed by a light trap (e.g., black cardboard), while the other can be observed. For the observer, Monitor 2 appears to be at exactly the same position as Monitor 1
Fig. 2 Timing example for the control signals and the respective light outputs of the two-channel tachistoscope for a briefly flashed stimulus. The state of the LC panel (shown in blue) is controlled by the graphics card, and each pixel has an individual color and luminance. The image is only visible while the LED backlight (shown in yellow) is switched on. The light outputs (shown in green for Monitor 1 and in red for Monitor 2) are combined by the semipermeable mirror and form the output seen by the observer (signal in the middle of the figure). The first image switch occurs for Monitor 1 while the LED backlight is on
(with the new image marked “b” for background), resulting in the normal LCD behavior, with a rather slow transition from the previous image to the new one. Then the image for Monitor 2 is changed (“F” for foreground), but this transition is not visible because the LED backlight is off. When everything has settled, the backlights of both monitors are switched synchronously for a short period of time (pulse), causing a switch of the visible image in the output, with transition times being determined solely by the switching times of the LEDs— that is, basically instantly
LED backlight control
Each of the two monitors needed to be internally modified in order to permit control of the LED backlight by an external source. In the simplest case, this is a matter of identifying the signal line carrying the PWM signal to the LED driver, disrupting it from the internal source, and making it available to an external source. We added an optional small circuit, which served two purposes. First, it performed a voltage level translation from 3.3 V, at the computer’s parallel port, to 5 V, used in the monitor.4 Second, the circuit allowed for switching the monitor be-tween external backlight control—that is, tachistoscope mode—and internal standard PWM mode (Fig.3).
Program timing
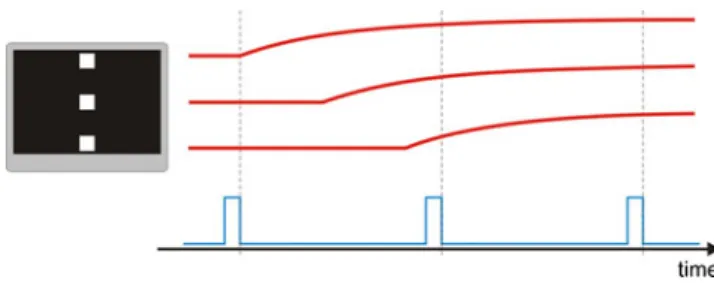
In a typical tachistoscope application, the computer program updates the image while the backlight of the monitor is switched off. The updating time of the image depends on several factors, such as the graphics programming mode (e.g., single vs. double buffered) and the image data pro-cessing within the monitor. Most importantly, the image data is transmitted in a pixel-sequential manner, not only when the data is transmitted to the monitor, but also when the data is transmitted within the monitor to the LC panel. Hence, pixels at the top of the screen are updated first, whereas pixels at the bottom are updated last, almost one refresh cycle later (Fig. 4). Finally, once an LC pixel has been updated to a new value, time is needed for the pixel to settle to this new value. The amount of time required depends on the difference between the old and new pixel values, the monitor’s contrast setting (see also LCD Reaction Time, in the Measurements section below), and the acceptable pixel luminance error.
Here is an example of typical program timing. After the value of a particular pixel P has been altered by the program via the graphics command, it takes one refresh cycle, at maximum, until the new pixel value is processed by the output stage of the graphics card and transmitted to the monitor (16.7 ms, assuming a monitor refresh frequency of 60 Hz). If the monitor does not perform any time-consuming image data processing, the corresponding LC pixel P will be updated at the same time that the value for pixel P arrives at the monitor. Assuming that the LC pixel maximally needs 50 ms to settle to the new value within an acceptable error range, the program must not switch on the LED backlight earlier than 16.7 + 50 ms≈ 67 ms after having issued the last graphics command. Otherwise, the luminance of the pre-sented pixels might be inaccurate.
Measurements
In this section, we present measurements acquired with a photodiode (Thorlabs PDA36A-EC), which was connected to a PC oscilloscope (Pico Technology PicoScope4224). When it was needed, the control signal for the LED back-light was connected to the oscilloscope as well. The ampli-fier of the photodiode was set to a gain of 30 dB, which provided a high enough bandwidth (785 kHz) to accurately capture the steep slopes of the luminance signal. The pho-todiode was equipped with a lens (Pentax 50mm-F1.4) and a lens spacer, which allowed for measuring a field of approx-imately 4 × 4 cm at a distance of 70 cm. The luminance was calibrated using a luminance meter (Minolta LS100).
LCD reaction time In order to quantify the LCD reaction time, we measured luminance curves while the screen was changed either between black and white or between two gray pixel values. Additionally, measurements were taken at two different monitor contrast settings. For the evaluated
4
Some parallel-port implementations work with a logic high level of 3.3 V, at least for the data lines. Others work with 5 V.
Fig. 3 Multiplexer circuit that allows selecting between the internal PWM and the external /LED control signal. The internal signal is selected either by setting both external control signals, MODE and /LED, to high, or by leaving the inputs unconnected, in which case the two pull-up resistors engage. In order to take over control of the LED backlight, MODE has to be set to low. Then, /LED is a low-active signal—that is, a low state switches the LED backlight on. We used the integrated HCT00 logic device (“HCT” being the device family), which hosts four NAND gates and complies with 3.3 V and 5 V logic level standards, thus providing a safe level translation
Fig. 4 Illustration of the time shift of the luminance curves (in red) as they would be virtually measured at the top, middle, and bottom of the screen over two full monitor refresh cycles after presenting an image with three patches (as depicted at the left). The vertical synchronization signal (shown at the bottom in blue) marks the start of each update cycle
monitor, the LED backlight was permanently switched on, whereas the other monitor was powered off (Fig.5).
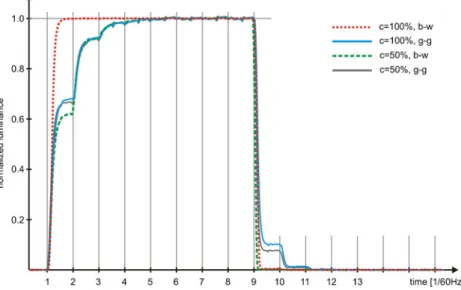
As can be seen in Fig.5, several refresh cycles were needed for the pixel values to settle, especially for changes from low to high values. Only in the very special case of switching to the maximum luminance was the reaction time as short as is found in the monitor’s specifications (≈ 5 ms). Otherwise— that is, as soon as the contrast setting at the monitor was decreased or a gray-to-gray switch took place—the reaction time increased dramatically; this is the usual case, as the luminance will normally be adjusted by the user during the monitor calibration procedure, either by lowering the contrast setting or by limiting the range of pixel values used in the program.
The reaction times for colored stimuli are the same as for white. This is because white, like any other color that can be presented on the LCD screen, is made of a combination of the three primary colors (i.e., red, green, and blue) created by the colored filters in front of the switching LC pixel cells. Therefore, if white has settled, so have the primary colors.
LED switching characteristics In order to measure the switching characteristics of the tachistoscope in terms of luminance output, a white image was presented on each monitor and calibrated to 100 cd/m2. Ideally, it should not make any difference, at least with respect to luminance, whether the backlight is on for Monitor 1 while being off for Monitor 2, or the other way around. That is, the output should always be at 100 cd/m2, especially when switching between the backlights. We measured the luminance curves
while flashing the backlight of Monitor 1 for 500μs. During this flash, the backlight of Monitor 2 was in turn switched off. Control signals for the two monitors were generated by the same parallel port, which allowed for switching both signals in perfect synchrony. Besides measuring the joint luminance output of both monitors, we also measured the luminance contribution of each monitor separately by sim-ply powering off the other monitor (Fig.6).
As can be seen in Fig. 6, we recorded short pulses of excess light when switching the backlights (see bottom curve). Ideally, this curve would be completely flat. However, small asymmetries in the switching delays cause residual artifacts to show up as glitch pulses. Whether these glitches are tolerable depends on the application at hand and the stimulus durations being used. A compensation circuit can be added to the LED control, which greatly reduces the glitch pulses (see Fig.7).
As the delay and duration of switching the backlight were of interest, we analyzed the luminance curves that were recorded separately for each monitor. The delay in switching the backlight was defined as the time between the control signal crossing the 50 % threshold and the luminance output changing by 10 % of the final luminance step (i.e., 10 cd/m2 for a target luminance of 100 cd/m2). We chose a 10 % threshold instead of a 50 % threshold to minimize contamina-tion of the delay measure by the rise or fall time of the signal. The rise and fall times were defined by the 10 % and 90 % thresholds (shown as horizontal green dashed lines in Fig.6). Table1lists the average delays and rise and fall times, based on ten measurements. As can be seen, the differences in timing
Fig. 5 Normalized luminance curves of a black–white (0 %–100 %) and gray–gray (25 %–75 %) counterphase flicker at different monitor contrast settings (100 % and 50 %). Each phase of the flicker lasted for eight cycles at a 60 Hz refresh rate. Reaction times are only short if the LC cell has to be driven either to“fully closed” or to “fully open.” Note that at a contrast setting of 50 %, the LC cell is never driven“fully
open,” even if the programmed pixel value is 100 %. On the other hand, a pixel value of 0 % is always mapped to a“fully closed” LC cell, irrespective of the contrast setting, which results in a correspond-ingly quick switch-off time. The curves show averages of five mea-surement repetitions
between the two monitors are negligible and well within the expected range of product variability. The within-monitor comparison reveals very similar rise and fall times (≈ 3μs); however, the delay for switching off the backlight is about 10μs longer than that for switching it on (e.g., 4.5 vs. 14.4μs for Monitor 1). This becomes relevant for the compensation circuit described in the next section.
Theoretically, such low timing values suggest stimulus durations potentially as short as 20μs and stimulus frequen-cies of 25 kHz (assuming an on–off ratio of 1). However, although we think that such extreme values can be safely used, we did not test whether this would affect the LEDs and the LED driver. Thus, strictly speaking, only frequencies smaller than the standard PWM frequency, which is around 200 Hz, can be considered safe.
Compensation circuit We measured a longer delay when switching off the backlight as compared to switching it on. This means that stimulus durations were longer than programmed and that a new image (on one monitor) would become visible more quickly than the old image (on the other monitor) would become invisible. However, the
difference in the delays was just 10μs (Table 1), which, if not tolerable or accounted for otherwise, can easily be compensated for by delaying the LED control signal when the backlight is switched on, but not when it is switched off. To this end, the LED control signal was fed through a small and passive analog compensation circuit (Fig.7). This cir-cuit decreased the slope just of the falling edge of the signal, and thus increased the time needed for the signal to reach the threshold of digital input at the monitor.
As can be seen in the lower curve of Fig.8, this compen-sation circuit makes the glitch pulses disappear almost com-pletely when properly adjusted. However, looking at the joint luminance output for the special case of a white-on-white flash is somewhat misleading, as it hides the rise and fall times of the individual luminance curves; these times are not affect-ed by the compensation circuit, in either a positive or a negative sense. This is due to the digital signal processing at the LED driver input, for which the steepness of the slope of the input signal is irrelevant. Only the time at which the input crosses the threshold matters. Table2lists the timing values based on ten measurements with the compensation circuit in place. As can be seen, in comparison to the values measured Fig. 6 Control signals (blue)
and luminance curves (red), as measured while switching the backlights of Monitors 1 and 2 in a complementary fashion; that is, while the backlight of Monitor 1 was switched on for 500μs, the backlight of Monitor 2 was switched off for 500μs. The curves for“Monitor 1” and “Monitor 2” show the light output of each monitor separately; the respective other monitor was powered off during these measurements. On each monitor, a white image calibrated to 100 cd/m2was
presented. The dashed horizontal lines indicate changes of 0 %, 10 %, 90 %, and 100 % of the complete luminance step, which have been used for the quantitative analysis of the switch timing. The curve at the bottom shows the luminance output when both monitors were powered on
without the compensation circuit (Table 1), only the mean values for the delays differ, whereas rise and fall times remain unchanged.
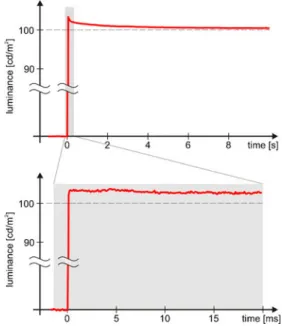
Luminance stability In a tachistoscope application, the back-light of one monitor is often kept switched on most of the time, whereas the backlight of the other monitor is just flashed briefly from time to time, meaning that the LED and drivers for both monitors operate at different temperatures, possibly causing significant differences in the color and luminance outputs. We measured the luminance output of the LED backlight after a 2-min cool-off phase (Fig.9). When a cold LED is switched on, it is about 4 % brighter than after warm-ing up. Where necessary, this can be taken into account when calibrating the monitors or by using the monitors along with their backlights in a more balanced way.
In order to evaluate the predictability and stability of the stimulus luminance under more realistic experimental condi-tions, we measured the relative error in luminous stimulus energy for 20 different stimulus durations between 200μs and 20 ms. The interstimulus intervals were chosen randomly on a logarithmic time scale, between 500 ms and 5 s. For each stimulus presentation, we recorded the LED control signal and the luminance signal, computed the integral of the luminance signal, divided this integral by the expected stimulus energy, and subtracted 1, providing us with the relative error in stim-ulus energy. We preferred to base the error measure on energy rather than on luminance, because at the short presentation times used here, the visual system is more sensitive to the stimulus energy than to a luminance modulation.
The expected stimulus energy was calculated as the stimu-lus duration multiplied by the steady-state luminance, where the steady-state luminance was measured after an LED warm-up phase of 15 s. In our setwarm-up, we used a standard PC with a parallel port for generating the LED control signal, which, Fig. 7 This circuit allows compensation for the asymmetries in the
LED backlight on–off switching delays. The adjustable resistor (R) and the capacitor (C) form a simple RC low-pass filter that decreases the slope of the signal. This filter, however, is only active when the signal changes from high to low; in the opposite direction (i.e., from low to high), the diode (D) basically shorts out the resistor (i.e., R≈ 0), which annuls the filter. Increasing the fall time of the negative signal edge increases the switching delay, as it takes longer for the signal to reach the threshold of the digital LED control input. We chose R = 5 kΩ, C = 10 nF, and the Schottky diode BAT42. If a high-active signal is used (i.e., a high level switches on the LED backlight), the polarity of the diode must be reversed
Table 1 Means and standard deviations of the backlight switching times (in microseconds) as measured from ten luminance curves for each monitor
Backlight Switched On Backlight Switched Off Delay Rise Time Delay Fall Time Monitor 1 M 4.5 2.5 14.4 2.8 SD 0.024 0.123 0.068 0.352 Monitor 2 M 4.6 2.9 14.2 2.7 SD 0.024 0.266 0.015 0.189
The rise and fall times are defined by 10 % and 90 % luminance changes, respectively, where 100 % is the full nominal luminance change. Delays are measured between the LED control signal (50 % signal change at the parallel port output) and a 10 % luminance change
Fig. 8 Luminance curves when flashing a white image on Monitor 1 for 500μs while switching off the white image on Monitor 2 in a comple-mentary fashion. The curve at the top is a close-up of the bottom curve in Fig.6. The two peaks are artifacts caused by asymmetries in the switching delays. The luminance curve at the bottom was measured under the very same conditions, but with the control signal looped through the compen-sation circuit shown in Fig.7(one per monitor)
Table 2 Means and standard deviations of the backlight switching times (in microseconds) as measured from ten luminance curves for each monitor, with the compensation circuit in place
Backlight Switched On Backlight Switched Off Delay Rise Time Delay Fall Time Monitor 1 M 15.6 2.6 14.0 2.8 SD 0.037 0.162 0.043 0.183 Monitor 2 M 15.0 2.8 13.5 2.7 SD 0.026 0.253 0.028 0.243
however, was only accurate to a few microseconds. Therefore, we used the measured width of the LED control signal pulse as the stimulus duration rather than the programmed value when calculating the expected stimulus energy. Moreover, the com-pensation circuit described earlier (see Fig. 7) was in place during the measurements, which makes a difference especially for very short presentation times. For example, if a programmed 200μs stimulus turns out to be a mere 10μs longer because of the differences in the switching delays (see Table1), this would result in a systematic additional error of 10/200 = 5 %.
Measurements were repeated in a randomized fashion over 18 min, resulting in about 30 repetitions per tested duration value. Figure10shows the averages that were calculated, while pooling data over the randomly chosen interstimulus intervals. The errors shown in Fig.10are all positive: That is, the stimulus energies were systematically higher than the energies
calculated from the respective stimulus duration and the steady-state luminance. This was to be expected, given that the luminous output was found to be higher for cold LEDs (see Fig.9) and that the LEDs must have been rather cold also during the pulsed stimulus measurements, as they were switched on only once in a while and only for very brief periods of time. The variability of the measured errors—that is, the repeatability error—was nearly independent of the stimulus duration and, overall, very small (SDavg= 0.2 %).
Discussion
Tachistoscopes have been widely used in vision research for experiments necessitating extremely brief visual stimulus presentations. Despite technological improvements made over the years, the available tachistoscopes remain expen-sive and depend strongly on customized components. Yet exposure times are still limited to the millisecond range, and timing accuracies are comparably low.
Here we have presented an inexpensive two-channel ta-chistoscope offering exposure durations well below one mil-lisecond at a high precision of timing. We measured rise and fall times of the luminance output of about 3μs, which allows for extremely short exposure durations. Such short rise and fall times greatly reduce timing uncertainties, not only while switching between the two monitors, but also with respect to the onset and duration of the stimuli. In our application, the precision of stimulus timing was only limited by the PC that controlled the tachistoscope. Despite the short rise and fall times, we found asymmetries in the switching delays of about 10μs. We showed that these asymmetries, which cause minor switching artifacts, can be minimized by adding a simple compensation circuit to the LED control. Finally, we found the luminance of a cold LED backlight to be about 4 % higher than after it warmed up. This bias could be accounted for Fig. 9 Luminance output of the LED backlight at different time scales
after a 2-min cool-off period. The light output was calibrated to be 100 cd/m2after a warm-up phase of several minutes
Fig. 10 Relative errors in luminous stimulus energy over the stimulus duration. Measurements have been randomized, and each data point represents about 30 measurements for one stimulus duration, which have been averaged irrespective of different interstimulus intervals. The bars indicate the
when calibrating the monitor or by using the two monitors in a way that avoids cooling off the LED backlights. More impor-tantly, we found the repeatability error regarding the stimulus energy to be very low across different stimulus durations (SDavg= 0.2 %).
Other tachistoscopes adopting LCD technology have been proposed recently. Fischmeister et al. (2010) described a three-channel setup based on LCD projectors and LC shutters. LC shutters rely on the same technology as LCDs and have, at least in principle, the same shortcomings. However, the physical dimensions and the sheer number of pixels in an LCD monitor make it much more difficult to achieve fast reaction times in an LCD as compared to a single and comparatively large LC shutter. Nevertheless, the authors measured rise and fall times of approximately 1 ms and 0.25 ms (10 %–90 %), limiting exposure durations to about 2 ms, an order of magnitude longer than is possible with our approach. Moreover, as these LC shutters do not fully block the light when closed, two shutters per projector had to be mounted serially, further increasing the complex-ity of the setup and adding to the bill of materials. The setup showed a fairly high variance in output luminance, even when exposure time was fixed—which, however, could be attributed to peculiarities of the projector light sources, and might be resolved by using different projectors. Proper selection of the imaging device is also an issue with our setup, because LED backlights might exhibit irregular switching characteristics when they are switched off for extended periods of time (seeAppendix A).
Another problem arises from semipermeable mirrors, as they cause color shifts that depend on the angle of light passing through or being reflected by the mirror (seeAppendix B). Projector setups are an advantage in this respect, because they allow for the use of smaller mirrors with correspondingly higher optical quality. Moreover, due to the large throw ratio (i.e., the ratio between projection distance and screen width), the range of angles at which the light passes through or is reflected by the mirror is considerably smaller than in our compact LCD monitor setup. Moreover, these angles do not depend on viewing position, because the projection screen scatters the light. Other advantages of projector setups include a potentially high luminance output and a fairly free choice of screen size. Lately, projectors using LEDs as light sources have become available and provide sufficient luminous output pow-er for the screen sizes typically used in visual exppow-eriments, especially in functional magnetic resonance imaging (fMRI) environments, where projector setups are commonly used for visual stimulus presentation. Such projectors would be partic-ularly suited for modifications of the LED electronics and to be used in a tachistoscopic setup, much as we did with our standard LCD monitors.
Thurgood et al. (2010) described a one-channel tachisto-scope consisting of an LC panel illuminated by a custom-made
LED array, allowing for exposure durations of 1 ms and above. Although the net output luminance was not reported, it can be assumed to be much higher than the luminance output of the off-the-shelf LCD monitors that we used. However, the advan-tage of higher luminance output comes at the cost of having to build an LED backlight and properly integrating it with an LC panel so as to get a uniformly illuminated screen. More impor-tantly, a one-channel setup limits the scope of application, as it only allows for brief stimulus presentations over a pitch-black background or, vice versa, a pitch-black stimulus over any background. When these limitations do not play a role, our method can be used in a one-monitor setup as well, while being simpler, cheaper, and faster than the setup described by Thurgood et al. Moreover, if the suggested multiplexer circuit is installed, the monitor can be operated in the backlight switching mode or as a standard stimulus screen. Opting for a two-channel solution with a semipermeable mirror, however, adds more flexibility, as it allows for presenting stimuli over any desired background or, alternatively, presenting two inde-pendent stimuli (over a pitch-black background), as would be required for visual masking or priming experiments, for exam-ple. In two-stimulus paradigms, the high timing resolution provided by LED backlight switching is not only beneficial for defining short exposure durations, but also for having almost unlimited control over stimulus onset times.
The development of a tachistoscope is technically de-manding, and none of the available setups is perfect. Nevertheless, our approach is comparatively inexpensive, as it relies on just two standard LCD monitors, a semiper-meable mirror, a mounting rack, and a PC. Even though the monitors have to be modified, the modifications can be kept simple and do not require costly hardware. Therefore, our tachistoscope makes a good compromise between what is technically achievable and what is economically reasonable.
Author note We thank Stefan Hudson for his invaluable ideas and advice, Alexis Hervais-Adelman for comments on an earlier version of the manuscript, and Iwan Roy for assistance in the building of the tachistoscope. This study was supported by the SNF Grant No. 320030-132967.
Appendix A: Monitor selection
The Samsung SyncMaster BX2240 monitor was chosen for no particular reason, other than featuring an LED backlight. This monitor employs a TN (twisted nematic)-type LC panel, which is cheaper and supposedly has faster reaction times than other panel technologies, such as, for example, IPS (in-plane switching) or VA (vertical alignment). On the other hand, TN panels exhibit inferior color quality, not only in terms of color resolution, but also in terms of hue and saturation shifts at increasing viewing angles. The latter problem is not necessarily crucial in the tachistoscope
application, for two reasons. First, the observation distance in visual experiments is normally long, and stimuli are often smaller than the screen size would allow for, both implying sufficiently small viewing angles. Second, and more impor-tantly, the semipermeable mirror causes color distortions any-way, which will likely dominate overall color distortions.
One downside of TN panels is their low native color resolution, which usually is only 6 bits per color channel. Monitor manufacturers overcome this limitation by imple-menting spatial or spatiotemporal dithering techniques (i.e., by applying noise patterns that increase the apparent color resolution through spatial or spatiotemporal averaging). In addition, some graphics cards apply dithering, also to over-come the limited color resolution imposed by the digital transmission of video signals. Having dithering applied, especially if the details are not documented, might be pro-hibitive for visual experiments in general. In particular, temporal dithering can be ineffective, and can even create artifacts with stimuli being presented as briefly as in usual tachistoscope applications, in which the stimuli are too short to be covered by more than one dither phase. Moreover, controlling the dither phase into which the stimulus falls would be difficult, and this might cause one and the same stimulus to appear slightly differently from trial to trial. On the other hand, whether such minor differences would actu-ally be perceived given the short presentation times is questionable.
As already mentioned, LC panels differ in their reaction times. Although reaction times do not matter for very simple tachistoscope applications, in which enough time can be provided to let the LC pixel states settle before switching on the LED backlight, fast reaction times can still be of benefit when it comes to experiments requiring rapid serial visual presentation. For the same reason, high refresh rates up and beyond 100 Hz are desirable, as are provided by 3-D LCDs (shutter glasses technology). Although other panel technologies are hitting the market (with or without over-drive techniques), the fastest LCDs to date, especially 3-D LCDs, are still equipped with TN panels.
The most crucial selection criterion is whether the driver electronics of the LED backlight are suitable for the de-scribed modification. Normally, it should be easy to identify the signal line that carries the PWM signal, disrupt it, and feed it from an external signal source. Problems may be caused, however, by the extreme on–off ratios to be applied in typical tachistoscope applications. The LED driver will not necessarily tolerate receiving an off signal for an ex-tended period of time. Some drivers go into sleep mode if they are not active for longer than a mere 40 ms, and can cause severe artifacts upon wake-up that effectively com-promise tachistoscope performance. Unfortunately, there is no way of telling beforehand whether a monitor hosts such a driver, even if the particular monitor type is thought to
handle long off times well. This is not any different with the Samsung SyncMaster BX2240, which is now being manufactured with an updated internal circuit rendering it unusable for the tachistoscope setup. We also observed this LED driver problem with the 3-D monitors BenQ XL2410T and BenQ XL2420T. Recently, we tested the Fujitsu P23T-6 IPS, which also falls asleep, but does so rather slowly and exhibits a tolerable wake-up behavior. Although the timing performance of the Fujitsu P23T-6 IPS is not optimal, it offers the benefit of having an IPS-type LC panel with reasonably fast reaction time. Detailed measurements can be found athttp://display-corner.epfl.ch.
Appendix B: Practical issues
We had difficulties adjusting the positions of the two screens and the semipermeable mirror so as to perfectly align them. Keeping the positions of two of the elements fixed—for instance, the mirror and one of the screens—leaves 6 deg of freedom for the third element—for instance, the second screen—to be precisely adjusted. For applications, which would require high alignment accuracy, the mounting rack should be equipped with suitable micro adjustments.
As we mentioned in the Discussion, the semipermeable mirror can induce noticeable color shifts, not only depend-ing on whether the light is transmitted (as for one monitor) or reflected (as for the other monitor), but also depending at which angle an optical trace passes through or is reflected by the mirror. The latter issue is especially problematic, as these angles are different for different locations on the screen and also depend on the position of the observer. Moreover, the polarization of the light (i.e., the orientation of the oscilla-tion plane of the light waves) coming from the LCD panels could play a role, as the mirror might perform differently depending on light polarization. Therefore, if it is crucial for the application at hand, local—for instance, pixel-wise— color calibration will have to be applied to perfectly match the white points over all the screen locations and for both monitors.
Adjusting the maximal luminance is not difficult per se, but it must be kept in mind that the semipermeable mirror removes half of the available luminance, at least. In addi-tion, more luminance may be lost due to monitor calibration. For example, the Samsung SyncMaster BX2240 is specified to provide 250 cd/m2, which was enough to provide 100 cd/m2 per monitor in our tachistoscope setup. Although this is adequate for many psychophysical experi-ments, higher luminance values would be desirable in ta-chistoscope applications in which sufficient stimulus energy has to be provided, despite short presentation times.
Practical information can be found at http://display-corner.epfl.ch.
References
Bohlander, R. W. (1979). Luminance of tachistoscope lamps as a function of flash duration. Behavior Research Methods & Instrumentation, 11, 414–418.
Brainard, D. H. (1997). The Psychophysics Toolbox. Spatial Vision, 10, 433–436. doi:10.1163/156856897X00357
Bukhari, F., & Kurylo, D. D. (2008). Computer programming for generating visual stimuli. Behavior Research Methods, 40, 38– 45. doi:10.3758/BRM.40.1.38
Deutsch, J. A. (1960). The reflecting shutter principle and mechanical tachistoscopes. Quarterly Journal of Experimental Psychology, 12, 54–56.
Efron, R. (1964). Artificial synthesis of evoked responses to light flash. Annals of the New York Academy of Sciences, 112, 292–304. doi:10.1111/j.1749-6632.1964.tb26758.x
Fischmeister, F. P., Leodolter, U., Windischberger, C., Kasess, C. H., Schopf, V., Moser, E., et al. (2010). Multiple serial picture pre-sentation with millisecond resolution using a three-way LC-shutter-tachistoscope. Journal of Neuroscience Methods, 187, 235–242. doi:10.1016/j.jneumeth.2010.01.016
Glaser, W. R. (1988). Technical improvements to the projection tachis-toscope. Behavior Research Methods, Instruments, & Computers, 20, 491–494.
Karlin, L. (1955). The New York University tachistoscope. The American Journal of Psychology, 68, 462–466.
Krantz, J. H. (2000). Tell me, what did you see? The stimulus on com-puters. Behavior Research Methods, Instruments, & Computers, 32, 221–229.
Kupperian, J. E., Jr., & Golin, E. (1951). An electronic tachistocope. The American Journal of Psychology, 64, 274–276.
Lancaster, G. A., Sayer, I., Scott, A. E., & Sutcliffe, R. M. (1971). The development and use of mechanical tachisto-scope. European Journal of Marketing, 5, 30–35. doi:10.1108/ EUM0000000005157
Lancaster, G. A., & Lomas, R. A. (1977). Experimental error in T-scope investigations. Journal of Advertising Research, 17, 51–56. Madigan, R., & Johnson, S. (1991). Measuring projection tachisto-scope shutter characteristics. Behavior Research Methods, Instruments, & Computers, 23, 23–26.
Merikle, P. M. (1980). Selective masking and the lamp-phosphor problem. Quarterly Journal of Experimental Psychology, 32, 491–495.
Mollon, J. D., & Polden, P. G. (1978). Time constants of tachisto-scopes. Quarterly Journal of Experimental Psychology, 30, 555– 568.
Naish, P. (1979). An electromechanical optical shutter. Journal of Physics E, 12, 678–679.
Thurgood, C., Patterson, J., Simpson, D., & Whitfield, T. W. A. (2010). Development of a light-emitting diode tachistoscope. The Review of Scientific Instruments, 81, 035117. doi:10.1063/ 1.3327837
Wiens, S., Fransson, P., Dietrich, T., Lohmann, P., Ingvar, M., & Öhman, A. (2004). Keeping it short: A comparison of methods for brief picture presentation. Psychological Science, 15, 282– 285. doi:10.1111/j.0956-7976.2004.00667.x
Wiens, S., & Öhman, A. (2005). Visual masking in magnetic resonance imaging. NeuroImage, 27, 465–467. doi:10.1016/ j.neuroimage.2005.04.007