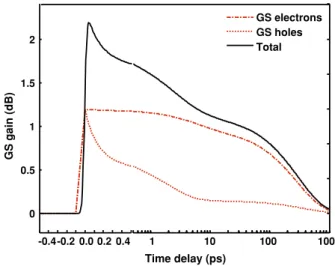
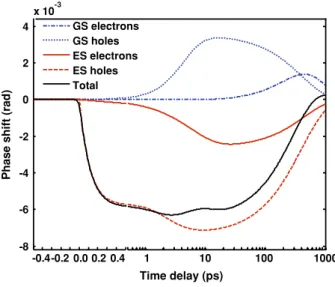
Modeling of gain and phase dynamics in quantum dot amplifiers
Texte intégral
Figure
Documents relatifs
Abstract: This work shows that p-doped quantum dot lasers grown on silicon exhibit a low linewidth enhancement factor and hence a high resistance against optical feedback which
We conclude that motional narrowing in the optical spectrum of a quantum dot broadened by spectral diffu- sion occurs in the unexpected regime of low temperature and low
Keywords: semiconductor lasers, quantum dots, optical feedback, nonlinear dynamics, relative intensity noise, spectral linewidth... Table
A critical improvement in the quantum dot LED (QLED) technology was achieved when zinc oxide nanoparticles (NPs) were first introduced as an electron transport layer (etL)
and Nakata, K., "Modelling room- temperature lasing spectra of 1.3mm self assembled InAs/GaAs quantum dot lasers : homogeneous broadening of optical gain under
EL measurements allow to study the optical power evolution of a semiconductor laser diode as a function of the electrical current density under pulsed electric excitation
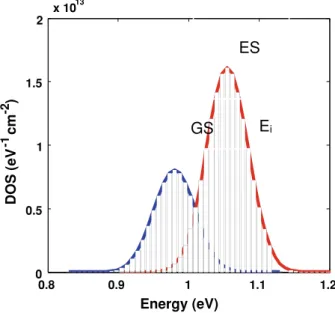
Quantum dot (QD) is a semiconductor-based compound of which the excitons are confined in the three dimensions of space, which induces a finer state density than in
We report on the robust population inversion in a single quantum dot using an optical technique that exploits rapid adiabatic passage from the ground to an excited state
