HAL Id: hal-02376060
https://hal.archives-ouvertes.fr/hal-02376060
Submitted on 25 Nov 2020
HAL is a multi-disciplinary open access
archive for the deposit and dissemination of
sci-entific research documents, whether they are
pub-lished or not. The documents may come from
teaching and research institutions in France or
abroad, or from public or private research centers.
L’archive ouverte pluridisciplinaire HAL, est
destinée au dépôt et à la diffusion de documents
scientifiques de niveau recherche, publiés ou non,
émanant des établissements d’enseignement et de
recherche français ou étrangers, des laboratoires
publics ou privés.
Distributed under a Creative Commons Attribution| 4.0 International License
Biogeochemical-Argo float data into a biogeochemical
model of the Mediterranean Sea
G. Cossarini, L. Mariotti, L. Feudale, A. Mignot, S. Salon, V. Taillandier, A.
Teruzzi, F. d’Ortenzio
To cite this version:
G. Cossarini, L. Mariotti, L. Feudale, A. Mignot, S. Salon, et al.. Towards operational 3D-Var
as-similation of chlorophyll Biogeochemical-Argo float data into a biogeochemical model of the
Mediter-ranean Sea. Ocean Modelling, Elsevier, 2019, 133, pp.112-128. �10.1016/j.ocemod.2018.11.005�.
�hal-02376060�
F. D'Ortenzio
aIstituto Nazionale di Oceanografia e di Geofisica Sperimentale (OGS), Borgo Grotta Gigante 42/c, Sgonico, TS 34010, Italy bMercator Ocean International, Ramonville-Saint-Agne 31520, France
cCNRS, Laboratoire d'Océanographie de Villefranche, LOV, Sorbonne Universités, Villefranche-sur-Mer F-06230, France
A R T I C L E I N F O Keywords: Data assimilation Biogeochemical-Argo float Biogeochemical model Chlorophyll Mediterranean Sea A B S T R A C T
The emerging availability of Biogeochemical-Argo (BGC-Argo) float data creates new opportunities to combine models and observations in investigations of the interior structures and dynamics of marine ecosystems. An existing variational data assimilation scheme (3DVarBio) has been upgraded and coupled with the Copernicus Marine Environment Monitoring Service biogeochemical model of the Mediterranean Sea to assimilate BGC-Argo chlorophyll profile observations. Our results show that the assimilation of BGC-BGC-Argo float data is feasible. Moreover, the proposed data assimilation framework provides significant corrections to the chlorophyll con-centrations and is able to consistently re-adjust the shapes of chlorophyll profiles during surface blooms oc-curring in winter vertically mixed conditions, and in the case of the summer deep chlorophyll maxima.
Sensitivity analysis and diagnostic metrics have been applied to evaluate the impact of assimilation and the relevance of different factors of the 3DVarBio method. A key factor is the observation error that has been tuned on a monthly basis to incorporate the representation error. Different frequencies of the assimilation cycle have been tested: daily or 3-day assimilation fosters the highest skill performances despite the reduced impacts and the increase of computational burden. Considering the present size of the BGC-Argo Mediterranean network (about 15 floats) and the estimated non-homogeneous correlation radius length scale (15.2 km on average), the chlorophyll assimilation can constrain the phytoplankton dynamics along the whole water column over an area up to 10% of the Mediterranean Sea.
1. Introduction
Operational ocean forecasting systems coordinate observations and modeling systems and have been widely recognized as important assets in monitoring the state of the ocean, thus addressing current challenges in increasing our understanding of the ocean and its role in society (Le Traon et al., 2017; She et al., 2016). Integration of data assimilation and models represents a key element in providing accurate assessments of ocean conditions over a wide range of spatial and temporal scales. Data assimilation is a well-developed practice in atmospheric science and in physical oceanography, whereas it remains a challenge in biogeo-chemical ocean modeling (Brasseur et al., 2009; Dowd et al., 2014).
There exist several assimilation methods applied to biogeochemical models (Edwards et al., 2015). A not exhaustive list includes popular implementations of Kalman filter methods such as the singular evolu-tive extended Kalman (Brasseur and Verron, 2006; Fontana et al., 2013)
and the singular evolutive interpolated Kalman (Triantafyllou et al., 2013; Nerger and Gregg, 2007; Tsiaras et al., 2017) and the ensemble Kalman filters (Ciavatta et al., 2011, 2014; Cossarini et al., 2009; Hu et al., 2012). Particle filter assimilation is a class of ensemble methods that are applicable to non-linear systems (Ristic et al., 2004; van Leeuwen, 2009; Mattern et al., 2013). Variational approaches that minimize a least-squares-based cost function include 3DVAR (Teruzzi et al., 2014) and 4DVAR (Song et al., 2016; Verdy and Mazloff, 2017) methods.
However, a few of the assimilation methods mentioned above are used in the context of operational biogeochemical model systems, specifically 3DVAR variational scheme (Teruzzi et al., 2016), hybrid ensemble-OI Kalman filter (Tsiaras et al., 2017) and optimal inter-polation with a multivariate balancing scheme (Ford et al., 2012). In these particular applications, the computational efficiency of the as-similation scheme (Teruzzi et al., 2018b) and the availability of
near-https://doi.org/10.1016/j.ocemod.2018.11.005
Received 6 March 2018; Received in revised form 5 November 2018; Accepted 27 November 2018
⁎Corresponding author.
E-mail address:[email protected](G. Cossarini).
Available online 30 November 2018
1463-5003/ © 2018 The Authors. Published by Elsevier Ltd. This is an open access article under the CC BY license (http://creativecommons.org/licenses/BY/4.0/).
real-time data (Le Traon et al., 2009) are also important aspects. The most commonly assimilated variable in biogeochemical model applications is remote sensing-derived chlorophyll (Ford et al., 2012; Fontana et al., 2013; Teruzzi et al., 2014, 2018a; Tsiaras et al., 2017) because of the spatial and temporal coverage of these measurements and their availability through operational services, such as the Co-pernicus Marine Environment Monitoring Service (CMEMS; Volpe et al., 2012; Le Traon et al., 2017). Very few examples of the assim-ilation of in situ observations exist, and the variables that have been incorporated into these studies include nutrients and oxygen from monitoring systems (Cossarini et al., 2009; Liu et al., 2017) and pCO2 and oxygen from multi-platform instruments (Verdy and Mazloff, 2017). The sparseness and lack of availability of in situ bio-geochemical measurements have limited their use in assimilation stu-dies to date, and represent a severe issue in operational biogeochemical modeling.
Autonomous in situ platforms have already made critical contribu-tions to improving physical assimilation systems. The Argo network is undoubtedly the most important in terms of the number of observations and its integration with assimilation systems. The deployment of the Argo network marked a transition in physical operational oceano-graphy, as it has provided publicly available observations of the interior of the global ocean in near real time (Le Traon, 2013). Recently, a biogeochemical equivalent of Argo, the BGC-Argo programme, has been established (Johnson and Claustre, 2016). The BGC-Argo network is rapidly growing, although the density of operational floats is still scarce compared to Argo. However, at regional scale, specific activities might provide a sufficient number of floats to both contribute to the im-provement of ocean biogeochemical models (Brasseur et al., 2009) and to be used in operational modeling frameworks (Le Traon et al., 2017). The Mediterranean Sea has one of the first BGC-Argo networks with a sufficient density of floats (deployed in framework of the NAOS French initiative and of the Argo-Italy BGC-Argo programme) to test and va-lidate assimilation systems.
Thirty-nine BGC-Argo floats equipped with biogeochemical sensors were deployed from 2012 to 2017, thus making the Mediterranean BGC-Argo network one of the densest (in terms of the number of pro-files per unit surface area) of the global ocean. The Mediterranean BGC-Argo float data also contributed to develop the quality control methods for the BGC-Argo chlorophyll observations that are presently endorsed at the international level (Schmechtig et al., 2016). Moreover, specific methods for nitrate sensor calibration have been derived for the Med-iterranean (Pasqueron de Fommervault et al. 2015; D’ Ortenzio et al. 2014) to account for the biogeochemical characteristics of the basin.
In this work, an innovative BGC-Argo data assimilation framework is discussed, and its feasibility within a realistic model is demonstrated. The framework is intended to be integrated into the operational Mediterranean biogeochemistry model (MedBFM) of the CMEMS system (Bolzon et al., 2017). The MedBFM model features the off-line coupling of NEMO3.6 (Clementi et al., 2017) and OGSTM-BFM (Lazzari et al., 2012, 2016; Cossarini et al., 2015) and includes separate physical (Dobricic and Pinardi, 2008; Farina et al., 2015; Storto et al., 2014) and biogeochemical (Teruzzi et al., 2014) variational data assimilation schemes. The 3DVarBio variational assimilation scheme has already been shown to be suited for biogeochemical data assimilation, due to its modularity (Teruzzi et al., 2014, 2018a). A new upgrade of the 3DVarBio has been developed to assimilate the vertical chlorophyll profiles and update the phytoplankton state variables of OGSTM-BFM model.
The Mediterranean Sea is characterized by peculiar vertical phyto-plankton characteristics; it displays a marked seasonal cycle of surface and deep chlorophyll maxima (Lavigne et al., 2015; Mignot et al., 2014) and a noticeable west-east deepening of the deep chlorophyll maximum and trophic gradient (Lavigne et al., 2015). Thus, the BGC-Argo float assimilation is discussed with the aim of showing its capability to cor-rect the vertical structure of modelled chlorophyll. Furthermore, we
propose a tuning procedure based on the analysis of the a posteriori observation and background errors (Desroziers et al., 2005) to define the observation error. Then, key elements of the 3DVarBio scheme, namely the components of the background error covariances and the frequency of assimilation, are tested to investigate their impacts on the chlorophyll assimilation and simulated chlorophyll vertical dynamics. Their sensitivity is analysed through diagnostic statistics (as defined in Mattern et al. (2018)) and novel statistical indexes.
The paper is organized as follows. After a brief presentation of the CMEMS biogeochemical modeling system for the Mediterranean and the BGC-Argo data (Section 2), we focus on the novel elements of the variational data assimilation. In the following section (Section 3), we describe the results of the new data assimilation method and a sensi-tivity analysis of several key elements. A discussion of some key issues involved in the assimilation of BGC-Argo data is provided inSection 4, then the paper closes with some final remarks and future prospects for the assimilation of biogeochemical data from multiple sources (Section 5).
2. Materials and methods
2.1. Mediterranean Sea model
The Mediterranean Sea hydrodynamic-biogeochemical model is the off-line coupled MFS–MedBFM with a 1/16° horizontal resolution and 72 unevenly spaced z-levels in the vertical direction (the first layer is approximately 1.5 m thick and the spacing increases to approximately 8 m at a depth of 100 m). The MedBFM biogeochemical model in-corporates the OGSTM transport model, which is based on the OPA system (Lazzari et al., 2010) and the Biogeochemical Flux Model (BFM; Vichi et al., 2015; Lazzari et al., 2012, 2016; Cossarini et al., 2015, 2017and references therein). BFM includes nine plankton functional types (PFTs): diatoms, flagellates, picophytoplankton and dino-flagellates are the phytoplankton groups, whereas carnivorous and omnivorous mesozooplankton, bacteria, heterotrophic nanoflagellates and microzooplankton are the heterotrophic groups. The BFM model describes the biogeochemical cycles of carbon, nitrogen, phosphorus and silicon, through the dissolved inorganic, living organic and non-living organic compartments. Dissolved oxygen, alkalinity and carbo-nate system dynamics are also represented by the BFM (Cossarini et al., 2015; Melaku Canu et al., 2015). The non-living compartments consist of 3 groups, specifically labile, semi-labile and refractory organic matter. The OGSTM-BFM is also integrated with a variational 3DVarBio scheme that has been used to assimilate remotely sensed surface chlorophyll (Teruzzi et al., 2014, 2018a).
The daily fields of the physical quantities (i.e., the horizontal and vertical current velocities, vertical eddy diffusivity, potential tempera-ture, salinity, sea surface height, surface wind stress and surface solar shortwave irradiance) that drive the transport of biogeochemical tra-cers and their dynamics are pre-computed by the Mediterranean Forecast System (MFS,Pinardi et al., 2003; Tonani et al., 2014; Oddo et al., 2014). MFS features the NEMO ocean general circulation model and the OceanVar variational scheme that assimilates satellite-observed sea level anomalies and in situ vertical profiles of temperature and salinity from XBTs, Argo floats and gliders (Dobricic and Pinardi, 2008; Storto et al., 2014).
The coupled model and the physical and biogeochemical assimila-tion schemes represent the core of the physical and biogeochemical components of the Mediterranean Monitoring and Forecasting (MED–MFC) system of the CMEMS (http://marine.copernicus.eu), which releases daily and weekly 3D-gridded forecasts (Clementi et al., 2017; Bolzon et al., 2017) and multi-decadal reanalyses (Simoncelli, et al., 2014;Teruzzi et al., 2016) of the state of the Med-iterranean Sea.
2.2. Data collected by BGC-Argo floats
The BGC-Argo floats network is one of the first real-time biogeo-chemical in situ ocean observing system (Johnson and Claustre, 2016). BGC-Argo floats are equipped with sensors that measure biogeochem-ical parameters (e.g., chlorophyll, nitrate, pH, oxygen, suspended par-ticles and downwelling irradiance) and collect and transmit data in near real time as the Argo floats (Roemmich et al., 2009).
The first BGC-Argo float was deployed in the Mediterranean in 2009. At present (August 2018), 39 floats have been deployed, and about 15 are still operational. In our model experiments, that cover the year 2015, 25 floats with chlorophyll data are available and located mainly in the western Mediterranean, the northern Ionian Sea and the central part of the Levantine basin (Fig. 1).
The measured chlorophyll profiles are processed with specific quality control (QC) methods and become available 24 h after the data are collected. Delayed mode QC for chlorophyll is based on specific quality control algorithms (Schmechtig et al., 2015), and an additional correction factor of 0.5 on the amplitude of WetLabs Fluorescence signal to get a proxy of total chlorophyll concentration is applied (Roesler et al., 2017).
Moreover, the pre-operational quality protocol applied before per-forming assimilation includes the detection of anomalous chlorophyll data (e.g., negative values, spikes exceeding 10 mg/m3), and the ap-plication of a 5-point moving Gaussian smoothing providing a 2-m-re-solution vertical profiles. Further, nitrate concentrations from 8 BGC-Argo floats (blue labels inFig. 1) after QC (Pasqueron de Fommervault et al., 2015) are used to assess the impact the 3DVarBio on a non-as-similated model variable.
2.3. 3DVarBio assimilation scheme
In the 3DVarBio assimilation scheme, the analysis step involves the
minimization of the cost function:
= + x x x B x x y x R y x J( ) 1 H H 2( ) ( ) 1 2( ( )) ( ( )) a a b T 1 a b b T 1 b (1) where xbis the background model state before the assimilation, xais the
analysis, y represents the available observations and y − H(xb) is the
innovation. B and R are the background and observation error covar-iance matrices. The term H is the observational operator. According to Weaver et al. (2003)andDobricic and Pinardi (2008), the solution of the cost function, namely the increment (xa− xb), is computed by
means of a new control variable v such that xa− xb= Vv, where B is
rewritten as B = VVTand the transformation matrix V can be decom-posed into a sequence of operators that characterize different aspects of the error covariances and transform increments from the control space to the model space. The 3DVarBio is based on the OceanVar physical assimilation scheme (Dobricic and Pinardi, 2008) and has been mod-ified for biogeochemical assimilation (Teruzzi et al., 2014, 2018a) by upgrading the decomposition of V = VBVHVV to integrate remotely
sensed chlorophyll data (Teruzzi et al., 2014, 2018a). The three op-erators are the vertical error covariance (VV), the horizontal error
covariance (VH) and the biogeochemical state variable error covariance
(VB).
In the present study, the 3DVarBio scheme is redesigned to permit the assimilation of chlorophyll observation vertical profiles by up-grading R and H, and the two linear operators VVand VH. The
biolo-gical operator, VB, which is built on covariances between chlorophyll
and other phytoplankton state variables (i.e., carbon, nitrate and phosphorus contents in the four phytoplankton group), is kept as in Teruzzi et al. (2014).
The upgraded observation operator H is a linear interpolator from the model grid to the observation space (i.e., to the position and vertical depths of the float profiles) and computes the sum of the chlorophyll content of the 4 phytoplankton functional types. The observation error Fig. 1. Positions of the BGC-Argo float profiles in 2015 (point colors indicate months); identification numbers are shown by the last 3 digits (e.g., 649 instead of
6901649) and show floats with chlorophyll data (black) and with chlorophyll and nitrate data (blue). The division of the Mediterranean Sea into sub-basins (names in italics) is indicated by the grey lines. (For interpretation of the references to color in this figure legend, the reader is referred to the web version of this article.)
R is implemented as a diagonal matrix whose values are estimated
through a tuning analysis presented inSection 3.1.
The minimization of the cost function is computed without log-transforming chlorophyll innovation vectors (Teruzzi et al., 2014, 2018a), which have, indeed, symmetric and mostly Gaussian distribu-tions (not shown). Possible negative increment values are corrected diagnostically at the end of the assimilation cycle with a very small positive value (10−4mg/m3) and with changes to nitrogen, phosphorus and carbon components of each PFT based on the VB operator
(Teruzzi et al., 2018a). The effect of this correction is negligible: it occurs in less of the 4% of the cases and mostly in the deepest part of the vertical chlorophyll profiles.
2.3.1. Vertical covariance operator
The vertical covariance operator VV consists of a set of profiles
obtained by empirical orthogonal function (EOF) decomposition (as described in Teruzzi et al., 2014) of a multiannual simulation (Bolzon et al., 2017). Sets of EOFs are computed for the sub-regions of Fig. 1 and for the 12 months in order to account for the spatial and temporal heterogeneity of the vertical dynamics of the background errors. Examples of EOFs modes for two selected sub-basins and months (Fig. 2) show that nearly all of the covariance is described by the first three EOFs. The first EOF mode reflects a uniform vertical covariance of the error in January, while significant EOFs obtained for August are characterized by low values in the 0–30 m layer and the presence of two
or more peaks with opposite signs in the deeper layers. These peaks account for the variability around the deep chlorophyll maximum (DCM), which is deeper in the eastern with respect to the western Mediterranean Sea (Lavigne et al., 2015). Moreover, in summer, the variance of higher order EOFs (grey lines inFig. 2) is larger than that in winter (i.e., the first three EOFs account for nearly 85% and 70% of the error covariance in January and August).
Western sub-basins (e.g., nwm inFig. 2) have EOF explained var-iances higher than the eastern ones (e.g., lev2 inFig. 2) reflecting a larger background variability in the western sub-basin (Teruzzi et al., 2014).
2.3.2. Horizontal covariance operator
The horizontal covariance operator VHconsists of a Gaussian re-cursive filter (Dobricic and Pinardi, 2008) whose correlation radius length scale modulates the smoothing intensity and the areas influenced by the operator. The filter has been redesigned to work with non-uni-form correlation radius length scales (Lr) because local effects may be important in regions with high spatial variability (Storto et al., 2014). At each model grid point and vertical level, Lr is set equal to the standard deviation of a Gaussian theoretical distribution estimated using a non-linear least squares fitting algorithm (i.e., Le-venberg–Marquardt algorithm implemented in the SciPy Python package) on the distribution of the temporal correlation between a given point and all of the nearby points within a radius of 100 km. The Fig. 2. First (blue), second (green), third (yellow) and higher order (grey lines) EOF modes of chlorophyll multiplied by respective eigenvalues for the northwestern
Mediterranean (nwm) and northern Levantine (lev2) sub-basins and for January (JAN) and August (AUG). (For interpretation of the references to color in this figure legend, the reader is referred to the web version of this article.)
temporal correlation is calculated using the daily output from a pre-vious run (Bolzon et al., 2017). The spatial distribution of Lr at surface is shown inFig. 3:the values of Lr range from 12–20 km and display a basin-average of 15.2 km and a standard deviation of 1.6 km. Lower values occur along the coast, whereas the areas characterized by the highest values reflect some common patterns of the mean current fields (Poulain et al., 2012). This result emphasizes that physical transport processes may lead to elevated covariance. The correlation radius length scale decreases with depth (the averages at 50 m and 100 m are 14.8 and 14.3 km, respectively), maintaining spatial patterns similar to those at the surface.
2.4. Setup of assimilation simulations
Several assimilation simulations were carried out (Table 1), em-ploying different configurations of key aspects of the 3DVarBio. Each simulation covers the period 1 Jan 2015–31 Dec 2015 and consists of sequential cycles of one assimilation step followed by a given number of forecast days.
A set of simulations featuring constant observation error (OE010, OE025 and OE050) is used to tune the monthly values of the ob-servation error, which is then used in the core simulation (OEtun) of the sensitivity analysis. An additional simulation (OEtunS) differs from OEtun because the observation error of each float profile is set equal to the tuned monthly values (used in OEtun) multiplied by the ratio be-tween the chlorophyll profile standard deviation and the average of all profile standard deviations of that given month.
The OEtun5eof simulation is intended to evaluate the effects of using a smaller number of EOFs to define the vertical component of the background error covariance (VV), whereas two other experiments
(OEtunLr+50 and OEtunLr+100) are used to analyse the sensitivity of
the assimilation to the increase (50% and 100%, respectively) of cor-relation radius length scale, Lr, of VH.
The assimilation cycle of OEtun is equal to 7 days, which is the frequency of the assimilation cycle currently adopted in the CMEMS Med-MFC-Biogeochemistry operational system (Bolzon et al., 2017) and is close to the sampling frequency of most of the BGC-Argo floats (i.e., 5 days in 2015). Thus, all the float profiles within a time window of ± 3 days centred on the day of a given assimilation step are con-sidered to be synoptic and used in the assimilation. When multiple profiles are available for a given float within the given time window, the different profiles are treated as independent measurements. The effect of the time frequency of the assimilation steps is assessed by decreasing the assimilation cycle length from 7 days to 5 days, 3 days and 1 day (OEtun5d, OEtun3d, OEtun1d) and assuming the temporal window used in searching for available float profiles has a width of ± 2 days, ± 1 day and 1 day, respectively.
The set of simulations also includes a reference run (REF), in which the MedBFM model is run without assimilation.
2.5. Diagnostic metrics
FollowingDesroziers et al. (2005)andMattern et al. (2018), diag-nostic statistics are calculated to quantify the model data difference for the posterior and prior model solutions:
=
dao y H ( )xa (2)
=
dbo y H ( )xb (3)
While, the following statistic:
=
dba H( )xa H( )xb (4)
Fig. 3. Correlation radius length scale of chlorophyll [km] at the surface.
Table 1
List of sensitivity test runs designed to assess the functioning of the assimilation of BGC-Argo float data. Lr is the length of the correlation radius.
Simulations VV VH Assimilation frequency Observation error
REF No assimilation
OE010 25 EOFs As in OEtun 7 days 0.01 mg/m3
OE025 25 EOFs As in OEtun 7 days 0.025 mg/m3
OE050 25 EOFs As in OEtun 7 days 0.05 mg/m3
OEtun 25 EOFs not uniform as inFig. 3(< Lr > = 15.2 km) 7 days Monthly tuned observation error OEtunS 25 EOFs As in OEtun 7 days As in OEtun but with a spatial component
OEtun5eof 5 EOFs As in OEtun 7 days As in OEtun
OEtunLr + 50 25 EOFs +50% of Lr w.r.t. OEtun 7 days As in OEtun OEtunLr + 100 25 EOFs +100% of Lr w.r.t. OEtun 7 days As in OEtun
OEtun5d 25 EOFs As in OEtun 5 days As in OEtun
OEtun3d 25 EOFs As in OEtun 3 days As in OEtun
quantifies the increments at the observation locations.
Two diagnostic quantities, the a posteriori observation error ˜oand the a posteriori background error ˜b:
= d d n
˜o ( ) ( )/ao T bo (5)
= d d n
˜b ( ) ( )/ba T bo (6)
are applied inSection 3.1to tune the observation error using the results of the constant observation error assimilation simulations (OEtun010, OEtun015 and OEtun050).
The impact of the BGC-Argo assimilation on biogeochemical fields and the sensitivity of the model to different factors are analysed using a series of diagnostics and novel metrics designed to characterize the intensity, shape and extent of the changes caused by the assimilation. In particular, we define the absolute integral increment (INT):
= = d INT dz/150 z ba 150 0 (7)
as the average of the absolute increment over the 0–150 m layer for each float profile and assimilation step. The average of INT over floats and assimilation cycles quantifies the intensity of the change on the updated chlorophyll fields.
FollowingMattern et al., (2018), the root mean square (RMS) of the differences between observation and prior model solution:
= d
e n
1 ( )
b bo 2 (8)
provides a measurement of DA performance: it can be intended as a short-term forecast skill metric since it is based on observations that are going to be assimilated in the following cycles.
High values of INT without a significant reduction of ebmight
in-dicate overfitting (Mattern et al., 2018). Thus, we define the overfitting metric: = d + d IO (( ) ( ) ) n t b o t aot , 21 2 (9)
that accounts for the reduction of the prior model solution and ob-servation difference at the t + 1th assimilation cycle given the previous (i.e., tth cycle) posterior model solution and observation difference. The metric is computed at time t + 1 using the same number of floats at time t. An assimilation system achieving a lower value of IO indicates that a given increment promotes a better innovation of the model so-lution at the following assimilation cycle.
The shape of the innovation profile index (ISP) provides a unique number to describe the shapes of the increment profiles for each as-similated float: = < > = d d ISP if if 0 0 2 0 n Z n ba n Z n ba 0 4 ( ) ( ) (10)
where Z(n) are defined as the five 30 m layers (i.e., 0–30 m, 30–60 m, 60–90 m, 90–120 m and 120–150) into which the increment profile is partitioned. The value of zero is given to negative increment layers, whereas a value of 2 to the power of the layer number minus one (i.e., 2°, 21, 22, 23, 24for the five layers) is assigned to positive increment layer. The sum of the five values then gives the ISP, which ranges from 0 (for entirely negative increment profiles) to 31 (for entirely positive increment profiles) and covers all the possible intermediate shapes of alternating positive and negative layers (see upper panel of Fig. 9). Intermediate values and high variability of ISP indicate that the as-similation provides not only corrections of the uniform bias along the vertical profile, but also adjustments to the shape of the modelled chlorophyll profiles.
Given the sparseness of BGC-Argo floats distribution, the index of spatial increment (ISI) is calculated to measure the impact of the as-similation in the horizontal dimension:
= >
ISI surface such that x x T dx dy,
xy xy
a b
m isi
, , 0 150 (11)
where TISIis a threshold equal to 0.001 mg/m3, and 〈|xa− xb|〉0 − 150m is the absolute increment averaged over 0–150 m in the model space. ISI provides the horizontal coverage of the impact of the BGC-Argo float network in the Mediterranean Sea, in our case.
Finally, the time persistency index (ITP) reflects how long the cor-rection of the assimilation persists over time in the vicinity of the po-sition of a float: = < = x x x x ITP timesuchthat ( ) ( ) 0.5 z neighbour x y tassim tREF assim REF 150 0 , 0 0 (12)
where xassimand xREF are the model solutions of the assimilation and
reference runs averaged in a neighbour (i.e., an area of 30 km of radius) of the float trajectory. Their difference is computed on the assimilation day (time t = 0) and for the following days (t); then the time series of the ratios between the differences at time t and t = 0 are used to evaluate the time after which the ratio is halved.
3. Results
3.1. Tuning of the observation error
The observation error is a critical element of biogeochemical data assimilation (Teruzzi et al., 2014) because quantities are usually mea-sured indirectly (e.g., optical measurements are converted into bio-geochemical quantities using theoretical and empirical models), leading to additional uncertainty (Dowd et al., 2014). Thus, the statistical properties of the observation errors are not perfectly known, and their determination is not straightforward (Desroziers et al., 2005). In prac-tice, several approaches can be used to define the observation error, including the precision of the measurement methods, the accuracy computed using independent datasets, and the representativeness and variability of spatial-temporal sampling (e.g.,Liu et al., 2017; Verdy and Mazloff, 2017; Gharamti et al., 2017aand2017b). Further, the observation error provides indications about the relative quality of the assimilated observations (Losa et al., 2012; Losa et al., 2014), thus it depends also on the temporal and spatial scales resolved by the model. Therefore, in order to account for the representation error, our ap-proach involves a tuning, on a monthly basis, of the observation error with respect to the consistency (i.e., equality) between the two a
pos-teriori observation (˜o) and background (˜b) errors as defined in Desroziers et al. (2005). The calibration procedure uses the results of the assimilation simulations with constant observation error values equal to 0.01 (OE010), 0.025 (OE025), and 0.05 (OE050) mg/m3 (Table 1) and is performed separately for each month.
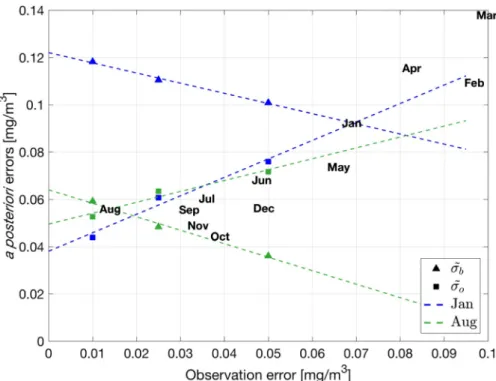
The linear regressions of a posteriori errors are shown for two se-lected months (Fig. 4) and their consistency is achieved at the inter-section where the observation error is equal to 0.0149 and 0.0690 mg/ m3, respectively, in August (green) and January (blue). Results of the calibration procedure for all months indicate a seasonal pattern with higher observation errors in winter and spring months, corresponding to periods with higher variability, and consistently with the hypothesis that representation errors correlate with high variabilities (Janjic et al., 2017).
To quantitatively analyse the effect of the observation error, the values of the diagnostic statistics are shown inFig. 5for the constant and tuned observation errors. The averages of the absolute increment metric (INT) indicate that the lower the observation errors, the higher the values of the INT indexes (Fig. 5a). In fact, the assimilation that features a lower observation error minimizes the cost function and
produces profiles that lie closer to the observed ones. The OEtun run has an average value of INT close to OE050 and is characterized by a lower range of the monthly values due to the effect of the time varying observation error.
To verify whether the monthly tuned observation error represents an optimal solution, we computed the RMS of the differences between observations and prior model solution, eb, and the index of the
over-fitting, IO (Fig. 5b). Despite the low variability of ebamong the
simu-lations, with the mean ebalmost equal among the experiments, OEtun
has the lowest value of the prior model error (i.e., 0.0885 and 0.0892 mg/m3 for OEtun and OE010, respectively) and presents re-duced evidence of overfitting. Higher observation errors during winter months of OEtun reduce the increments (dots on the right part of Fig. 5a) during period of high dynamics limiting the overfitting (dots on
the right part ofFig 5b). On the other hand, during summer, when variability is lower, the OEtun is characterized by lower observation error, which constrains better the model solution. Thus, the time varying observation error, consistently with the evolution of model error and its variability, represents a superior solution with respect to each one of the fixed observation error experiments.
The spatio-temporal variability of the metrics is pretty high (monthly averages are shown inFig. 5), highlighting a possible limit of the analysis that uses a small number of sparse observations to con-strain such a time-varying and heterogeneous marine ecosystem, as the Mediterranean Sea.
Consistently with the hypothesis that the observation error can be set proportional to the data dispersion or variability (Oke and Sakov, 2008), the OEtunS experiment features an observation error that Fig. 4. a posteriori observation (squares, ˜o) and background (triangles, ˜b) errors of OE010, OE025 and OE050 simulations and their linear regressions for January
(blue) and August (green). The a posteriori error consistencies and their respective observation error for each month are marked by the text labels. (For interpretation of the references to color in this figure legend, the reader is referred to the web version of this article.)
Fig. 5. Monthly (dots) and overall averages (squares and triangle) of diagnostic statistics for the constant and varying observation error assimilation simulations.
varies both in time (i.e., monthly tuned values of OEtun) and in space, according to the ratio between the standard deviation of each float profile and the monthly average of the standard deviation of all the floats.
The average diagnostics statistics yielded by the OEtunS simulation are largely consistent with those of OEtun (Fig. 5b). However, the variability of statistics decreases in the case of OEtunS because the use of normalized but spatially-varying observation error reduces the im-pact of some floats that have high innovation associated with high standard deviations (i.e., abrupt profiles with very high peaks, that occur for less than 10% of cases and mainly in winter). The observation error of these profiles is set higher than the monthly tuned values and it causes lower increments (not shown), filtering the effect of possible anomalous data. As an overall effect,Fig. 5shows that the same average of INT is produced despite the slightly lower average of the observation error of OEtunS w.r.t OEtun.
3.2. Assimilation impact on the chlorophyll and nitrate profiles
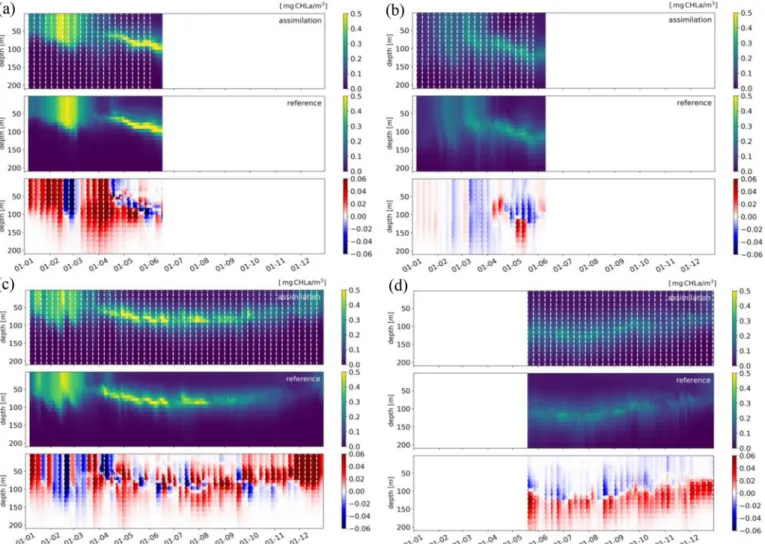
To analyse in details the effects of the BGC-Argo floats assimilation on vertical patterns, the Hovmoller diagrams ofFig. 6report the tem-poral evolution of chlorophyll profiles for four selected BGC-Argo floats in the western (6901491 and 6901600) and eastern (6901528 and 6901773) Mediterranean Sea. Chlorophyll profiles of assimilation (upper panels) and reference run without assimilation (REF, middle
panel) are averaged over an area of 30 km of radius surrounding each selected float trajectory. The OEtun-REF differences (lower panels in Fig. 6) show the impact of assimilation on the chlorophyll dynamics.
The upper/middle plots exemplify the behavior of phytoplankton dynamics simulated by the BFM model which are consistent with what described inLavigne et al. (2015). They show the increase in chlor-ophyll at the surface layer (bloom) during the winter and autumn, when vertically mixed conditions occur, the presence of a deep chlorophyll maximum (DCM) during summer stratified conditions, and the de-creasing trophic gradient from the western (e.g., 6901491 and 6901600 floats) to the eastern (e.g., 6901528 and 6901773 floats) Mediterranean Sea.Fig. 7completes the qualitative analysis, by reporting the profiles of prior and posterior model simulation and observation together with the innovation and increment profiles for some selected assimilation cycle of the floats ofFig. 6.
The major changes introduced by the assimilation during winter and early spring months (lower panel ofFig. 6a andb) affect the intensity and timing of the chlorophyll surface bloom and, to a lesser degree, the depth of the vertically mixed bloom. In the case of the float 6901491, the assimila-tion results in higher values of the surface bloom with respect to the re-ference run during almost all of the assimilation steps except in two weeks during February (Fig. 6a). Increments are generally homogeneous over the bloom layers till the onset of the DCM in April. As shown by the profiles of Fig. 7a, the assimilation forces a change in the depth of the bloom layer which is approximately 15–20 m deeper than the prior state.
Fig. 6. Hovmoller diagrams of the OEtun assimilation (upper) and the reference (middle) simulations and OEtun-REF differences (lower) and the timing of the 52
assimilation steps (dashed white vertical lines) for four selected BGC-Argo floats: 6901491 (a), 6901528 (b), 6901600 (c) and 6901773 (d). Hovmoller diagrams are calculated by averaging chlorophyll concentration in an area of radius 30 km surrounding the float trajectories; x-labels report the first day of each month in 2015.
The intensity of correction for float 6901528 (Fig. 6b) is pretty low since the model already performs quite well. Indeed, a very low in-crement is prescribed by the assimilation for float 6901528 at the se-lected date (Fig. 7b). Fig. 6b shows also that in April and May, the assimilation corrects the rate of deepening of the onset of the DCM, which starts shallower in April and ends deeper in May in the assim-ilation simulation with respect to the reference. Considering all the assimilation cycles during winter and autumn, the depth of the layer characterized by the surface bloom (i.e. depth at which the chlorophyll concentration is 10% of the surface value) is changed on the 56% of the cases.
During the summer period, the impact of the assimilation occurs mainly in the intermediate layers (between 50 and 150 m), which correspond to the DCM layer. In this case, the assimilation changes both the intensity of the DCM and the shapes of the chlorophyll profiles (Fig. 6c andd). In the case of float 6901600 (Fig. 6c), the comparison between OEtun and REF runs highlights a general good performance of the model in reproducing the processes driving the DCM formation in the area of the Western Mediterranean sub-basin visited by the float. The sequence of positive and negative corrections around the depth of the DCM displays, however, the presence of small-scale dynamics not properly simulated by the model. Conversely, the assimilation along the trajectory of float 6901773 has a constant impact that deepens the DCM (Fig. 6d), highlighting the presence of a possible bias of the model in reproducing the processes sustaining the DCM in this part of the eastern Mediterranean basin.
During summer, the innovation and increment profiles assume a characteristic “reversed S” (as inFig. 7c) and “S” shapes (as inFig. 7d), highlighting the ability of the assimilation to substantially change the location and width of the layer around the DCM (i.e., the layer where organic matter is produced during the summer season). As a result, the
DCM of the analysis of float 6901600 is 10 m shallower than that of forecast (Fig. 7c), while DCM of analysis of 6901773 has a more no-ticeable peak at 110 m depth w.r.t. forecast (Fig. 7d). The comparison of the analysis and forecast profiles of all assimilation cycles reveals that the 52% of the DCM depths are changed during April to August.
The chlorophyll assimilation updates directly the phytoplankton variables (17 state variables of the BFM model) through the VB
op-erator, and has an indirect impact on all the model variables. As an example, the impact of OEtun assimilation on nitrate is shown inFig. 8 w.r.t REF simulation. In floats 6901773 the assimilation forces a deeper DCM (Fig. 6d) which produces an extra consumption of nitrate at the layer of DCM (8b).
The correction of the timing of the surface bloom for float 6901600 during winter and spring (Fig. 6c) triggers extra (negative anomalies) and lower (positive anomalies) amounts of nitrate uptake by phyto-plankton (Fig. 8a). During summer, the nitrate differences between OEtun and REF are negative with the highest values corresponding to the moments of the highest positive corrections in chlorophyll dy-namics at the DCM depths (seeFig. 6c). On the other hand, the negative chlorophyll corrections have a minor impact in nitrate. Being phyto-plankton in a condition of luxury uptake for nitrate (Lazzari et al., 2016), the nitrate uptake is at the minimum during summer, showing negligible sensitivity to the decrease of phytoplankton biomass.
Using the nitrate concentrations from BGC-Argo floats (blue labels in Fig. 1), the skill performance assessment on the non-assimilated variable is reported (Table 2) in terms of RMS of the differences be-tween model and observations along 5 layers, and of the RMS of the difference of the depth of the nitracline (i.e., the depth at which the nitrate concentration is 2 mmol/m3). Statistics are given for the REF simulation and in terms of relative variation for the OEtun simulation. Even if our results must be cautiously considered due to the low
number of available profiles, the chlorophyll assimilation has an overall positive impact (quantified as the decrease of the RMS) in all sub-basins and almost all levels. Beside that, the nwm sub-basin shows also an improvement of the estimate of the displacement of the depth of the nitracline.
3.3. Sensitivity to the definition of VVoperator
To provide a statistical measure of the effectiveness of the data as-similation in changing the profile shapes, the ISP (defined in Section 2.5) assigns a unique value to any given alternation of positive and negative layers in the increment profiles (Eq. 10and the upper panel ofFig. 9). As an example, the ISP values of the four increment profiles ofFig. 7are 31, 0, 23 and 24. The frequency of the ISP values of OEtun (lower panels ofFig. 9) shows that, during winter and autumn, the increment profiles belong mainly to two categories, 0 and 31 (i.e., entirely negative and positive increments, respectively). This basically underlines a correction of some bias along the water column only. ISP values of 7 and 15 (in winter) and 7, 24, 28 and 30 (in autumn), are the other more frequent cases of increment profiles (frequency higher than 4%) that modify the thickness and depth of the layer containing the winter and autumn surface bloom.
In spring and summer, the ISP frequency distribution is broader, with frequency higher than 4% for ISP equal to 0, 3, 7, 16, 24, 28, 30 and 31 (spring), and 0, 7, 15, 16, 24, 28, 30 and 31 (summer). A larger range of ISP values reflect the capability of the float assimilation to compute complex increment profiles allowing for changes in the posi-tion and shape of the DCM (as in Fig. 7c and d). To emphasize the higher diversity of possible behaviors of the assimilation in the different seasons, the Shannon index of diversity is calculated as:
= = H plnp i 0 i i 31 (13) using the frequencies of the ISP values (pi). As expected, the H value for
spring and summer (Fig. 9) is 50–70% higher than that for winter and autumn.
The sensitivity of the vertical behavior of the assimilation is tested against a reduced number of EOF modes of VV(OEtun5eof) and a lower
observation error (OE010). A data assimilation system able to produce higher number of different types of vertical increments (higher H) would be preferable since it reflects a superior use of the information from the vertical chlorophyll profile of BGC-Argo floats.
OEtun5eof results (second lower panel inFig. 9) indicate that the addition of lower-variance EOF modes has a very small effect on the ISP frequency distribution (i.e., the Shannon index does not change sub-stantially), highlighting that the first EOFs are sufficient to integrate in the vertical direction the chlorophyll profiles in all the seasons.
On the other hand, the use of a low value of the observation error (OE010; bottom panel inFig. 9) gives the highest values of the Shannon index, with the exception of autumn. The increase is significant in winter but modest in spring and summer. The OE010 simulation forces more complex increment profiles and the chlorophyll analysis profiles to be much closer to the BGC-Argo float profiles than the other two experiments, when the model-observation difference is the highest (i.e., winter months). The low sensitivity during summer results primarily from the vertical resolution of the model in the zone of the DCM, which is between 8 and 14 m: the coarseness of the vertical model resolution limits the effectiveness of the data assimilation.
To examine how the range of the vertical subdivision affects this result, the ISP is recomputed for 8 layers 20 m-thick, resulting in 256 Fig. 8. Hovmoller diagram of nitrate [mmol/m3] for OEtun simulation (upper panels) and anomaly between OEtun and REF simulation (lower panels) for 6901600
(a) and 6901653 (b) floats. Hovmoller diagrams are calculated by averaging nitrate concentration in an area of radius 30 km surrounding the float trajectories.
Table 2
Skill performance of nitrate: RMS of the differences between REF and nitrate observations from BGC-Argo floats and RMS of the depth of the nitracline (depth at which nitrate equals to 2 mmol/m3); relative variations of statistics of OEtun w.r.t. REF. Statistics are calculated for nwm and two aggregated sub-basins
(lev = lev1 + lev2 + lev3 and ion = ion1 + ion2 + ion3).
REF RMS of nitrate differences [mmol/m3] RMS of nitracline
depth [m] no. of profiles
0–10m 10–30m 30–60m 60–100m 100–150m nwm 1.19 1.21 1.12 1.27 1.44 21 84 ion 0.19 0.19 0.15 0.46 0.88 16 108 lev 0.31 0.34 0.33 0.58 0.82 32 216 (OEtun-REF)/REF*100 nwm −3.9 −3.6 −4.2 −2.0 0.1 −9.5 ion 5.7 −0.5 −8.1 −0.9 −2.5 0 lev −0.6 −0.6 −0.3 1.2 0.2 0
possible increment profile shapes (not shown). The new values of H and the ISP variability are generally 15–25% higher than in the case of the 5-layer ISP but the differences among the simulations remain un-changed.
3.4. Sensitivity to the definition of VHoperator
The spatial extent over which the information from the BGC-Argo profiles propagates through the assimilation is mostly controlled by the
VHoperator and the correlation radius length scale. Daily 0–150 m
averaged maps of chlorophyll are shown inFig. 10(left panels) for two assimilation dates along with the increment maps of OEtun simulation (Fig. 10right panels). The increment maps are obtained by separately averaging the positive (shading) and negative (contour lines) incre-ments over the 0–150 m depths. Fig. 10 shows that the increment patterns are generally rounded patches, not overlapping since the dis-tance between floats remains large. Further, increment dimensions are comparable to the pattern of chlorophyll spatial features. Some of the floats, or profiles of the same float (e.g., floats in swm2, nwm and tyr2; Fig. 10right panel), are sufficiently close one to another that their in-crement areas overlap, showing more complex horizontal patterns. In-crement profiles characterized by ISP equal to 0 and 31 promote uni-form negative and positive vertical homogeneous patches (as in most of the cases of the upper panel ofFig. 10). During summer, increments are composed by vertically overlapping patches of negative and positive values since ISP differs from 0 and 31 (as in all cases ofFig. 10lower panel).
Given the chosen threshold (TISI), and the number of available
floats, large areas of the Mediterranean Sea remain unaffected by the assimilation. Computing the area with absolute increment values that exceed the threshold during each assimilation steps provides a measure of the spatial impact of assimilation. The mean area impacted by OEtun is 194 × 103 km2 (Table 3). The area impacted by the assimilation depends greatly on the number of available float profiles (between 14
and 22) and on the intensity of innovation. When ISI is normalized by the number of float profiles, the average area with increment values above the threshold is approximately 0.4% of the total surface area of the Mediterranean Sea. The normalized ISI is 30% higher in winter and autumn w.r.t. spring and summer because of higher absolute innovation and of the uniformity of the increments along the water column (ISP equal to 0 and 31). On the contrary, during summer a lower mean of the extent of the spatial impacted area arises from the vertical integration of the increment profiles with ISP shape different from 0 to 31 (i.e., increment profiles have very low values in some layers).
The correlation radius length scale (Lr) of OEtun, which is estimated using pre-existing modelled chlorophyll fields, has been tested against variation of + 50% and + 100% (OEtunLr+50 and OEtunLr+100, Table 1). The results of the sensitivity tests (Table 3) show that the ISI changes more than linearly: + 90% and + 190% in the two tests, re-spectively.
The increase of Lr shows also a slight improvement of the forecast skill performance with respect to the OEtun, since assimilation with a larger impacted area triggers a better evolution in the next point of emersion of the same float, which is usually 40–60 km far from the previous assimilated one.
However, larger horizontal uniform increment patterns might be not always optimal. Unless for large spatial bias, this can be intuitively deduced by the visual comparison of the dimension of horizontal pat-terns of the chlorophyll maps and the typical roughly round shaped increment patterns (Fig. 10). To investigate that, we computed the correlation between ESA-CCI daily satellite maps from CMEMS (Colella et al., 2016) and model surface chlorophyll for every sub-basins and assimilation cycles for the reference (REF) and assimilation simu-lations. In almost 60% of the cases, the correlation between satellite and surface model chlorophyll of the assimilation simulations does not change significantly w.r.t. the one of REF (i.e., correlation variation lower than 0.01). Indeed, the float assimilation does not substantially change the spatial pattern of the surface chlorophyll during summer.
However, we observe a worsening of the correlation of OEtun w.r.t. REF in 30% of the cases (mostly in winter) with a mean negative var-iation of the correlation of 0.04. With larger Lr, the worsening increases (Table 3) highlighting the possible onset of not consistent spatial pat-terns and spurious correlation.
3.5. Sensitivity to the frequency of the assimilation cycle
Another critical element that determines the effectiveness of the assimilation is the frequency of the assimilation cycle. High frequency assimilation cycles may promote the model simulation to more closely approach the evolution of the sequence of observations. However, in-sufficient in situ observation spatial coverage may result in unrealistic patchy and scattered analysis and in overfitting when the distance be-tween profiles is large compared to the scale of horizontal decorrelation (Cane et al., 1996). Indeed,Fig. 6shows that corrections introduced by
the assimilation can be smoothed by the model integration in the fol-lowing days, and the OEtun and REF simulation can converge towards similar chlorophyll profiles (i.e., anomalies OEtun-REF approaching zero in the lower panels ofFig. 6). When a local change is introduced by the assimilation, the following period of model integration may smooth the new condition depending on the physical (horizontal transport and diffusion into and from adjacent areas, and vertical mixing) and bio-geochemical processes that act upon the new condition.
We propose to quantify the persistence of the assimilation by fol-lowing the model evolution in a neighbour of the float trajectory. The difference between the OEtun and REF simulation is computed on the day of the assimilation step (t = 0) and on the following days (t = 1, 2,..6). The ratio between the differences at time t and at initial time (t = 0;Eq. 12) is reported inFig. 11for all BGC-Argo floats and the 365 days of simulation. The ratio is equal to 1 on the day of the as-similation steps (orange color inFig. 11) and decreases from 1 in the Fig. 10. Vertically averaged (over 0–150 m) maps of chlorophyll of OEtun simulation (left maps) for a winter (upper panels) and a summer (lower panels)
as-similation cycle. Average of positive (shaded color) and negative (contour lines) increments over 0–150 m depth (right maps) above the absolute threshold
TISI= 0.001 mg/m3.
Table 3
Comparison statistics between assimilation simulations featuring different correlation length scale radius (Lr). Overall index of spatial impact (ISI, third column) and ISI normalized by the number of assimilated float profiles (fourth column), numbers within brackets indicate the percentage of the Mediterranean Sea surface. Index of overfitting and RMS of prior model and observation misfit (fifth and sixth columns). Variation of model-satellite chlorophyll correlation between the assimilation and reference simulations (cases with negative correlation variation and average of the correlation variation, seventh and eighth columns).
Lr ISI [km2] ISI per float profile [km2] OI [mg/m3] e
b[mg/m3] Correlation between Satellite and model chlorophyll
% of cases worse than REF Variation w.r.t. REF OEtun As described in 2.3.2 193,310 (7.7%) 10,200 (0.41%) 0.0343 0.0885 27% −0.041
OEtunLr+50 +50% 372,570 (14.8%) 19,670 (0.78%) 0.0327 0.0867 30% −0.062 OEtunLr+100 +100% 562,500 (22.4%) 29,730 (1.18%) 0.0315 0.0857 30% −0.080
following days in almost 80% of the cases (shading strips toward green and blue colors inFig. 11). The index of temporal persistence (ITP), that accounts for how many days the ratio is above 0.5 after the assimilation steps, averages 5.7 days (Table 4). The 21% of the cases have values higher than 1 (grey shadings inFig. 11), indicating that chlorophyll assimilation can also initialize local phytoplankton dynamics that differ from those seen in the reference run. This difference is also encouraged by the assimilation of data from adjacent floats that drives a larger and self-sustaining area with divergent dynamics. Examples can be noted by concomitant grey shading stripes in adjacent rows of Fig. 11 which correspond to close float trajectories (e.g., 6901653, 6901648 and 6901649 in the nwm in January, 6901529 and 6901865 in ion3 in January, 6901769 and 6901864 in tyr2 in June, 6901771 and 6901863 at the border between ion2 and ion3 in June, and 6901764 and 6901766 in lev2 in June).
When the frequency of the assimilation steps increases from 7-day to 5, 3 and 1-day (OEtun5d, OEtun3d and OEtun1d inTable 1), the number of observed profiles that is available in each assimilation cycle decreases significantly (Table 4). The 7-day assimilation shows the highest persistence and INT because the presence of close profiles in some of the assimilation steps produces impacts on larger local areas, thus increasing the mean persistence. On the other hand, the daily as-similation (OEtun1d) has 291 cycles over the 365 total available (i.e., 20% of the days of the year lacks any available float) with an average of 4 available float profiles per cycle of assimilation. The analyses are less
widespread given the decrease of spatial interactions between floats and mean absolute increment (INT) is the lowest among the simula-tions. However, the increase of the assimilation frequency improves the skill performance statistics (eband IO generally decreasing inTable 4),
mostly because the chlorophyll profiles are assimilated at the same time and location as the temperature and salinity profiles assimilation in the physical model, thus increasing the consistency between the physical vertical properties and chlorophyll at the local scale. The best perfor-mances are for the 3-days and 1-day simulations. The slightly difference of persistence between them is mostly due to the fact that a float is assimilated by OEtun3d every 3 and 6 days, while, generally, every 5 days by OEtun1d, thus allowing a longer time of simulation between two consecutive assimilations in the latter case.
4. Discussion
The scarce availability of in situ data has limited their use in bio-geochemical data assimilation studies. Currently, the emerging avail-ability of BGC-Argo float data creates new opportunities (Dowd et al., 2014) that allows the combination of models and observations in in-vestigating the interior structure of marine ecosystems and for opera-tional purposes.
We show that the assimilation of BGC-Argo float data can be carried out in a variational assimilation framework and that this practice re-sults in significant corrections to the chlorophyll state and evolution, Fig. 11. Evolution of the ratio between the anomalies at the assimilation step and at the following days. Anomalies are defined as the differences between
assim-ilation (OEtun) and the reference (REF) simulations averaged over the area surrounding the float trajectories (as inFig. 6). The ratio is equal to 1 (orange) at the assimilation step, and values higher than 1 are shown in grey; ratio is not calculated when float data are not available (white). Floats are ordered from the western (bottom x-axis) to the eastern (top x-axis) Mediterranean Sea. (For interpretation of the references to color in this figure legend, the reader is referred to the web version of this article.)
Table 4
Index of temporal persistence (ITP) and diagnostic statistics among the assimilation runs with different assimilation frequencies.
Assimilation cycles ITP [days] INT [mg/m3] e
b[mg/m3] IO [mg/m3]
frequency n. of cycles n. of profiles
OEtun 7 days 52 20 5.7 0.0354 0.0885 0.0344
OEtun5d 5 days 73 15 4.6 0.0329 0.0861 0.0337
OEtun3d 3 days 121 10 4.3 0.0315 0.0850 0.0311
and in positive impacts on the analysed non-assimilated variable. Although the reference run (i.e., without biogeochemical assimilation) already provides reasonable results, the assimilation of chlorophyll data from BGC-Argo floats provides corrections to chlorophyll concentra-tions and several vertical features, such as the onset and dynamics of the DCM layer in spring and summer, the thickness of the water column involved in the winter and autumn surface blooms, and the timing of the blooms (Figs. 6and7). This result is an important novel aspect of this work, considering that, when assimilation employs satellite chlor-ophyll, the correction along the water column usually relies on a priori knowledge, such as predefined covariances (Song et al., 2016) or model ensemble-derived covariances (Ciavatta et al., 2014); moreover, apart from a few examples (Teruzzi et al., 2014; Jones et al., 2016), vertical corrections and assessments of the vertical phytoplankton state and dynamics are seldom shown.
The density of observations in the vertical direction is a key novel factor because BGC-Argo floats efficiently resolve vertical profiles of chlorophyll concentrations in the Mediterranean Sea (D’ Ortenzio et al., 2014; Mignot et al., 2014) and allow to correct simulated vertical phytoplankton dynamics (Figs. 6and7). Given the relevance of ana-lysing vertical profiles as a whole (as proposed inLavigne et al., 2015), the index of shape profile (ISP), which characterizes the increment profiles, showed that the first most relevant EOFs of the VVoperator of
3DVarBio are sufficient to integrate on the vertical direction the chlorophyll profiles in all the seasons. Low sensitivity of ISP in summer and spring is because the highest values of increments occur in the sub-surface layer, where the vertical resolution of the model is much coarser (e.g., layer thicknesses of 8–15 m at the depths of 100–150 m) than that of the observations. Indeed, this result indicates that the specific bio-geochemical processes taking place at depth in spring and summer (i.e., the formation of a deep chlorophyll maximum that is closely associated with the presence of a nutricline at the bottom of the photic layer) might require a finer vertical model resolution to depths of at least 150 m in the Mediterranean Sea to fully resolve the vertical plankton structure observed by the BGC-Argo floats.
A proper estimate of the observation error of the BGC-Argo floats data is a crucial aspect in effective assimilation. The sources of un-certainty in observations are many. First, the BGC-Argo biogeochemical variables are often derived from measurements of optical quantities through complex calibration processes, but little reference to the errors is provided (Dowd et al., 2014). The uncertainty of observations can be estimated considering independent datasets when they are available. For example,Mignot et al. (2018)employ a triple collocation analysis (Stoffelen, 1998; Gruber et al., 2016) to estimate the random error standard deviation in chlorophyll a concentrations collected by 21 BGC-Argo floats in the Mediterranean Sea by combining the covariances of three independent data sets. According to their analysis, BGC-Argo float chlorophyll a concentrations have a random error standard deviation of 0.03 mg/m3in the Mediterranean Sea, which is comparable with our tuned monthly observation errors. In biogeochemical data assimilation applications, the representation errors (Janjic et al., 2017) can be re-levant and difficult to estimate, considering that isolated observations are compared with model grid cells that may miss the spatio-temporal scales present in the observations, given the coarse resolution of the model (Oke and Sakov, 2008). Objective procedures for tuning the error covariance matrices represent a strategy to improve the assimilation (Mattern et al., 2018). In our case, a tuning based on the consistency between the a posteriori errors (Fig. 4) highlighted that observation errors should vary over the course of the year with lower errors in summer, when concentrations are lower and high values of chlorophyll are present only in a restricted portion of the water column, and higher errors in winter and early spring when the variability is the largest.
When the standard deviation of the float profiles is used as a proxy of the spatial representation error to be merged into the tuned ob-servation errors (OEtunS experiment), the assimilation scheme can serve as a filter for anomalous data (i.e., data whose high variability
may not be fully captured by the model) when prior QC rejection fails (Ingleby and Huddleston, 2007). However, in our simulations, the more complex description of the observation error covariance matrix has not given an overall improvement of the skill performance.
We tested the sensitivity of 3DVarBio to the frequency of the as-similation step (Fig. 11andTable 4) showing that the persistence of the corrections (ITP index) is almost invariant at an average time of half-decay of about 4–5 days, which, being roughly equal to the BGC-Argo operational frequency, confirms that BGC-Argo observing system pro-vides consistent information to constrain biogeochemical models at least along the float trajectories. Low persistence of assimilated formation might depend also on the biological processes simulated in-ternally by BFM (i.e., adjustments of biological interactions to the new conditions), and by possible mismatches between physical and biolo-gical processes (i.e., vertical mixing and nutrient availability, and me-soscale horizontal dynamics). Indeed, when the frequency is increased, despite the decrease of intensity of the increments and the increase of computation burden, the diagnostic statistics improved, because the BGC-Argo float observations are assimilated at the same sampling day corresponding to the assimilation of the Argo temperature and salinity profiles in the NEMOeOceanVar model (Clementi et al., 2017), thus increasing the local consistency between the physical and phyto-plankton 3D fields.
Low persistency has been already observed when satellite chlor-ophyll is assimilated (Fontana et al., 2013; Simon et al., 2015). A direct update of the nutrient fields by the chlorophyll assimilation would provide longer impacts on the biogeochemical model dynamics. It can be achieved by redesigning the VBoperator with a multivariate
cov-ariance (Ciavatta et al., 2016) or a balancing scheme (Hemmings et al., 2008). On the other hand, the integration of vertical profiles of bio-geochemical observations enables the investigation of the roles of physical processes on biogeochemical forecasts (Dowd et al., 2014) and the development of coupled physical-biogeochemical data assimilation (Gehlen et al., 2015). Given the modularity of the 3DVarBio scheme, the representation of missing processes can be improved by introducing an additional component to the VBVHVVoperators decomposition to
enable the correction of the physical forcing (such as vertical mixing diffusivities).
The 3DVarBio scheme propagates the information of BGC-Argo float data in the surroundings of the sampling points through the horizontal component (VH) of the background error covariance decomposition.
The key factor that controls the extent of the spatial impact is the correlation radius length scale (Lr) which has been set non-uniform given the importance in properly reproducing the spatial scales of mesoscale features (Storto et al., 2014). Estimated Lr has a spatial average of 15.2 km (Fig. 2), which is similar to the value used for the assimilation of the T and S profiles in OceanVar (Dobricic and Pinardi, 2008) and to the Rossby radius evaluated for the Mediterra-nean Sea (Robinson et al., 2001). Higher Lr values indicate that larger areas are updated by the assimilation with skill performances increased as well (Table 3). However, we verified by comparing with satellite surface chlorophyll that higher Lr might generate spurious spatial correlations. Other data assimilation applications similarly implement limitation of the horizontal correlation length or the decorrelation ra-dius to avoid occurrence of spurious correlations (Hu et al., 2012; Liu et al., 2017; Song et al., 2016; Tsiaras et al., 2017). Whatever are the Lr estimates, the effectiveness of the BGC-Argo data largely depends on the number of available profiles which, in the case of the Mediterranean Sea, is less than one third of those of physical assimilation. Increasing the number of BGC-Argo floats would be the ideal approach to en-hancing the performance of the floats network in the context of op-erational data assimilation. However, given the high cost for a BGC-Argo float equipment, their number might have already reached a sustainable threshold. There might be other improvements to be per-formed on the biogeochemical data pre-processing in order to extra-polate BGC-Argo profiles onto Argo profiles. For example, when two
![Fig. 3. Correlation radius length scale of chlorophyll [km] at the surface.](https://thumb-eu.123doks.com/thumbv2/123doknet/14798423.604949/6.892.151.747.94.336/fig-correlation-radius-length-scale-chlorophyll-km-surface.webp)