HAL Id: hal-00298709
https://hal.archives-ouvertes.fr/hal-00298709
Submitted on 16 Jun 2006HAL is a multi-disciplinary open access
archive for the deposit and dissemination of sci-entific research documents, whether they are pub-lished or not. The documents may come from teaching and research institutions in France or abroad, or from public or private research centers.
L’archive ouverte pluridisciplinaire HAL, est destinée au dépôt et à la diffusion de documents scientifiques de niveau recherche, publiés ou non, émanant des établissements d’enseignement et de recherche français ou étrangers, des laboratoires publics ou privés.
Effects of vegetation patterns on yields of the surface
and subsurface waters in the Heishui Alpine Valley in
west China
Yehan Liu, S. An, Z. Deng, N. Fan, H. Yang, Z. Wang, Y. Zhi, C. Zhou, S. Liu
To cite this version:
Yehan Liu, S. An, Z. Deng, N. Fan, H. Yang, et al.. Effects of vegetation patterns on yields of the surface and subsurface waters in the Heishui Alpine Valley in west China. Hydrology and Earth System Sciences Discussions, European Geosciences Union, 2006, 3 (3), pp.1021-1043. �hal-00298709�
HESSD
3, 1021–1043, 2006 Effects of vegetation patterns on yields of water Y. Liu et al. Title Page Abstract Introduction Conclusions References Tables Figures J I J I Back CloseFull Screen / Esc
Printer-friendly Version
Interactive Discussion
EGU
Hydrol. Earth Syst. Sci. Discuss., 3, 1021–1043, 2006 www.hydrol-earth-syst-sci-discuss.net/3/1021/2006/ © Author(s) 2006. This work is licensed
under a Creative Commons License.
Hydrology and Earth System Sciences Discussions
Papers published in Hydrology and Earth System Sciences Discussions are under open-access review for the journal Hydrology and Earth System Sciences
E
ffects of vegetation patterns on yields of
the surface and subsurface waters in the
Heishui Alpine Valley in west China
Y. Liu1, S. An1, Z. Deng1, N. Fan1, H. Yang1, Z. Wang1, Y. Zhi1, C. Zhou1, and S. Liu2
1
Laboratory of Forest Ecology and Global Changes, School of Life Sciences, Nanjing University, Nanjing 210093, China
2
Institute of Forest Ecology, Environment and Protection, the Chinese Academy of Forestry, Beijing 100091, China
Received: 22 March 2006 – Accepted: 19 April 2006 – Published: 16 June 2006 Correspondence to: S. An ([email protected])
HESSD
3, 1021–1043, 2006 Effects of vegetation patterns on yields of water Y. Liu et al. Title Page Abstract Introduction Conclusions References Tables Figures J I J I Back CloseFull Screen / Esc
Printer-friendly Version
Interactive Discussion
EGU Abstract
The relationships between different vegetation types and water yields were investi-gated in the Heishui Valley of the upper Yangtze River in western China. Contributions of groundwater and the water from surface and subsurface in different tributaries were, respectively, computed based on the stable isotope data, while the percentages of
dif-5
ferent vegetation covers were achieved by remote sensing in landscape scale. Based on the relationships between different vegetation types and water yields in seven water-sheds, we found that reduction in the total vegetation, forest and subalpine coniferous forest covers could cause increasing in surface and subsurface water yields, while the water yield increased with the alpine shrub and meadow cover increasing, respectively.
10
All the relationships were displayed as the low altitude and high altitude patterns, which were caused by the different vegetation characteristics and topography. We also found effects of the total vegetation cover played the most important role on water yield at large scale while the coniferous forest cover would affect the water yield at relatively small scale.
15
1 Introduction
Water and vegetation are the important resources on earth and the main components of the ecosystems. In general, hydrological behaviors affect key ecosystem processes and the effects depend on the amounts and duration of water storage in vegetation canopies, soils and stream channels (Post and Jones, 2001). So it is important to study
20
the relationships between water and vegetation in hydrological cycle aspect, especially that between the forest and hydrology.
On the effects of vegetation on hydrological traits, many studies have been carried out in paired-watershed. Hibbert (1967) reviewed 39 experimental catchments and concluded that the reduction in forest cover increased water yield; Bosch and Hewlett
25
HESSD
3, 1021–1043, 2006 Effects of vegetation patterns on yields of water Y. Liu et al. Title Page Abstract Introduction Conclusions References Tables Figures J I J I Back CloseFull Screen / Esc
Printer-friendly Version
Interactive Discussion
EGU
types, such as coniferous forests and deciduous hardwoods, caused different varia-tions in annual water yield; and then Sahin and Hall (1996) drawn a similar conclusion according to their reviews of 145 experimental catchments. But most of these experi-mental catchments are smaller than 2 km2(Andreassian, 2004) and the results needed scaling to and verifying in the larger catchments (Brown et al., 2005).
5
In the studies of hydrological cycles, the stable isotope H was used to identify the water sources and their contributions (Leopoldo et al., 1987; McDonnel et al., 1991; Kendall, 1993; Mortathi et al., 1997). For example, McDonnel et al. (1991) found that stream water in New Zealand was supplied partially by subsurface flow in the humid zone, while Mortathi et al. (1997) reported that the average contributions of surface
10
runoff and base flow (pre-event) were 30.3% and 69.7%, respectively, in the Amazon River. But, most researches also focus on hydrological behaviors in small catchments and there are few researches at large scale.
Remote sensing has many applications in hydrology, which included monitoring the surface extents of water bodies, water vapor, snow and ices, and water quality (Jiang
15
et al., 2004). And there are also many additional applications of remote sensing in hy-drological process, such as hydrologic watershed assessment, reservoir site selection, fish habitat survey, floodplain and shoreline zoning compliance, and survey of recre-ational use of lakes and rivers (Lillesand and Kiefer, 2000). However, the researches of hydrological process mainly focus on the physical aspects, and the interaction between
20
hydrological traits and vegetations was still poorly understood at large scale (Barrent and Curtis, 1999; Chang, 2003). Thus, it is useful to use remote sensing to study the effects of vegetation on hydrological process at large scale.
From the mentions above we know that there are few researches on effects of veg-etation on hydrological process by the combination of the stable isotope and remote
25
sense techniques on large scale. More studies based on the combination technique of stable isotope tracing and remote sensing are necessary.
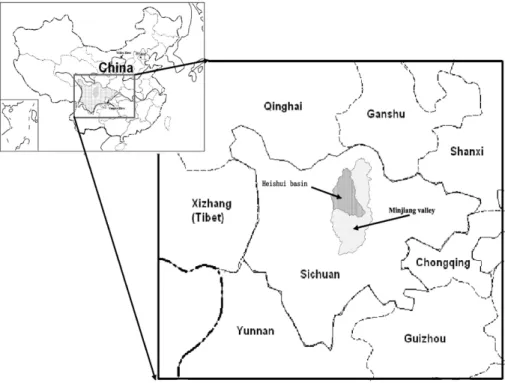
The Heishui Valley, one of upper catchment in Yangtze River, is the most important conjunction region between eastern and western China, and the region is both a great
HESSD
3, 1021–1043, 2006 Effects of vegetation patterns on yields of water Y. Liu et al. Title Page Abstract Introduction Conclusions References Tables Figures J I J I Back CloseFull Screen / Esc
Printer-friendly Version
Interactive Discussion
EGU
potential place for economic development and one of the most sensitive ecological and environmental areas in China (Chen, 2000). If the ecological environment of the upper course of the Yangtze River is destroyed, it will postpone the economic development of most of western China, and will lead to the flooding of the middle and lower courses of the river (Liu et al., 2001). So it is urgently needed to study effects of vegetation on
5
hydrological process in this region at a relatively large scale.
In this study, we computed the contributions of different tributary waters based on the stable isotope H tracers, classified the vegetation types of different watersheds using remote sense technique, and tried to find how the different vegetation patterns affect the hydrology variation on large watershed scale during transitional period from
10
low-flow to high-flow in the Heishui Valley.
2 Study areas
The Minjiang River, originating in the Gonggang Mountain, is an important tributary feeding the upper course of the Yangtze River, China. The upper course of the Minjiang River, about 24 000 km2in area, is the transitional area between the Tebiet Plateau and
15
the Sichuan Basin (Pu, 2000; Li et al., 2003). The Heishui Valley (River) (102◦360– 103◦300E, 31◦530–32◦380N), including its western waters originating from the Yang-gong Mountain and its northern waters originating from the Maoergai Grasslands, is the largest tributary of the upper course of the Minjiang River in western Sichuan Province (Fig. 1). The Heishui valley covers 7240 km2 and occupies 31.4% of the total area of
20
the upper Minjiang River. The main tributary of the Heishui River is 122 km long, and includes 1048 m of falls from Maoergai Grasslands to Shaba Village (Wang, 2003).
In the Heishui valley, the average annual temperature is 9◦C, and the average annual rainfall is 833 mm. The climate type is a monsoon climate, and there are obvious di ffer-ences between the wet season (May through October) and the dry season (November
25
through April) (Zhang et al., 2002).
alti-HESSD
3, 1021–1043, 2006 Effects of vegetation patterns on yields of water Y. Liu et al. Title Page Abstract Introduction Conclusions References Tables Figures J I J I Back CloseFull Screen / Esc
Printer-friendly Version
Interactive Discussion
EGU
tudinal belts holding the various soil types (Zhang et al., 2002; Chen et al., 2003). Allu-vial soil and mountain gray cinnamon soil are distributed between 1900 m and 2400 m, mountain cinnamon soil is distributed between 2400 m and 2900 m, mountain brown forest soil is distributed between 2900 m and 4000 m, alpine meadow soil is distributed between 4000 m and 4500 m, and alpine forest desert soil is distributed above 4500 m.
5
There are eight natural distinct vegetation types distributed along various altitudes in the Heishui valley (Jiang, 1994; Zhuang et al., 1995; Zhang et al., 2002; Jiang et al., 2004). The vegetation types include: (1) Arid shrub, whose latitude of distribution lies between 2300 m and 2400 m. Within these shrublands, the dominant species are
Aophora viciifolia, Cotinus coggvria and Lucium chinense. (2) Deciduous broadleaved
10
forest, distributed at latitudes between 2400 m and 2600 m. The dominant species in this region are Quercus liaotungensis and betula davurica. (3) Mixed broadleaf and coniferous forest, distributed at latitudes between 2600 m and 2900 m. The dominant species here include Picea asperata, Pimus tabulaeformis and Quercus liaotungensis. (4) Subalpine coniferous forest, distributed between 2900 m and 3800 m. This area’s
15
dominant species are Abies fabric and Picea asperata. (5) Alpine shrub, distributed between 2600 m and 3600 m. The dominant species here include Spiraea alpina and
Lonicera litangensis. (6) Alpine shrub meadow, distributed above 3600 m. The
dom-inant species include Carex alpine and Salixspp. (7) Alpine meadow, distributed be-tween 4000 m and 4500 m. The dominant species in this thinning area are Kobresiap
20
ygmaea and Carex alpine. And (8) Hillside and mountaintop, they distributed above
4500 m. Here, there are few herbaceous plants or fruting plants.
3 Methods
3.1 Field sampling
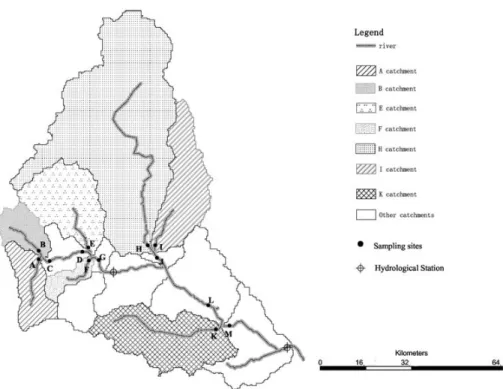
Water sampling sites for the river are presented in Fig. 3. There were 13 sampling
25
HESSD
3, 1021–1043, 2006 Effects of vegetation patterns on yields of water Y. Liu et al. Title Page Abstract Introduction Conclusions References Tables Figures J I J I Back CloseFull Screen / Esc
Printer-friendly Version
Interactive Discussion
EGU
sampling sites were named C, D, G, L and M along the principal course, and A, B, E, F, H, I, J and K for samples taken along the tributaries. At each sampling site water samples were collected at 08:00 a.m., 12:00 noon and 04:00 p.m. each day, and this regime was repeated for a total of three collection days. A total of 117 samples were collected during a level-flow period. All water samples were collected by water
5
collectors and stored in 250 ml non-reactive plastic bottles with rubber-seal caps. The sampling window ran from 3 June through 5 June, technically during the humid season, which began the next day after the rain was over. The reason for selecting this window was that the direct effects of rain and its surface water on the river as a whole were eliminated, according to stable curves of water levels noted by the hydrology station of
10
the Heishui County. The same methods were used during the low-flow period, whose sampling times included 19 March through 30 March, 31 through 2 April, and 5 April through 8 during the dry season in 2004.
3.2 Measurement of δD
The measurement and analysis of water samples was completed using the
Ther-15
mal Finnigan MAT DelTaplus XP. Accuracy of the measurements was ±3‰ for
δD. The final results were expressed by the relative to the value over SMOW: δD=[(D/H)sample−(D/H)SMOW] / (D/H)SMOW×103.
3.3 Methods of computing the contributions of different watersheds
Proportional contributions of several water sources to the mixed during a given period
20
of level flow were computed by the methods of the stable isotope H. In the analysis of contributions, a two-component model (Pinder and Jones, 1969) and IsoSource model (Phillips and Cregg, 2003), as described below, was, respectively, used:
Two-component model was used to cope with one isotope system with two sources:
Qt×Ct=Qs×Cs+Qp×Cp;
HESSD
3, 1021–1043, 2006 Effects of vegetation patterns on yields of water Y. Liu et al. Title Page Abstract Introduction Conclusions References Tables Figures J I J I Back CloseFull Screen / Esc
Printer-friendly Version
Interactive Discussion
EGU
Qs+Qp=Qt
Q was the discharge, C was the concentration of the applicable tracer, and the sub-scripts t, s and p referred to total, event, and pre-event water components, respectively. IsoSource model in this study was used to cope with one isotope system with three sources:
5
δM=fA×δA+fB×δB+fC×δC
1=fA+fB+fC
f was the proportions of source, δA,δB and δC were the source isotope signature and
δM was the observed isotope signature of the mixed.
The equations were suitable for three sources and the IsoSource model was also
10
performed in n isotope systems and >n+1 soueces. And in this study an average proportional contributions were used.
Hydrological data were collected in the two hydrological monitor stations (Fig. 3), and the contributions of different sources computed by the stable isotope method were tested by the results of data of runoff amount.
15
3.4 Vegetation classification with remotely sensed data
This study was based on the classification of Landsat 7 TM satellite image acquired on 10 July 2002 (path 130, row 38). The projection system in the satellite image was Universal Transverse Mercator (UTM) zone 50, and the spheroid and datum were Clarke 1866. ERDAS imagine software version 8.6 and ARCMAP GIS software version
20
8.3 were used to carry out the classification and mapping tasks.
In the classification of satellite image of the Heishui valley, the optimal iterative un-supervised classification (OIUC) method was used (Jiang et al., 2004). The OIUC method mainly includes that development of reference datasets, optimal iterative clas-sification using ISODATA clustering and post-clasclas-sification treatment. The accuracy of
HESSD
3, 1021–1043, 2006 Effects of vegetation patterns on yields of water Y. Liu et al. Title Page Abstract Introduction Conclusions References Tables Figures J I J I Back CloseFull Screen / Esc
Printer-friendly Version
Interactive Discussion
EGU
the vegetation classification in the Heishui valley was assessed by field validation and previously published ancillary spatial database. And the classification accuracy was calculated to be 92% for the whole area within the Heishui valley.
4 Results
4.1 Contributions of the waters in the different basins
5
In this study, hydrograph separation analysis during transitional period from low-flow to high-flow (Zhang et al., 2002) was conducted in different tributaries. The results showed that contribution of tributaries A and B to river C was 60% and 40%; contribu-tion of tributaries H and I to river J was 88% and 12%; contribucontribu-tion of tributaries K and L to river M was 26% and 74%; contribution of tributaries G and J to river L was 38%
10
and 62%, respectively. The results also showed that contributions of tributaries E, F and D to river G was 56%, 7%, and 37%, respectively (Table 1). The average runoff amount during 15 years (1990–2004) of the two hydrological monitor stations showed the contributions of G to M was 29% and 32%, respectively in May and June, and that of the studying year was 30% and 34%. The contribution was quite similar to the result
15
(74%*38%=28%) from the stable isotope tracer.
Based on both the proportions of the tributaries to mixed sites and the mixed sites to the whole water, the contributions of tributaries A, B, E, F, H, I, and K to the whole river were computed, and the contribution of tributary H with 40.37% was maximal and that of tributary F (2.00%) was minimal (Table 2). The order of contributions of surface
20
and subsurface waters was the catchments H (29.87%), K (24.18%), E (11.30%), B (5.02%), I (3.86%), A (2.73%) and F (1.40%), which was different from the order of contributions of the groundwater H (10.5%), E (4.4%), K (1.82%), I (1.65%), A (.1.47%), B (1.18%), F (0.60%).
HESSD
3, 1021–1043, 2006 Effects of vegetation patterns on yields of water Y. Liu et al. Title Page Abstract Introduction Conclusions References Tables Figures J I J I Back CloseFull Screen / Esc
Printer-friendly Version
Interactive Discussion
EGU
4.2 Vegetation patterns in the different basins
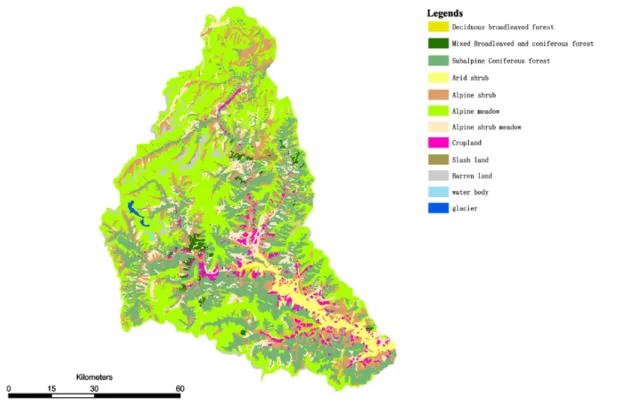
In the Heishui valley the vegetations included deciduous broadleaved forests, mixed broadleaved and coniferous forests, subalpine coniferous forests, alpine shrub, alpine shrub meadow, alpine meadow and croplands (Fig. 4). At catchment scale, included A, B, E, F, H, I and K (Fig. 3), the results of vegetation classification showed that the total
5
vegetation cover in catchments F, A, I, E, B, H and K was 97.59%, 96.09%, 96.07%, 95.93%, 94.18%, 92.05% and 86.64%, respectively; the subalpine coniferous forest, alpine shrub and alpine meadow were the dominant vegetations and these occupied more than 80% of the land cover in any of the seven catchments,; the forest cover in catchments I, A, F, K, B, H and E was, respectively, 43.12%, 35.56%, 32.99%, 25.34%,
10
23.23%, 20.56% and 19.58% (Table 3).
4.3 Effects of vegetation patterns on yields of the surface and subsurface waters during the level-flow period
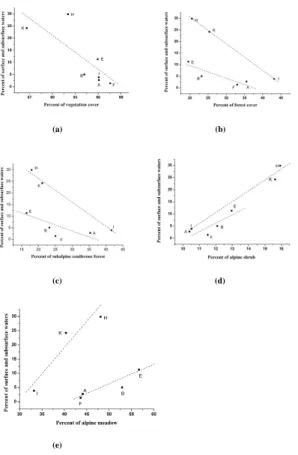
Our results showed that there were contrary trends between vegetation, forest and sub-alpine coniferous forest covers and surface & subsurface waters; namely, high cover
15
percentages were associated with low water yields and low cover percentages implied high water contributions (Figs. 5a, b, c); It was also obvious that the percentages of sur-face and subsursur-face waters increased with the percentage of alpine shrub and alpine meadow increasing, respectively (Figs. 5d, e). But the relationships of mentions above were presented in two modes including H–K–I and E/B–F/A except for (Fig. 5a) and
20
the two modes implied the differences in altitude (Fig. 2). The effects of low altitude vegetations along the line H–K–I on water yield were more strongly than that of high altitude vegetations along the line E/B–F/A. Therefore, the vegetation patterns could affect the runoff amount at catchment scales during transitional period from low-flow to high-flow in the Heishui Valley.
HESSD
3, 1021–1043, 2006 Effects of vegetation patterns on yields of water Y. Liu et al. Title Page Abstract Introduction Conclusions References Tables Figures J I J I Back CloseFull Screen / Esc
Printer-friendly Version
Interactive Discussion
EGU
5 Discussion
Land cover is the key parameter in hydrological cycle (Giertz et al., 2005) and wa-ter yield is an important indicator of wawa-ter balance at large wawa-tershed scale (Smith, 1990). Meanwhile, ecosystem water exchanges, including evaporation, transpiration, soil moisture movement, groundwater movement and runoff, determine the formation,
5
distribution and variability of ecosystems (Wang et al., 2005). Thus the relationships between land cover and water yield are an important issue in ecological studies.
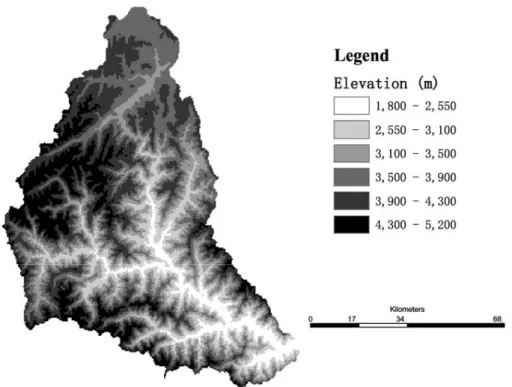
In this study, there was a special phenomenon, altitude modes, occurring in the ef-fects of vegetation patterns on the water yield. According to the T-test of mean and min altitudes, respectively, it was obvious that there was significant difference (p<0.05)
be-10
tween group including B, E, F and A catchments and group including H, K and I catch-ments (Figs. 2 and 3), which was same with the two modes in Fig. 5. This showed that there were two water yield patterns in the Heishui Valley, which were low altitude pat-tern and high altitude patpat-tern. Because altitude variations could lead to temperature variations in alpine valley, there was relatively higher temperature in the low altitude
15
pattern than that in the high altitude pattern. High temperature caused higher melt wa-ter velocity in the low altitude patwa-tern, while topography controlled the spatial patwa-terns of water, soil water properties and soil moisture (Ambroise, 1995). So the effects of low altitude vegetation along the line H–K–I on water yield were stronger than that of high altitude vegetation along the line E/B–F/A.
20
We also found that the increasing in the alpine shrub cover caused increasing of the water yield and the similar correlation between the alpine meadow cover and the water yield, which was contradicted with reduction in shrub and meadow leads to increas-ing of water yield in the paired catchments (Bosch and Hewlett, 1982; Sahin and Hall, 1996). The main reason was the capacity of water retention by terrestrial ecosystem
25
during transitional period from low-flow to high-flow. Many results have indicated that the capacity of water retention is closely related to vegetation, soil and slope (Lee, 1980; Hewlett, 1982; Ma, 1993; Guo and Gan, 2002). In the Heishui Valley, because
HESSD
3, 1021–1043, 2006 Effects of vegetation patterns on yields of water Y. Liu et al. Title Page Abstract Introduction Conclusions References Tables Figures J I J I Back CloseFull Screen / Esc
Printer-friendly Version
Interactive Discussion
EGU
subalpine coniferous forests had more power in increasing the soil organic matter, im-proving the soil construction, receding soil bulk density and enhancing the soil porosity than the alpine shrubs and meadows (Chang et al., 2003), the soil of subalpine conifer-ous forests had the highest water holding capability. Meanwhile, the velocity of melting water, mainly including snow and soil water meltings (Zhang et al., 2002), in the
south-5
facing slopes was higher than those in the north-facing slopes during transitional pe-riod from low-flow to high-flow, and the subalpine coniferous forests mainly distributed in the north-facing slopes, the alpine shrubs dominated the south-facing slopes and the alpine meadows common on the top of the mountains (Sichuan Vegetation Editing Committee, 1980; Jiang et al, 2004), So the water yield was positive correlation with
10
vegetation cover patterns in the south-facing slopes and negative correlation with the forest cover in the north-facing slopes.
Although spatial heterogeneity is omnipresent, changes with different scales, and the scaling is very difficult (Wu, 2000), scale analysis plays a more and more important role in landscape hydrology and forest studies (Dietrich and Montgomery, 1998) and
15
the relationships between vegetation cover and water yield in relative small catchments are needed to scale to larger catchments (Brown, et al., 2005). In this experiment, we could find that with the areas of seven catchments varying from 222 km2to 2248 km2, there was an obvious trend that the yields of surface and subsurface waters decreased with the increasing of vegetation cover, forest cover and subalpine coniferous forest,
20
respectively. At the same study areas, Jiang et al. (2004) believed that the increasing of the total vegetation cover decreased annual runoff amount, while the relationship between forest cover and annual runoff was irregular in the Minjiang’ catchments at dif-ferent scales from 2338 km2to 7621 km2. But in small scale (<2 km2), results of paired catchment studies showed that the reduction in forest cover or coniferous forest cover
25
increased water yields (Hibbert, 1967; Bosch and Hewlett, 1982; Sahin and Hall, 1996; Brown et al., 2004). Based on the researches in the three different scales, the forest cover, especially alpine coniferous forest cover, played different roles in controlling the water yields. In middle to small scale (<2248 or <2 km2), the forest cover played
impor-HESSD
3, 1021–1043, 2006 Effects of vegetation patterns on yields of water Y. Liu et al. Title Page Abstract Introduction Conclusions References Tables Figures J I J I Back CloseFull Screen / Esc
Printer-friendly Version
Interactive Discussion
EGU
tant controlling in water yields, while at large scale (>2338 km2) the controlling function was irregular and weak. The interaction in middle or small scales could not be scaled to the large scale. On the contrary, it was obvious that increasing in the whole vegeta-tion cover could cause the reducvegeta-tion of the water yields even from small scale to large scale. The possible reason was that the factors affecting water yield were complex in
5
large scale, and the relationships between the whole vegetation cover and water yields could better reflect the complexity than that between subalpine coniferous forest and the water yields did at large scale.
6 Conclusions
In the Heishui Valley, spatial variations of vegetation types in different watersheds
af-10
fected the water yield during transitional period from low-flow to high-flow. The reduc-tion in the total vegetareduc-tion, forest and subalpine coniferous forest covers could cause increasing in water yield, while water yield increased with the alpine shrub and meadow cover increasing, respectively. The trends were displayed in low altitude pattern and high altitude pattern. The main reasons of the phenomenon were the different intrinsic
15
vegetation characteristics and topographies. At large scale the total vegetation cover played the most important effect on water yield, while one type of vegetation such as coniferous forest cover would mostly affect the water yield at relatively small scale.
Acknowledgements. This study was supported by The National Key Basic Research Special
Funds (NKBRSF), PR China (No.2002CB111504). The authors would like to thank Y. H. Xie,
20
S. T. Zhang and J. W. Zheng, J. H. Jiang, Y. Zhang, G. J. Ren and X. Yao for their generous and ungrudging assistance during the experimental process. Many thanks also to the employees of the Heishui Weather Bureau for supplying necessary meteorological data. We also thank Y. S. Huang and J. Y. Pan of the Earth Sciences Department of Nanjing University for his advice and help.
HESSD
3, 1021–1043, 2006 Effects of vegetation patterns on yields of water Y. Liu et al. Title Page Abstract Introduction Conclusions References Tables Figures J I J I Back CloseFull Screen / Esc
Printer-friendly Version
Interactive Discussion
EGU References
Ambroise, B.: Topography and the water cycle in a temperate middle mountain environment: the need for interdisciplinary experiments, Agric. Forest Meteorol., 73, 217–235, 1995. Andreassian, V.: Waters and forests: from historical controversy to scientific debate, J. Hydrol.,
291, 1–27, 2004.
5
Barrent, E. C. and Curtis, L. F.: Introduction to environmental remote sensing, 4th ed. Stanley Thornes (Publishers) Ltd., London, UK, 452 pp, 1999.
Brown, A. E., Zhang, L., McMahon, T. A., Western, A. W., and Vertessy, R. A.: A review of paired catchment studies for determining changes in water yield resulting from alterations in vegetation, J. Hydrol., 310, 28–61, 2005.
10
Bosch, J. M. and Hewlett, J. D.: A review of catchment experiments to determine the effect of vegetation changes on water yield and evapotranspiration, J. Hydrol., 55(1/4), 3–23, 1982. Chang, M. T.: Forest hydrology: an introduction to water and forests, CRC Press, Boca Raton,
Fla, 373 pp, 2003.
Chang, Z. H., Lu. Z. H., and Guan, W. B.: Water holding effect of subalpine dark coniferous
15
forest soil in Gongga Mountain, China, J. Forestry Res., 14(3), 205–209, 2003.
Chen, Z.: The strategic position and the ecological and environmental function of the upper reaches of the Yangtze River, J. Mountain Sci., 18(3), 258–262, 2000.
Chen, N. S. and Chen, Q. B.: Frequency of different scale debris flows in limited triggering
earth – Taking Luojiaba Valley debris flow for example, J. Chengdu Univ. Technology, 30,
20
612–616, 2003.
Dietrich, W. E. and Montgomery, D. R.: Hillslopes, channels, and landscape scale, in: Scale dependence and scale invariance in hydrology, edited by: Sposito, G., Cambridge University Press, New York, 30–60, 1998.
Giertz, S., Junge, B., and Diekkruger, B.: Assessing the effects of land use change on soil
phys-25
ical properties and hydrological processes in the sub-humid tropical environment of West Africa, Phys. Chem. Earth, 30, 485–496, 2005.
Guo, Z. W. and Gan, Y. L.: Ecosystem function for water retention and forest ecosystem con-servation in a watershed of the Yangtze River, Biodiversity and Concon-servation, 11, 599–614, 2002.
30
Hewlett, J. D.: Principles of Forest Hydrology, University of Georgia Press, Athens, GA, 1982.
Hibbert, A. R.: Forest Treatment effects on water yield,Reprint from Proceedings of
HESSD
3, 1021–1043, 2006 Effects of vegetation patterns on yields of water Y. Liu et al. Title Page Abstract Introduction Conclusions References Tables Figures J I J I Back CloseFull Screen / Esc
Printer-friendly Version
Interactive Discussion
EGU
New York, 1967.
Jiang, H.: Dca ordination,quantitative classification and environmental interpretation of spruce and fir communities in northwest Sichuan and Gansu, Acta Phytoecologica Sinica, 18, 297– 305, 1994.
Jiang, H., Liu, S. R., Sun, P. S., An S. Q., Zhou, G. Y., Li, C. Y., Wang, J. X., Yu, H., and Tian,
5
X. J.: The influence of vegetation type on the hydrological process at the landscape scale, Can. J. Remote Sensing, 30(5), 743–763, 2004.
Kendall: Impact of isotope heterogeneity in shallow systems on shallow system on stormflow generation, Ph. D. dissertation, University of Maryland, College Park, pp 310, 1993.
Lee, R.: Forest Hydrolog, Columbia University Press, New York,1980.
10
Leopoldo, P. R., Martinez, J. C., Mortatti, J.: Runoff hydrograph analysis in agricultural water-sheds by oxygen-18, in: Isotope techniques in water resources development, IAEA, Vienna, 539–550, 1987.
Li, A. N., Zhou, W. C., and Jiang, X. B.: Dynamic change of land use/land cover during15 years in upper reaches of Minjiang River supported by RS and GIS, Journal of Soil And Water
15
Conservation, 17, 153–156, 2003.
Lillesand, T. M., and Kiefer, R. W.: Remote sensing and image interpretation, 4th ed, John Wiley & Sons, Inc., New York, pp 725, 2000.
Liu, S. R., Sun, P. S., Wang, J. X., and Chen, L. W.: Hydrological functions of forest vegetation in the upper reaches of the Yangtze River, J. Nat. Resour., 16(5), 451–456, 2001.
20
Ma, X.: Forest Hydrology, Chinese Forestry Press, Beijing, 1993.
McDonnell, J. J., Stewart, M. K., and Owens, I. F.: Effect of catchment-scale subsurface mixing on stream isotopic response, Water Resour. Res., 27, 3065–3073, 1991.
Mortathi, J., Moraes, J. M., Rodrigues, J. C., Victoria, R. L., and Martinelli, L. A.: Hydrograph separation of the Amazon River using 18O as an isotopic tracer, Scientia Agricola, 54(3),
25
167–173, 1997.
Pu, F. D.: The present conditions of ecology and biodiversity protection at upstreams of Min-jiang, Resour. Sci., 22, 83–85, 2000.
Phillips, D. L. and Gregg, J. W.: Source partitioning using stable isotopes: coping with too many sources, Oecologia, 136, 261–269, 2003.
30
Pinder, G. F. and Jones, J. F.: Determination of the groundwater component of peak discharge
from the chemistry of total runoff, Water Resour. Res., 5(2), 438–445, 1969.
HESSD
3, 1021–1043, 2006 Effects of vegetation patterns on yields of water Y. Liu et al. Title Page Abstract Introduction Conclusions References Tables Figures J I J I Back CloseFull Screen / Esc
Printer-friendly Version
Interactive Discussion
EGU
basin in New Hampshair, North Carolina, Oregon, and Puerto Rico, Adv. Water Resour., 24, 1195–1210, 2001.
Sahin, V. and Hall, M. J.: The effects of afforestation and deforestation on water yields, J. Hydrol., 178(1/4), 293–309, 1996.
Sichuan Vegetation Editing Committee: Sichuan vegetation, The People’s Publisher of Sichuan,
5
Chengdu, China, pp 465, 1980.
Smith, R. L.: Ecology and field biology, 4th ed, Harper Collins College Publishers, New York, pp 1055, 1990.
Wang, G. X., Shen, Y. P., Qian, J., and Wang, J. D.: Study on the Influence of Vegetation Change on Soil Moisture Cycle in Alpine Meadow, J. Glaciology and Geocryology, 25(6),
10
653–659, 2003.
Wang, Q. X., Watanabe, M., and Ouyang, Z.: Simulation of water and carbon fluxes using BIOME-BGC model over crops in China, Agric. Forest Meteorol., 131, 209–224, 2005. Wang, Z. W.: Exploitation of water and power of Heishui Valley, Sichuan Water Power, 22, 4–6,
2003.
15
Wu, J. G.: Landscape ecology (1st edn), Higher Education Press, Beijing, 2000.
Zhang, W. J., Li, M., Wu, Z. G., and Yang, B. G.: Features and evaluation of glacial landscape resources in Heishui Coutry, Sichuan Province, J. Mountain Sci., 20, 461–465, 2002. Zhuang, P., Pen, Q. X., Liu, R. Y., and Wu, H.: Study on the decline state of the abies fabri
forest in Emei Mountain, J. Wuhan Botanical Res., 13, 317–328, 1995.
20
Zhang, Z. Q., Zhao, Y. T., and Yu, X. X.: Hydrological processes of a dark coniferous forested watershed in the upper reaches of Yangtze River, J. Beijing Forestry Univ., 24(5/6), 25–30, 2002.
HESSD
3, 1021–1043, 2006 Effects of vegetation patterns on yields of water Y. Liu et al. Title Page Abstract Introduction Conclusions References Tables Figures J I J I Back CloseFull Screen / Esc
Printer-friendly Version
Interactive Discussion
EGU Table 1. Contribution of the tributaries to the main river course in Heishui Valley, Western
Sichuan, China. Mixed sites (C) (G) (J) (M) (L) Contribution sites A B E D F H I K L G J δD of mixed sites (‰) −91 −90.5 −87.8 −86.1 −88.8 δD of contribution sites (‰) −90.8 −91.3 −91.5 −89.4 −88.5 −88.1 −85.7 −78.4 −88.8 −90.5 −87.8 Contribution (‰) 60 40 56 37 7 88 12 26 74 38 62
* Note: the A, B, C, D, E, F, H, I, K, L, G and J denote the different tributaties; The (C), (G), (J), (M), (L) denote the mixed sites of different tributaries; the contributions of different tributaries are versus the mixed sites such as (C), (G), (J), (M) and (L).
HESSD
3, 1021–1043, 2006 Effects of vegetation patterns on yields of water Y. Liu et al. Title Page Abstract Introduction Conclusions References Tables Figures J I J I Back CloseFull Screen / Esc
Printer-friendly Version
Interactive Discussion
EGU Table 2. Contributions of water sources to the whole river water in the seven watersheds,
Western Sichuan, China.
Sites A B E F H I K
Contribution of groundwater (‰) 1.47 1.18 4.4 0.60 10.5 1.65 1.82
Contributionof surface and
subsurface waters (‰) 2.73 5.02 11.30 1.40 29.87 3.86 24.18
Contributionof tributaty water
to the whole water (Total)(‰) 4.20 6.20 15.7 2.00 40.37 5.51 26.00
* Note: The contributions of different waters in this tabulation were relative to the whole water, the water in any tributary was composed of groundwater, surface and subsurface waters. Sum of the contributions of seven tributary waters were equal to 100.
HESSD
3, 1021–1043, 2006 Effects of vegetation patterns on yields of water Y. Liu et al. Title Page Abstract Introduction Conclusions References Tables Figures J I J I Back CloseFull Screen / Esc
Printer-friendly Version
Interactive Discussion
EGU Table 3. Vegetation distribution (land area in km2) in the seven basins in the Heishui Valley,
Western Sichuan, China.
Land cover types Catchment (km 2
)
A B E F H I K
Subalpine Coniferous forest 109.4(35.33) 51.5(23.23) 99.4(16.48)29.1(25) 403.8(17.96) 248.7(41.61) 161.6(21.12)
Deciduous broadleaved forest 0(0.00) 0(0.00) 0.4(0.07) 2.1(1.80) 42.9(1.91) 0.1(0.02) 28.31(3.7) Mixed Broadleaved and
coniferous forest 0.7(0.23) 0(0.00) 18.3(3.03) 7.2(6.19) 15.4(0.69) 8.9(1.49) 4.0(0.52) Alpine shrub 32.2(10.4) 26.8(12.09) 78.2(12.97) 13.4(11.51) 358(15.93) 62.9(10.52) 119.5(15.62) Alpine meadow 136.5(44.09) 117.3(52.91) 341.7(56.67) 50.8(43.64) 1080.9(48.08) 198.5(33.21) 308.9(40.36) Alpine shrub meadow 18.7(6.04) 13.2(5.95) 40.9(6.78) 13.1(11.25) 15.4(0.69) 55.2(9.24) 40.7(5.32) Cropland 10.1(3.26) 0.5(0.23) 2.2(0.36) 0.3(0.26) 35.3(1.57) 15.6(2.61) 45.2(5.91) Slash land 0(0.00) 0(0.00) 1.2(0.19) 0.4(0.34) 18.5(0.82) 0.5(0.08) 0(0.00) Barren land 1.3(0.42) 7.1(3.2) 12.3(2.04) 0(0.00) 75.1(3.34) 4.5(0.75) 56.4(7.37) Water body 0(0.00) 1.5(0.68) 1.8(0.29) 0.01(0.01) 3.3(0.14) 0.3(0.05) 0.5(0.07) Glacier 0.7(0.23) 3.8(1.71) 7.1(1.18) 0(0.00) 3.8(0.16) 0(0.00) 0(0.00) Arid shrub 0 0 0 0 0 0 0 Total 309.6(100) 221.7(100) 603.5(100) 116.41(100) 2248.8(100) 597.7(100) 765.2(100)
*Note: The arid shrub didn’t exist in the seven catchments and existed in other catchments in this study.
HESSD
3, 1021–1043, 2006 Effects of vegetation patterns on yields of water Y. Liu et al. Title Page Abstract Introduction Conclusions References Tables Figures J I J I Back CloseFull Screen / Esc
Printer-friendly Version
Interactive Discussion
EGU
Figure 1
HESSD
3, 1021–1043, 2006 Effects of vegetation patterns on yields of water Y. Liu et al. Title Page Abstract Introduction Conclusions References Tables Figures J I J I Back CloseFull Screen / Esc
Printer-friendly Version
Interactive Discussion
EGU
Figure 2
HESSD
3, 1021–1043, 2006 Effects of vegetation patterns on yields of water Y. Liu et al. Title Page Abstract Introduction Conclusions References Tables Figures J I J I Back CloseFull Screen / Esc
Printer-friendly Version
Interactive Discussion
EGU
Modifying “Lee1980;Hewlett 1982; Ma 1993” to “Lee,1980;Hewlett, 1982; Ma, 1993”
at the line 27 and 28 in page 10
Modifying “In Heishui Valley” to “In the Heishui Valley” at the line 10 in page 12
Modifying “In large scale” to “at large scale” at the line 16 in page 12
Modifying “In relatively small scale” to “at relatively small scale” at the line 18 in page 12
Fig. 3. Distribution of water sampling sites, different catchments and hydrological monitor
HESSD
3, 1021–1043, 2006 Effects of vegetation patterns on yields of water Y. Liu et al. Title Page Abstract Introduction Conclusions References Tables Figures J I J I Back CloseFull Screen / Esc
Printer-friendly Version
Interactive Discussion
EGU Figure 4
Fig. 4. Vegetation types and distribution in the Heishui Valley Western Sichuan, China, based
HESSD
3, 1021–1043, 2006 Effects of vegetation patterns on yields of water Y. Liu et al. Title Page Abstract Introduction Conclusions References Tables Figures J I J I Back CloseFull Screen / Esc
Printer-friendly Version Interactive Discussion EGU (a) (b) (c) (d) (e) Figure 5
Fig. 5. Relationships between vegetation cover patterns and the yields of surface &
subsur-face waters in two modes including H–K–I and E/B–F/A in the seven catchments of the Heishui
valley during transitional period from low-flow to high-flow. (a) total vegetation covers versus
surface & subsurface waters, (b) forest cover versus surface & subsurface waters, (c)
sub-alpine coniferous forest versus surface & subsurface waters,(d) alpine shrub versus surface &