HAL Id: hal-00302277
https://hal.archives-ouvertes.fr/hal-00302277
Submitted on 16 Nov 2006HAL is a multi-disciplinary open access
archive for the deposit and dissemination of sci-entific research documents, whether they are pub-lished or not. The documents may come from teaching and research institutions in France or abroad, or from public or private research centers.
L’archive ouverte pluridisciplinaire HAL, est destinée au dépôt et à la diffusion de documents scientifiques de niveau recherche, publiés ou non, émanant des établissements d’enseignement et de recherche français ou étrangers, des laboratoires publics ou privés.
The weekend effect within and downwind of Sacramento:
Part 1. Observations of ozone, nitrogen oxides, and
VOC reactivity
J. G. Murphy, D. A. Day, P. A. Cleary, P. J. Wooldridge, D. B. Millet, A. H.
Goldstein, R. C. Cohen
To cite this version:
J. G. Murphy, D. A. Day, P. A. Cleary, P. J. Wooldridge, D. B. Millet, et al.. The weekend effect within and downwind of Sacramento: Part 1. Observations of ozone, nitrogen oxides, and VOC reactivity. Atmospheric Chemistry and Physics Discussions, European Geosciences Union, 2006, 6 (6), pp.11427-11464. �hal-00302277�
ACPD
6, 11427–11464, 2006Weekend effect in Sacramento Part 1
ozone, NOxand VOC
J. G. Murphy et al. Title Page Abstract Introduction Conclusions References Tables Figures ◭ ◮ ◭ ◮ Back Close
Full Screen / Esc
Printer-friendly Version Interactive Discussion
EGU
Atmos. Chem. Phys. Discuss., 6, 11427–11464, 2006 www.atmos-chem-phys-discuss.net/6/11427/2006/ © Author(s) 2006. This work is licensed
under a Creative Commons License.
Atmospheric Chemistry and Physics Discussions
The weekend effect within and downwind
of Sacramento: Part 1. Observations of
ozone, nitrogen oxides, and VOC
reactivity
J. G. Murphy1,*, D. A. Day1,**, P. A. Cleary1,***, P. J. Wooldridge1, D. B. Millet2,****, A. H. Goldstein2, and R. C. Cohen1,3
1
University of California at Berkeley, Department of Chemistry, Berkeley, CA, USA
2
University of California at Berkeley, Department of Environmental Science, Policy and Management, Berkeley, CA, USA
3
University of California at Berkeley, Department of Earth and Planetary Sciences, Berkeley, CA, USA
*
now at: University of East Anglia, School of Environmental Sciences, Norwich, UK
**
now at: University of California at Davis, Land, Air and Water Resources Department, Davis, CA, USA
***
now at: University of Pennsylvania, Department of Chemistry, Philadelphia, PA, USA
****
now at: Harvard University, Department of Earth and Planetary Sciences, Cambridge, MA, USA
Received: 30 October 2006 – Accepted: 6 November 2006 – Published: 16 November 2006 Correspondence to: R. C. Cohen ([email protected])
ACPD
6, 11427–11464, 2006Weekend effect in Sacramento Part 1
ozone, NOxand VOC
J. G. Murphy et al. Title Page Abstract Introduction Conclusions References Tables Figures ◭ ◮ ◭ ◮ Back Close
Full Screen / Esc
Printer-friendly Version Interactive Discussion
EGU
Abstract
Day-of-week patterns in human activities can be used to examine the ways in which differences in primary emissions result in changes in the rates of photochemical re-actions, and the production of secondary pollutants. Data from twelve California Air Resources Board monitoring sites in Sacramento, CA, and the downwind Mountain
5
Counties air basin are analyzed to reveal day of week patterns in ozone and its precur-sors in the summers of 1998–2002. This routine monitoring data is complemented by comprehensive data sets of ozone and nitrogen oxide concentrations and VOC reac-tivity obtained in the summers of 2001 and 2003 at three sites in the region. Daytime concentrations of nitrogen oxides (NOx) are approximately 35% lower on weekends at
10
all the sites, whereas the VOC reactivity changes by less than 10%. All six sites in the Sacramento Valley have higher 8-h maximum average ozone on the weekend and are more likely to exceed the national standard of 85 ppb on the weekend. In contrast, all the sites in the Mountain Counties are less likely to exceed the federal ozone stan-dard on the weekend. Analysis of the day-of-week trends in odd oxygen show that the
15
weekend effect of ozone within Sacramento is strongly influenced by NO sources close to the monitoring sites. This suggests that ozone measurements from monitoring sites close to highways, including two rural locations, may not be representative of the re-gional abundance, and lead to underestimates of long term exposure for humans and ecosystems.
20
1 Introduction
Day-of-week differences in meteorology and the chemical composition of the atmo-sphere have been frequently observed and attributed to the influence of humans on their environment (Ashworth, 1929; Cleveland, et al., 1974; Gordon, 1994; Beirle, et al., 2003). Many analyses have shown that in urban areas in North America and
Eu-25
maxi-ACPD
6, 11427–11464, 2006Weekend effect in Sacramento Part 1
ozone, NOxand VOC
J. G. Murphy et al. Title Page Abstract Introduction Conclusions References Tables Figures ◭ ◮ ◭ ◮ Back Close
Full Screen / Esc
Printer-friendly Version Interactive Discussion
EGU
mize on the weekend, when emissions of its anthropogenic precursors, nitrogen ox-ides (NOx≡NO + NO2) and volatile organic compounds (VOC), are lowest (Jacobson, 1975; Elkus and Wilson, 1977; Karl, 1978; Pryor and Steyn, 1995; Vukovich, 2000; Pont and Fontan, 2001; Pun, et al., 2003). In contrast, at other sites, mainly those in rural areas or regions with high biogenic VOC emissions, ozone is at a minimum on
5
the weekend (Cleveland and McRae, 1978; Altshuler, et al., 1995; Husar, 1998; Heuss, et al., 2003). Some analyses that grouped data according to meteorological variables have shown that the sign of the weekend effect depends on whether meteorological conditions result in rapid ozone production (Bronnimann and Neu, 1997; Paschalidou and Kassomenos, 2004). Recent work has assessed the historical evolution of the
10
weekend effect in central and southern California (Marr and Harley, 2002b; Fujita et al., 2003).
A better understanding of the processes responsible for the weekend effect can pro-vide direct insights into the policy-relevant question of how ozone concentrations are likely to respond to changes in precursor emissions (Altshuler et al., 1995; Blanchard
15
and Fairley, 2001). Chemical transport model simulations using emission inventories that include the day-of-week changes in the magnitude and timing of emissions in ur-ban areas have confirmed that there is a steeper reduction of NOxemissions compared
to VOC emissions on weekends, and that when these NOx reductions occur in NOx
-saturated (VOC-limited) locations, they promote the production of ozone (Marr and
20
Harley, 2002a; Yarwood, et al., 2003; Vukovich and Scarborough, 2004). Predictions from a recent modeling representation of a four-day period on the Iberian peninsula are consistent with observations of higher weekend ozone in urban areas, and lower ozone in regions downwind (Jimenez et al., 2005). However, most prior analyses have not included the detailed NOx and VOC measurements, in both NOx-saturated and
25
NOx-limited environments, that are essential for direct tests of mechanistic hypothe-ses. Those datasets that do exist are primarily short term, making it difficult to use observations to separate variability due to emissions from that caused by meteorologi-cal variability.
ACPD
6, 11427–11464, 2006Weekend effect in Sacramento Part 1
ozone, NOxand VOC
J. G. Murphy et al. Title Page Abstract Introduction Conclusions References Tables Figures ◭ ◮ ◭ ◮ Back Close
Full Screen / Esc
Printer-friendly Version Interactive Discussion
EGU
The factors which have been hypothesized to explain the weekend effect in urban areas include (California Air Resources Board, 2003):
1. ozone titration – less suppression of ozone by lower NOx emissions on weekend
mornings
2. increased weekend emissions – different activity patterns on the weekend actually
5
generate more O3precursors
3. aerosol and UV radiation – more of the photons required to initiate ozone produc-tion reach the Earth’s surface on weekends because of reduced aerosol concen-trations
4. NOx timing – weekend traffic patterns result in more NOx being available during
10
times of high photochemical productivity resulting in more efficient instantaneous ozone production (P(O3))
5. carryover at the surface – heavier traffic on Friday and Saturday nights results in a greater availability of O3precursors at the surface on weekend mornings
6. carryover aloft – large amounts of ozone and precursors persist above the
night-15
time boundary layer and mix down to the surface the following day in such a way that weekend concentrations are higher in urban areas
7. NOx dependence of P(O3) – lower NOx on weekends in NOx-saturated areas leads to more rapid ozone production
In this paper, we present observations of the day-of-week dependences of maximum
20
8-h average O3concentrations, and exceedances of the 8-h standard (85 ppb) from ur-ban sites in the Sacramento Valley (SV) and more rural sites in the Mountain Counties (MC) air basins of central California between 1998 and 2002. The topography of the region ensures that regular diurnal flow patterns persist (Zhong, et al., 2004) and that
ACPD
6, 11427–11464, 2006Weekend effect in Sacramento Part 1
ozone, NOxand VOC
J. G. Murphy et al. Title Page Abstract Introduction Conclusions References Tables Figures ◭ ◮ ◭ ◮ Back Close
Full Screen / Esc
Printer-friendly Version Interactive Discussion
EGU
datasets from entire summers can be treated in a statistically meaningful way with-out meteorological filters. Additionally we use measurements of NO, NO2, and volatile organic compounds (VOC) to probe the photochemical environment for ozone produc-tion. The California Air Resources Board routinely monitors O3, NO, and NO2at urban
sites in the Sacramento Valley and O3at sites in the Mountain Counties. We augment
5
these routine observations with measurements of NO2, total peroxy nitrates (ΣPNs),
total alkyl nitrates (ΣANs) and HNO3 made by thermal dissociation laser-induced
flu-orescence (TD-LIF) (Cleary et al., 2002; Day et al., 2002) at additional sites in the two air basins, to extend our understanding of the role of nitrogen oxides in regional ozone production. Gas chromatography measurements of speciated VOC (Lamanna
10
and Goldstein, 1999; Rubin et al., 2006) in the SV and MC are used to assess differ-ences in VOC reactivity with OH between weekday and weekend.
Simultaneous measurements of O3and NO2permit evaluation of the role of the first
hypothesis: ozone suppression by NO emissions, both during morning rush hour and throughout the day. Direct measurements of the NOx and VOC precursors to ozone
15
enable us to investigate the veracity of the second hypothesis. Observations of PM10
in the Sacramento Valley are used to assess the third hypothesis: the effect of varying aerosol concentrations on ozone formation. In a companion paper (J. G. Murphy et al., The weekend effect within and downwind of Sacramento: Part 2. Observational evidence for chemical and dynamical contributions; hereafter referred to as Murphy
20
et al., 2006b), we will extend the analysis to examine the final four hypotheses in the list above. These four hypotheses are related to the complex interplay between the emissions, non-linear photochemistry and dynamics that govern the production and distribution of ozone on the regional scale. This data set offers the unique opportunity to use the weekend effect to assess the evolution of the NOx-dependence of an airmass
25
from an urban center as it is advected toward a rural mountainous region.
The chemical coupling between ozone and NOx results in non-linear relationships
at concentrations of atmospheric relevance. The interconversion of O3, NO and NO2
ACPD
6, 11427–11464, 2006Weekend effect in Sacramento Part 1
ozone, NOxand VOC
J. G. Murphy et al. Title Page Abstract Introduction Conclusions References Tables Figures ◭ ◮ ◭ ◮ Back Close
Full Screen / Esc
Printer-friendly Version Interactive Discussion
EGU
cycle but act to partition the species according to the physical conditions (T, hν).
NO + O3→ NO2+ O2 (R1)
NO2+ hv O2
−→ NO + O3 (R2)
Net production of ozone occurs following the oxidation of volatile organic compounds (VOC) and CO by OH to generate peroxy (HO2+RO2) radicals (R3), which can oxidize
5
NO to NO2 (R4). The subsequent photolysis of NO2 regenerates NO and produces
an O(3P) atom which combines with O2 to form ozone (R2). The rate of ozone
pro-duction is set by R4a. At low concentrations of NOx, [HO2+RO2] are independent of NOxand ozone production increases linearly with increases in NO. However, high
con-centrations of the nitrogen oxide precursors relative to the reactivity of VOC promotes
10
the reaction of OH with NO2(R5), which suppresses the hydroxyl radical, slows the production of HO2+RO2, and results in less ozone production. In other words, RO2
becomes inversely dependent on NOx at high concentrations of NOx, resulting in a
non-linear dependence of O3production on NOxabundance. At low concentrations of NOx, peroxy radicals are lost mainly through self-reaction (R6).
15 OH + VOC−→ HO2 2O + RO2 (R3) RO2+ NO → RO + NO2 (R4a) RO2+ NO + M → RONO2+ M (R4b) OH + NO2+ M → HNO3+ M (R5) RO2+ R′O 2→ ROOR′+ O2 (R6) 20
Figure 1 shows the qualitative behavior of the ozone production rate over a wide range of NOxconcentrations and at three different VOC reactivities (≡Σk3[VOC]). On the
ACPD
6, 11427–11464, 2006Weekend effect in Sacramento Part 1
ozone, NOxand VOC
J. G. Murphy et al. Title Page Abstract Introduction Conclusions References Tables Figures ◭ ◮ ◭ ◮ Back Close
Full Screen / Esc
Printer-friendly Version Interactive Discussion
EGU
in VOC reactivity have little effect. On the right-hand side of the figure, decreasing NOx increases P(O3) and decreasing VOC reactivity decreases P(O3). In the
inter-mediate range, where ozone production rates are at a maximum, reductions in both VOC and NOxcan be effective at reducing ozone production. Much effort is currently expended in assessing the NOx dependence of ozone production with the goal of
de-5
veloping emission reduction strategies that will successfully decrease ozone violations without placing unnecessary restrictions on transport and industrial activity (National Research Council, 2004). The rate of ozone production (limited by R4a) is rarely eval-uated directly in the atmosphere, because peroxy radicals are extremely challenging to measure (Heard and Pilling, 2003). The relationships between ozone and other
10
products of the associated photochemistry such as nitric acid (R5) and peroxides (R6) have been suggested as an indirect measure of the NOx-dependence of ozone
pro-duction in an airmass (Sillman, 1995), although the relationships predicted by models have not been extensively compared to observations. Weekday-weekend differences in precursor emissions are a nominally well-controlled experiment that allows us to test
15
the dependence of ozone production on NOx concentration. Examining the sign and
magnitude of the weekend effect in a region may help in diagnosing the NOxregime in
which the majority of ozone is produced and suggest an effective course of action.
2 Air quality in the Sacramento region and downwind
Sacramento and the Sierra Nevada foothills to its east have been designated by the
20
federal Environmental Protection Agency as a “serious” non-attainment region that will require one of the latest attainment deadlines in the United States for the amended air quality standards, due to the severity of the problem. Violation of the 1997 Na-tional Ambient Air Quality Standard in ozone occurs when the 3-year average of the fourth highest daily maximum 8-h ozone concentration measured at a monitor equals
25
or exceeds 85 ppb. The Clean Air Act requires each state to develop a State Implemen-tation Plan (SIP) to attain the standard by a deadline set by the federal EPA. Strong
ACPD
6, 11427–11464, 2006Weekend effect in Sacramento Part 1
ozone, NOxand VOC
J. G. Murphy et al. Title Page Abstract Introduction Conclusions References Tables Figures ◭ ◮ ◭ ◮ Back Close
Full Screen / Esc
Printer-friendly Version Interactive Discussion
EGU
sunlight, high temperatures, significant VOC and NOxemissions from mobile sources, and biogenic emissions of reactive VOC from vegetation in the Sierra foothills com-bine to generate optimal conditions for rapid photochemical ozone production in the region. The state agency in charge of monitoring air quality and compiling the SIP, the California Air Resources Board (CARB), has divided the region into two distinct air
5
basins, the populous, low elevation Sacramento Valley, and the more rural, high ele-vation Mountain Counties (Fig. 2). While the geographical extent of the MC extends further south and north along the western slope of the Sierra Nevada, the analysis pre-sented in this paper is limited to those sites likely to be influenced by the Sacramento urban area. We include six sites in the Sacramento Valley Air Basin: T Street, Del
10
Paso, North Highlands, Roseville, Folsom and Elk Grove and six sites in the Mountain Counties Air Basin downwind of Sacramento: Cool, Colfax, Placerville, White Cloud, Jackson and a non-CARB site, the University of California Blodgett Forest Research Station (UC-BFRS). Shorter term data sets with more comprehensive chemical mea-surements were acquired by UC Berkeley researchers at two additional sites: Granite
15
Bay (July–September 2001) and Big Hill (March 2003–March 2004) and are used to inform our analysis of the longer term data sets.
Over the past twenty years, both air basins have exceeded the federal 8-h ozone standard between 15 and 75 days each year (CARB). Accurate comparisons of basin-wide trends are complicated by frequent changes to the number and location of active
20
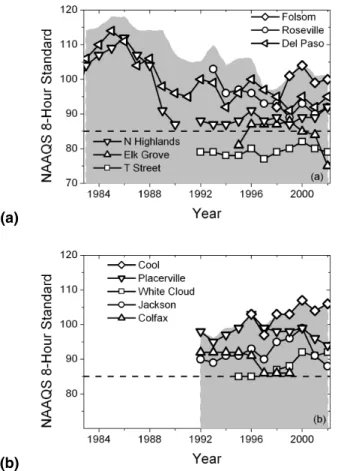
monitoring sites. Figure 3 shows the 8-h maximum air quality statistic (3 year average of 4th highest value) for the CARB sites included in this analysis. The trace along the top of the gray area shows the statistic for the entire air basin while the individual sites are identified in the years for which adequate data exists. Before 1992, only the Del Paso and North Highlands sites have data, and these sites suggest a marked reduction
25
in extreme ozone events between 1986 and 1991. Currently Folsom has the highest 8-h average maximum ozone concentrations in the Sacramento Valley region. None of the Mountain Counties sites examined in this analysis was established prior to 1992, yet the region clearly had an existing air quality problem by the time routine
monitor-ACPD
6, 11427–11464, 2006Weekend effect in Sacramento Part 1
ozone, NOxand VOC
J. G. Murphy et al. Title Page Abstract Introduction Conclusions References Tables Figures ◭ ◮ ◭ ◮ Back Close
Full Screen / Esc
Printer-friendly Version Interactive Discussion
EGU
ing at these sites began. Cool and Placerville have the highest 8-h maximum ozone concentrations among the Mountain Counties sites considered. Both air basins and all of the individual sites in the region except T Street and Elk Grove have violated the federal 8-h ozone standard every year for as long as ozone concentrations have been monitored in the region. While the SV air basin seems to have a downward trend in the
5
8-h air quality statistic, especially in the late 1980s, ozone concentrations in the MC air basin appear to be increasing at some sites. Historical measurements of ozone pre-cursors are not of sufficient abundance or quality to identify the cause of these trends, though rapid growth and geographical shifts in population centers likely contribute. Be-tween 1990 and 2000, population growth in the Mountain Counties, Eldorado (25%)
10
and Placer (44%), occurred more rapidly than in Sacramento County (17%), where most of the population growth was concentrated in the eastern suburbs (State of Cali-fornia, 2002). While the boundaries between the air basins do not match perfectly with county boundaries used in demography, this data suggests that NOx levels rose more quickly, in a relative sense, in the suburban and rural regions to the east of Sacramento
15
than in the urban center itself.
3 Regional meteorology and transport
A brief description of meteorology and transport is useful in understanding the ozone problem in the region. Exceedances of the ozone standard occur most frequently dur-ing the months of May through October. This time period is defined as summer in
20
the following analysis. During the summer, skies are generally clear, temperatures are high, and precipitation events are rare. The dominant surface flow within Califor-nia’s Central Valley is aligned along the major N-S axis of the valley. Much of the flow enters the Valley from the west through the Carquinez Pass and splits to flow from south to north over the Sacramento Valley and from north to south through the San
25
Joaquin Valley (Zaremba and Carroll, 1999; Zhong et al., 2004). Along the western slope of the Sierra Nevada range, daytime heating generates upslope flow from west
ACPD
6, 11427–11464, 2006Weekend effect in Sacramento Part 1
ozone, NOxand VOC
J. G. Murphy et al. Title Page Abstract Introduction Conclusions References Tables Figures ◭ ◮ ◭ ◮ Back Close
Full Screen / Esc
Printer-friendly Version Interactive Discussion
EGU
to east, while this pattern reverses at night and air drains back down toward the val-ley floor (Fig. 4). The two flows couple, resulting in overall southwesterly flow of the Sacramento plume during the daytime (Carroll and Dixon, 2002; Dillon et al., 2002). Figure 5 shows local wind direction measurements at the five Sacramento Valley sites and five Mountain Counties sites with meteorological data recorded by CARB and UC
5
Berkeley for the summers of 2000 and 2001. The roses depict the frequency of ob-servation of a wind direction (in 15 degree bins) during the daytime (10:00–18:00) in black and nighttime (22:00–06:00) in grey. Note the narrow range of wind directions at each site. All the sites in the Sacramento Valley have predominantly southwesterly flow during the daytime and southeasterly flow at night. The local wind directions of
10
the MC sites demonstrate why they are so likely to be influenced by emissions from Sacramento. Daytime flow at the mountainous sites is westerly or southwesterly and reverses to flow in almost exactly the opposite direction at night. Wind speeds are gen-erally twice as fast during the daylight hours. The flow along the Sierra slopes tends to recycle airmasses: air that passed the site two hours before sunset may pass by
15
again three or four hours after sunset if the flow changes by 180◦. In contrast, surface
measurements show that flow in the valley continually brings air from the south over Sacramento, though periods of stagnation do occur and are often associated with the highest concentrations of ozone in the city.
4 Timing of peak ozone
20
The ozone concentrations observed at a monitoring site are an integrated quantity de-termined by the timing and strength of the upwind precursor emissions and the rates of photochemistry and transport. Ozone production is initiated by OH radicals, whose concentration profile roughly follows insolation and thus maximizes near midday. Emis-sions of many biogenic VOC precursors to ozone production also peak in midday due
25
to temperature or light-dependent emission rates. Anthropogenic NOx and VOC con-centrations in the city are roughly constant once the daytime boundary layer has been
ACPD
6, 11427–11464, 2006Weekend effect in Sacramento Part 1
ozone, NOxand VOC
J. G. Murphy et al. Title Page Abstract Introduction Conclusions References Tables Figures ◭ ◮ ◭ ◮ Back Close
Full Screen / Esc
Printer-friendly Version Interactive Discussion
EGU
established and morning rush hour emissions are well-mixed. Observed ozone con-centrations are the integral of the upwind production and loss and therefore often peak an hour or two after noon in areas of efficient photochemical production. The maximum 8-h daily average and the central hour (median time of the eight hour period) of this occurrence were calculated for each site from May–October 1998–2002. The central
5
hour of the 8-h maximum was usually also the hour of the maximum concentration on that day. In the Sacramento Valley, airmasses take roughly two or three hours to move from south to north over the city, and the central hour of the maximum usually occurs at 14:00 or 15:00. For the urban and suburban sites in the Sacramento Valley, the cen-tral hour of the 8-h maximum occurs between 13:00 and 16:00 over 95% of the time.
10
Concentrations at Elk Grove tend to peak on the earlier side of that range, which sug-gests that the precursors required for rapid ozone production are not available upwind (>15 km south) of that site. The other factor controlling the timing of peak ozone in the city is rush hour emissions of nitric oxide, which titrate ozone locally in the early morn-ing and evenmorn-ing. Even on days where rapid photochemical ozone production does not
15
occur, maximum ozone is observed during midday because the higher boundary layer and a respite from rush hour traffic reduce the effects of titration from local NO sources. In contrast to the timing of the ozone maxima in the SV sites, which are consistent with efficient local production, the central hour of the 8-h maximum at the Mountain Counties sites occurs later and with greater variability. The timing follows a
geograph-20
ical trend where the sites closer to the city have earlier maxima. While peak concen-trations of OH and biogenic VOC emissions likely occur close to noon, the NOx and
anthropogenic VOC involved in ozone production are not available until upslope flow delivers urban emissions to the region. The concentration and timing of maximum ozone at the rural sites suggests that ozone is produced both in Sacramento and in
25
the urban plume as it is advected through the Mountain Counties. At the most remote sites, UC-BFRS and White Cloud, the diurnal cycle in ozone is less pronounced than near the city, and peak values typically occurs in the late afternoon (15:00–20:00). This timing is consistent with the transit time of the urban plume, corroborated by
measure-ACPD
6, 11427–11464, 2006Weekend effect in Sacramento Part 1
ozone, NOxand VOC
J. G. Murphy et al. Title Page Abstract Introduction Conclusions References Tables Figures ◭ ◮ ◭ ◮ Back Close
Full Screen / Esc
Printer-friendly Version Interactive Discussion
EGU
ments of CO, nitrogen oxides, and anthropogenic VOC at the UC-BFRS (Lamanna and Goldstein, 1999, Bauer et al., 2000; Dillon et al., 2002; Day, 2003). Days on which peak ozone concentrations occur in the early morning hours can be roughly equated with days when the urban plume does not reach the site later that day. For White Cloud and the UC-BFRS, the urban plume arrives on more than 80% of the days from May
5
to October. Thus improvements to air quality in the Sacramento Valley and Mountain Counties are likely to require controls on the emissions of urban precursors to ozone production.
5 The weekend effect in the Sacramento region
Because monitoring sites are predominantly located in populous areas where primary
10
pollutants and human exposure to them is maximized, most discussion of the weekend effect relates to high NOx environments with less attention focused on regions
down-wind. Many different metrics have been used to assess ozone and a “weekend effect” can depend on which data is chosen for analysis. Because ozone is a secondary pol-lutant that is relatively long-lived compared to its precursors, and because frequency
15
distributions of ozone have a tail at high concentrations that is particularly important in regulatory contexts, averages often mask important features. Research has gener-ally identified a weekend effect more readily when focusing solely on high percentiles, exceedance events or anything that concentrates on the extremes (Cleveland et al., 1974). We focus on the maximum 8-h average as a policy-relevant quantity that has
20
been shown to have weekday-weekend differences in a variety of photochemical envi-ronments (Heuss et al., 2003).
Using archived hourly ozone measurements during the summers of 1998–2002 from the twelve sites listed above, and attributing data between midnight and 07:00 a.m. to ozone production from the previous day (a necessary consideration only at the remote
25
sites), the maximum 8-h average ozone concentration was found for each day. The fre-quency of exceeding the federal 8-h air quality standard for ozone was then calculated
ACPD
6, 11427–11464, 2006Weekend effect in Sacramento Part 1
ozone, NOxand VOC
J. G. Murphy et al. Title Page Abstract Introduction Conclusions References Tables Figures ◭ ◮ ◭ ◮ Back Close
Full Screen / Esc
Printer-friendly Version Interactive Discussion
EGU
separately for weekdays and weekends. Compared to the rural sites, most urban sites have a lower rate of exceeding the federal eight hour ozone standard and are more likely to do so on the weekend (Fig. 6). Folsom and Cool seem to be ideally located to experience prolonged periods of high ozone concentrations, suggesting that they sit within or downwind of regions in which ozone is efficiently produced. The sign of
5
the weekend effect changes near the interface between the two air basins. The six MC sites all have improved air quality on the weekends, but in general they are more likely to exceed the ozone standard than any of the urban sites. Jackson is not directly downwind of the Sacramento area during normal wind conditions but likely receives anthropogenic emissions from the Interstate 5 corridor and possibly Stockton about
10
50 km to the west.
6 Day-of-week trends in O3, NOxand VOC
It is instructive to separate data from each day of the week to learn how the contribut-ing effects of emissions, and subsequent production, transport, and losses play out in influencing the trends. Day-of-week averages for the summers of 1998–2002 are
15
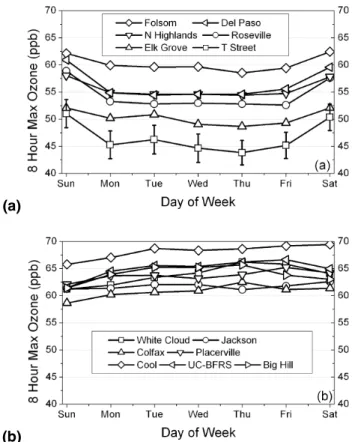
calculated for 8-h maximum ozone, and for daytime NOx and VOC concentrations, the precursors to photochemical ozone formation. Figure 7a shows that maximum 8-h O3
concentrations at sites in the Sacramento Valley are about 2–5 ppb higher on Sat-Sun compared to weekdays. In contrast, sites in the Mountain Counties, Fig. 7b, have the lowest 8-h O3 concentrations on Sunday and generally increase throughout the week.
20
Data obtained at Big Hill during the summer of 2003 are also included in this figure; along with three other sites it has lower ozone on Saturday than Friday. The importance of transport and the buildup of pollution is evident in the timing of the cycles, as most sites have lower ozone on Monday than on Saturday. The MC sites all have concen-trations closer to the federal standard and thus deviations from average behavior are
25
more likely to result in exceedances.
concen-ACPD
6, 11427–11464, 2006Weekend effect in Sacramento Part 1
ozone, NOxand VOC
J. G. Murphy et al. Title Page Abstract Introduction Conclusions References Tables Figures ◭ ◮ ◭ ◮ Back Close
Full Screen / Esc
Printer-friendly Version Interactive Discussion
EGU
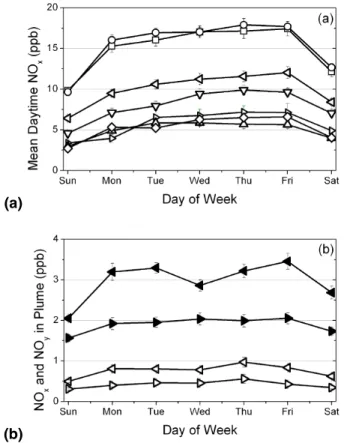
trations observed during early morning hours, but for the purpose of ozone production, it is the abundance of NOx during the daytime hours that is critical. Thus for Sacra-mento Valley sites, Fig. 8a compares the mean NOx concentrations between 10:00
and 18:00, a time period when photochemical activity is high and the boundary layer is well-developed. The California Air Resources Board does not monitor NOxat any sites
5
in the Mountain Counties so we rely on measurements of NO2, organic nitrates, and
HNO3made by UC Berkeley using TD-LIF instruments at UC-BFRS in the summer of
2001 and at Big Hill in the summer of 2003 to give an indication of day-of-week behavior in this region. Over a timescale of minutes to hours, nitrogen oxides are photochemi-cally processed into more oxidized reactive nitrogen species (NOz≡ peroxy nitrates +
10
alkyl nitrates + HNO3 + . . . ). The sum of all reactive nitrogen species (NOy≡ NOx +
NOz) is therefore a better conserved species in the atmosphere than NOx alone. NO
is less significant at rural sites and is estimated here using measurements of NO2and
the relationships described in R1–R3. Figure 8b shows the concentrations of both NOx and NOy at two sites in the Mountain Counties between 12:00–20:00, when ozone
15
peaks.
Measurements of NOx are made by the California Air Resources Board using the TECO 42C instrument, which passes air over a heated catalyst that converts reactive nitrogen compounds to NO, which is subsequently detected using chemiluminescence. This molybdenum oxide catalyst used in these instruments is known to have a positive
20
response to organic nitrates and nitric acid in the temperature range in which it is op-erated (Winer et al., 1974, Fitz, 2002), however the inlets on these instruments are not configured to sample HNO3 effectively. The NO2 concentration reported by this
mea-surement technique is therefore likely to be biased high by the presence of organic nitrates. The extent to which the NOx concentrations are overestimated depends on
25
the relative importance of NOz to total nitrogen oxides. In urban areas like the Sacra-mento Valley, where recent emissions of NO dominate, the positive interference is less important than in highly processed airmasses. Measurements of organic nitrates by TD-LIF at the UC Berkeley site of Granite Bay from July–September of 2001 (Cleary et
ACPD
6, 11427–11464, 2006Weekend effect in Sacramento Part 1
ozone, NOxand VOC
J. G. Murphy et al. Title Page Abstract Introduction Conclusions References Tables Figures ◭ ◮ ◭ ◮ Back Close
Full Screen / Esc
Printer-friendly Version Interactive Discussion
EGU
al., 2005) suggest the positive bias would be less than 30% of NOx, even for a 100% conversion efficiency of organic nitrates to NO by the catalyst.
Figure 8a shows the weekly cycle in mean daytime NOxconcentrations at sites in the
Sacramento Valley for the summers of 1998–2002. Roseville is located within 200 m of Interstate 80 while the T Street site is in the downtown core and less than 400 m
5
north of Highway 50. The NOxobservations at these sites likely represent the high end
of the range of NOx concentrations present in the boundary layer over Sacramento. Lower weekend emissions result in substantially reduced concentrations, and average concentrations increase from Monday through Friday. While individual sites are located within varying proximities to emission sources, it appears that NOx increases at the
10
sites in parallel by roughly 0.4 ppb/day throughout the week. This suggests that NOxis building up in the city during the week and/or that the city receives air from an upwind source that also has NOx building up during the week. Similarly, the concentrations
observed on Saturday are 25% higher than those observed on Sunday. Although it is unclear to what extent that reflects different emissions versus different initial conditions,
15
it can be expected that carryover from Friday is an important factor. Traffic counts and fuel-dependent emission factors have been used to estimate the day-of-week cycle in mobile source NOx emissions in Central California (Marr and Harley, 2002a; Harley,
et al., 2005). These estimates indicate that emission patterns are similar Monday through Thursday, with additional late night emissions on Friday. There is a significant
20
decrease in heavy duty diesel traffic on weekends, and total NOxemissions on Sunday
are slightly lower than Saturday.
The absolute abundance of NOy and NOx at Mountain Counties sites (Fig. 8b) is much lower than in the Sacramento Valley but the weekend/weekday NOxratio of about
65% persists throughout the region. The rural sites do not have the same trend of
in-25
creasing NOx throughout the week that the urban sites do, but the MC datasets only encompass one year of data each and synoptic scale transport patterns may mask a more general pattern of increases that might be evident if additional data were avail-able. The rural sites have lower NOx concentrations on Sundays than on Saturdays,
ACPD
6, 11427–11464, 2006Weekend effect in Sacramento Part 1
ozone, NOxand VOC
J. G. Murphy et al. Title Page Abstract Introduction Conclusions References Tables Figures ◭ ◮ ◭ ◮ Back Close
Full Screen / Esc
Printer-friendly Version Interactive Discussion
EGU
indicating lower emission and/or regional carryover of emissions from the previous day. These day-of-week trends confirm that increased traffic to recreational areas in the Sierra Nevada on the weekend does not dominate the NOx pattern observed at the
rural sites during times of maximum ozone. It is consistent with observations at UC-BFRS that sources in the Sacramento Valley contribute significantly to NOx observed
5
downwind in the Mountain Counties sites throughout the week. Figures 7a and 8a show that higher ozone on the weekend in urban areas occurs when NOx concentra-tions are lower. Figures 7b and 8b demonstrate that in rural airmasses with less NOx,
the weekend effect in ozone changes sign, and fewer exceedances occur on weekends in rural areas downwind of major NOxsources.
10
Other studies in this region and in other urban areas have shown a similar decrease in NOx concentrations on weekends (∼35%) with a smaller decrease in the
abun-dance of the VOC precursors to ozone production (Marr and Harley, 2002b, Blanchard and Tanenbaum, 2003). CARB monitors non-methane hydrocarbons (NMHC) at three Sacramento Valley sites using a TECO 55 hydrocarbon analyzer that reports a mixing
15
ratio of total C in NMHC. Figure 9 shows that as air moves from south to north and east over Sacramento (from Elk Grove to Del Paso to Folsom), the daytime concen-tration of NMHC increases by roughly a factor of two, due likely to both accumulating anthropogenic emissions and biogenic emissions, especially from the oak belt on the eastern perimeter of the city. Assessment of the change in ozone production rate due
20
to changes in peroxy radical precursors would require identification and quantification of the individual compounds since the rate at which VOC are oxidized to RO2(k3) varies
by orders of magnitude between species.
Speciated measurements of the VOC that contribute strongly to ozone production were made simultaneously at Granite Bay and the UC-BFRS from July–September
25
2001. A detailed list of VOC measured at Granite Bay can be found in Rubin et al. (2006). While the VOCs measured at the sites include a wide variety of both biogenic and anthropogenic compounds, some species that were not measured may make a non-negligible contribution to the reactivity in the airmass. Formaldehyde is
ACPD
6, 11427–11464, 2006Weekend effect in Sacramento Part 1
ozone, NOxand VOC
J. G. Murphy et al. Title Page Abstract Introduction Conclusions References Tables Figures ◭ ◮ ◭ ◮ Back Close
Full Screen / Esc
Printer-friendly Version Interactive Discussion
EGU
likely the most important contributor to reactivity that was not included in the mea-surements, but its main source in the region is isoprene degradation and thus it is not expected to have a strong day-of-week pattern. Carbon monoxide was measured by gas chromatography at UC-BFRS during this time period and is considered as part of the reactivity with OH. No CO measurements were made at Granite Bay, therefore
5
measurements from the Del Paso site were used, which likely overestimate CO, but represent the same day-of-week pattern as other anthropogenic contributions to re-activity not measured at the site. CO contributes roughly 20% to the rere-activity with OH at both the suburban and rural sites. Figure 10 shows the daytime OH reactivity (Σk3[VOC + CO]) from the sum of VOC measured by GC and separately, the reactivity
10
from a suite of VOC known to have only anthropogenic sources (not including CO). At both sites, the reactivity from anthropogenic compounds is lowest on the weekend, reflecting lower emissions. Because the weekend reduction in diesel traffic is less im-portant for VOC emissions and because of the importance of biogenic VOC at the two sites, VOC reactivity changes by much less than NOx between weekdays and
week-15
ends at both the urban and rural sites. VOC at the UC-BFRS are dominated by biogenic sources, which have no known day-of-week dependence in emissions, thus the lower concentrations during the week likely reflect more rapid photochemical loss, a subject explored further in the companion paper, Murphy et al. (2006b). The observational data presented in this section show that concentrations of ozone precursors are not
20
higher on the weekend for the Sacramento Valley and Mountain Counties Air Basins, thereby disproving hypothesis (#2).
Total VOC reactivity is similar at the urban and rural sites, likely because the anthro-pogenic urban emissions that are diluted and lost during transport have been replaced by biogenic emissions as the plume is advected upslope. With reference to Fig. 1, this
25
means that a single VOC reactivity curve is qualitatively appropriate to consider O3
pro-duction as NOx varies between Granite Bay and the UC-BFRS. However, between the Sacramento suburbs and the mid-elevation pine forests, there is a significant source of isoprene, which may increase the VOC reactivity at intermediate distances. As shown
ACPD
6, 11427–11464, 2006Weekend effect in Sacramento Part 1
ozone, NOxand VOC
J. G. Murphy et al. Title Page Abstract Introduction Conclusions References Tables Figures ◭ ◮ ◭ ◮ Back Close
Full Screen / Esc
Printer-friendly Version Interactive Discussion
EGU
in Fig. 1, the production of O3 is relatively insensitive to changes in VOC reactivity at the low NOx concentrations encountered in rural areas so this should not have a large
effect on regional ozone.
7 Differences in odd oxygen partitioning
Because of the chemistry described in R1–R4, it is important to separate the effects
5
of interconversion from differences in ozone production rates. By defining odd oxygen as the sum of ozone and nitrogen dioxide (Ox ≡ O3 + NO2), we can isolate changes
in production from differences in partitioning under changing NOx regimes. Figure 11
shows the day-of-week pattern for total odd oxygen at Sacramento Valley sites. The urban sites no longer have significantly higher maximum 8-h averages on the
week-10
ends. The geographic pattern becomes more clear: as the air moves from south to north over the city, emissions of NO are photochemically processed by reaction with O3 and RO2into odd oxygen. Thus the sites in the northeast part of the Sacramento urban area have higher odd oxygen because the emissions of NOxand VOC from the
city have had more time to be processed. The different day-of-week behavior between
15
ozone and odd oxygen suggests that in the Sacramento region, varying degrees of in-terconversion of ozone to NO2by mobile source emissions of NOxmakes an important
contribution to the weekend effect.
The counterpart to Fig. 11 could not be made for the Mountain Counties due to the lack of routine NOx measurements in that region. NO2 at these rural sites is likely to
20
be quite small compared to ozone, and is unlikely to have a large influence on odd oxygen patterns. If the day-of-week trends observed at the UC-BFRS and Big Hill hold throughout the region, the combination of lower NO2and lower ozone on the weekend would result in total odd oxygen minimizing on weekends. This pattern of low O3
as-sociated with low NOx is consistent with the majority of ozone observed in the region
25
being produced under NOx-limited conditions. However, the interconversion of odd oxygen by fresh NOx emissions may still influence ozone observations at sites in the
ACPD
6, 11427–11464, 2006Weekend effect in Sacramento Part 1
ozone, NOxand VOC
J. G. Murphy et al. Title Page Abstract Introduction Conclusions References Tables Figures ◭ ◮ ◭ ◮ Back Close
Full Screen / Esc
Printer-friendly Version Interactive Discussion
EGU
Mountain Counties. With reference to Fig. 2, Colfax and Placerville are closer to the region of efficient ozone production than the respective downwind sites of White Cloud and the UC-BFRS, but the 8-h maximum ozone at the closer sites is actually lower by a few ppb for each pair. Because the Colfax and Placerville monitoring sites are located within 300 m of Interstate 80 and Highway 50 respectively, it is likely that NO2makes
5
a more significant contribution to odd oxygen at those sites. This suggests that mon-itoring sites located near major transportation routes are potentially underestimating the regional abundance of ozone, and should include NO2measurements in order to
capture the true concentration of odd oxygen and guide policy decisions. It should be emphasized that the effect of ozone suppression by NO emissions, while most evident
10
during morning rush hour, is important throughout the day. Lower ozone concentrations can be seen throughout the day in airmasses that were likely not influenced by urban emissions during the morning rush hour. The timescale of ozone production by R4a is hours, whereas the timescale of suppression by R1 is minutes. A significant proportion of the NO observed at urban (or even rural) sites located in close proximity to a major
15
road has had time to suppress the ozone but not to affect its production. Therefore the influence of lower weekend NO emissions on ozone production rates can best be assessed by examining the behavior of odd oxygen throughout the day. This analysis shows that the suppression of ozone by NO emissions (hypothesis #1) is an important factor in the weekend effect in ozone at urban sites in the Sacramento Valley. It likely
20
has an influence on the regional scale as well, and NO2measurements at sites in the
Mountain Counties located close to highways are required to quantify the effect.
8 The role of aerosols in the ozone weekend effect
Marr and Harley (2002a, 2002b) proposed that reduced concentrations of aerosol on weekends may increase ozone production by increasing the availability of UV photons
25
required to initiate HOx production. Aerosols interact with radiation through both ab-sorption and scattering processes. The abab-sorption of UV radiation by aerosols acts
ACPD
6, 11427–11464, 2006Weekend effect in Sacramento Part 1
ozone, NOxand VOC
J. G. Murphy et al. Title Page Abstract Introduction Conclusions References Tables Figures ◭ ◮ ◭ ◮ Back Close
Full Screen / Esc
Printer-friendly Version Interactive Discussion
EGU
to reduce the available number of photons, however scattering aerosol may decrease the photon flux below the aerosol layer while increasing it above. Therefore the ef-fect of aerosols on the availability of UV radiation may be altitude dependent, but the overall effect throughout the column will be negative for absorbing aerosols. Accurate size distributions and single scattering albedo of the aerosol burden are needed for
rig-5
orous calculations of their impact on photolysis frequencies (Wendisch, et al., 1996). In a modeling simulation of the 1987 Southern California Air Quality Study, Jacobson (1998) found that the effect of aerosols on photolysis frequencies depended on the relative importance of scattering and absorption. Qin et al. (2004) found that during a study of the South Coast Air Basin, scattering by PM10 aerosol was between 9–17%
10
lower on the weekend, but no measurements of absorption or the net effect on UV irradiance were made at any altitude.
To properly address the role of aerosols, direct measurements of the day-of-week trends in the wavelength-dependent light absorption and scattering of atmospheric aerosol are necessary, but such detailed measurements are rarely available. In the
15
Sacramento region, summer daytime measurements of PM10 at the Del Paso and T
Street monitoring sites (2001–2003) show a day-of-week pattern, with Sunday con-centrations almost 30% lower than later weekdays (Fig. 12). However, simultaneous observations of light-scattering at Del Paso, in the lower panel, show no significant day-of-week trend. Because radiation effects depend on aerosol size and composition,
20
more specific measurements of aerosol characteristics, or of UV radiation itself, are needed to quantify the importance of the effect. Jacobson (1998) found that a simula-tion of a multi-day ozone episode in Southern California that did not include aerosols predicted surface ozone concentrations which were 5–8% higher than a model run with aerosols. This suggests that a reduction in PM10 of less than 30% will likely affect
sur-25
face ozone by less than 5%. More detailed measurements of aerosol characteristics are required to quantify the influence of aerosol on ozone production and its role in the weekend effect.
ACPD
6, 11427–11464, 2006Weekend effect in Sacramento Part 1
ozone, NOxand VOC
J. G. Murphy et al. Title Page Abstract Introduction Conclusions References Tables Figures ◭ ◮ ◭ ◮ Back Close
Full Screen / Esc
Printer-friendly Version Interactive Discussion
EGU
9 Conclusions
Day-of-week patterns in observations of ozone and its precursors at twelve sites within and downwind of the Sacramento metropolitan area from the summers of 1998–2002 have been investigated. The analysis shows that all six sites in the Sacramento Valley air basin exceed the 8-h standard more frequently on the weekend than on weekdays,
5
whereas all six sites in the more rural Mountain Counties have worse air quality on weekdays. While previous work has identified higher weekend ozone concentrations in urban areas, and lower weekend ozone in some rural areas, this is the first analysis to use a well-characterized urban plume to follow the weekend effect in ozone over sites that differ in NOx abundance by an order of magnitude. At the same time, speciated
10
measurements of VOC and CO at a suburban and rural site demonstrate that the re-activity toward OH changes by less than 30% throughout the urban plume and by less than 10% between weekdays and weekend at both sites. Observations of NOx and anthropogenic VOC confirm that emissions of the dominant anthropogenic precursors to ozone production are not higher on the weekend (hypothesis #2). The important role
15
that biogenic emissions play in the region means that the total VOC reactivity with OH has a negligible (<10%) day-of-week pattern in both counties. Higher weekend bio-genic VOC at the UC-BFRS suggests that the oxidation rate of these VOC is slower on the weekend. Observations of PM10 at two urban monitoring sites showed that lower weekend concentrations could not be directly related to an increase in photolysis
fre-20
quencies for ozone-forming reactions (hypothesis #3). More detailed measurements are required to quantify the role aerosols play in the weekend effect of ozone. We also show that titration by NO emissions can be an important control over the weekend effect in ozone, not only at rush hour, but throughout the day (hypothesis #1). The anal-ysis reveals that sites located within several hundred meters of transportation routes
25
will have significantly depressed ozone concentrations, leading to underestimates of the average regional abundance, if the O3concentrations are extrapolated without
ACPD
6, 11427–11464, 2006Weekend effect in Sacramento Part 1
ozone, NOxand VOC
J. G. Murphy et al. Title Page Abstract Introduction Conclusions References Tables Figures ◭ ◮ ◭ ◮ Back Close
Full Screen / Esc
Printer-friendly Version Interactive Discussion
EGU
stations that are near to NO sources are influenced by chemistry occurring on temporal and spatial scales much finer than the resolution of gridded models used to represent atmospheric photochemistry, and thus should be used with care when comparisons are made.
Because fresh NOxemissions continue throughout the day in the Sacramento region,
5
it was necessary to examine the patterns in total odd oxygen at the sites in the Sacra-mento Valley. By comparing day-of-week patterns in odd oxygen to those in ozone, we showed that titration by NO is the main source of a weekend effect in ozone at the urban and suburban sites. Titration at CARB sites in the Mountain Counties is difficult to assess in the absence of NOx measurements, but clearly does not dominate the
10
day-of-week trends because it would produce the opposite behavior to that observed. In the companion to this paper, Murphy et al. (2006b), we use the day-of-week pat-terns to investigate the final four hypotheses related to the complex interplay between photochemistry and transport in the Sacramento region and downwind. Odd oxygen increases as the air moves from south to north over the city and has similar
week-15
day and weekend concentrations despite changes in NOx abundance of ∼35%. The
lack of sensitivity of odd oxygen to changing NOx emissions in the Sacramento Val-ley suggests that the majority of ozone production in this region occurs close to the crossover between NOx-limited and NOx-saturated ozone production. Sites located
near the interface of the two air basins had the highest maximum 8-h average ozone
20
concentrations, and thus regions just upwind of these sites likely have rapid ozone pro-duction. We use speciated VOC and reactive nitrogen oxide measurements in the re-gion to constrain the HOxphotochemistry and ozone production and their dependence on NOx in a more quantitative fashion and strengthening the mechanistic support for
the conclusions described above.
25
Acknowledgements. The analysis presented here was primarily supported by NSF
ATM-0138669. We gratefully acknowledge that support and the U.S. Department of Energy sup-port for measurements at Granite Bay under contract AC03-76SF0009. Observations at UC-BFRS were supported by NSF ATM-0138669 (Cohen) and ATM-0443448 (Goldstein). We
ACPD
6, 11427–11464, 2006Weekend effect in Sacramento Part 1
ozone, NOxand VOC
J. G. Murphy et al. Title Page Abstract Introduction Conclusions References Tables Figures ◭ ◮ ◭ ◮ Back Close
Full Screen / Esc
Printer-friendly Version Interactive Discussion
EGU thank M. McKay and G. Schade for assistance with meteorological, ozone, and VOC data
from UC-BFRS. Measurements at Big Hill were made in collaboration with the California Air Resources Board under Contract No. 01-327. We are grateful to the Eureka Union School District, Sierra Pacific Industries, and the United States Forest Service for the use of the sites.
References
5
D. o. Finance, Revised Historical City, County and State Population Estimates, 1991–2000, with 1990 and 2000 Census Counts., State of California, 2002.
Altshuler, S. L., Arcado, T. D., and Lawson, D. R.: Weekday vs weekend ambient ozone con-centrations - discussion and hypotheses with focus on Northern California, J. Air Waste Manage., 45, 967–972, 1995.
10
Ashworth, J. R.: The influence of smoke and hot gases from factory chimneys on rainfall, Q. J. Roy. Meteorol. Soc., 55, 841–850, 1929.
Bauer, M. R., Hultman, N. E., Panek, J. A., and Goldstein, A. H.: Ozone deposition to a pon-derosa pine plantation in the Sierra Nevada Mountains (CA): A comparison of two differ-ent climatic years, J. Geophys. Res.-Atmos., 105(D17), 22123, doi:10.1029/2000JD900168, 15
2000.
Beirle, S., Platt, U., Wenig, M., and Wagner, T.: Weekly cycle of NO2by GOME measurements: a signature of anthropogenic sources, Atmos. Chem. Phys., 3, 2225–2232, 2003.
Blanchard, C. L. and Fairley, D.: Spatial mapping of VOC and NOx-limitation of ozone formation in central California, Atmos. Env., 35, 3861–3873, 2001.
20
Blanchard, C. L. and Tanenbaum, S. J.: Differences between weekday and weekend air pollu-tant levels in southern California, J. Air Waste Manage. Assoc., 53, 816–828, 2003.
Bronnimann, S. and Neu, U.: Weekend-weekday differences of near-surface ozone concen-trations in Switzerland for different meteorological conditions, Atmos. Env., 31, 1127–1135, 1997.
25
California Air Resources Board (2003), The Ozone Weekend Effect in California, pp, CARB Planning and Technical Support Division, Sacramento.
California Air Resources Board Air Quality Database,http://www.arb.ca.gov/aqd/aqdpage. Carroll, J. J. and Dixon, A. J.: Regional scale transport over complex terrain, a case study:
ACPD
6, 11427–11464, 2006Weekend effect in Sacramento Part 1
ozone, NOxand VOC
J. G. Murphy et al. Title Page Abstract Introduction Conclusions References Tables Figures ◭ ◮ ◭ ◮ Back Close
Full Screen / Esc
Printer-friendly Version Interactive Discussion
EGU tracing the Sacramento plume in the Sierra Nevada of California, Atmos. Env., 36,
3745-3758, 2002.
Cleary, P. A., Wooldridge, P. J., and Cohen, R. C.: Laser-induced fluorescence detection of atmospheric NO2with a commercial diode laser and a supersonic expansion, Appl. Opt., 41, 6950–6956, 2002.
5
Cleary, P. A., Murphy, J. G., Wooldridge, P. J., Day, D. A., Millet, D. B., Goldstein, A. H., and Cohen, R. C.: Observations of total alkyl nitrates within the Sacramento urban plume, Atmos. Chem. Phys. Discuss., 5, 4801–4843, 2005.
Cleveland, W. S., Graedel, T. E., Kleiner, B. and Warner, J. L.: Sunday And workday variations in photochemical air pollutants in New-Jersey and New-York, Science, 186, 1037–1038, 10
1974.
Cleveland, W. S. and McRae, J. E.: Weekday-weekend ozone concentrations in Northeast United-States, Env. Sci. Tech., 12, 558–563, 1978.
Day, D. A., Wooldridge, P. J., Dillon, M. B., Thornton, J. A., and Cohen, R. C.: A thermal dissoci-ation laser-induced fluorescence instrument for in situ detection of NO2, peroxy nitrates, alkyl 15
nitrates, and HNO3, J. Geophys. Res.-Atmos., 107(D6), 4046, doi:10.1029/2001JD000779, 2002.
Day, D. A.: Observations of NO2, total peroxynitrates, total alkyl nitrates, and HNO3in the mid-Sierras and Sacramento plume using Thermal Dissociation – Laser Induced Fluorescence, University of California, 207 pages, 2003.
20
Dillon, M. B., Lamanna, M. S., Schade, G. W., Goldstein, A. H., and Cohen, R. C.: Chemical evolution of the Sacramento urban plume: Transport and oxidation, J. Geophys. Res.-Atmos., 107(D5), 4045, doi:10.1029/2001JD000969, 2002.
Elkus, B. and Wilson, K. R.: Photochemical air pollution - Weekend weekday differences, At-mos. Env., 11, 509–515, 1977.
25
Fitz, D. R.: Evaluation of NOyand Nitric Acid Measurement Methods and Collection of Ambient Data, California Air Resources Board, 2002.
Fujita, E. M., Stockwell, W. R., Campbell, D. E., Keislar, R. E., and Lawson, D. R.: Evolution of the magnitude and spatial extent of the weekend ozone effect in California’s South Coast Air Basin, 1981–2000, J. Air Waste Manage., 53, 802–815, 2003.
30
Gordon, A. H.: Weekdays Warmer Than Weekends, Nature, 367, 325–326, 1994.
Harley, R. A., Marr, L. C., Lehner, J. K., and Giddings, S. N.: Changes in motor vehicle emis-sions on diurnal to decadal time scales and effects on atmospheric composition, Env. Sci.
ACPD
6, 11427–11464, 2006Weekend effect in Sacramento Part 1
ozone, NOxand VOC
J. G. Murphy et al. Title Page Abstract Introduction Conclusions References Tables Figures ◭ ◮ ◭ ◮ Back Close
Full Screen / Esc
Printer-friendly Version Interactive Discussion
EGU Tech., 39, 5356–5362, 2005.
Heard, D. E. and Pilling, M. J.: Measurement of OH and HO2in the troposphere, Chem. Rev., 103, 5163–5198, 2003.
Heuss, J. M., Kahlbaum, D. F. and Wolff, G. T.: Weekday/weekend ozone differences: What can we learn from them?, J. Air Waste Manage. Assoc., 53, 772–788, 2003.
5
Husar, R. B.: Seasonal and Weekly Pattern of Ozone over the OTAG Region, paper presented at Air and Waste Management Association’s 90th Annual Meeting & Exhibition, 1998. Jacobson, J. S.: Comparison of Weekend-Weekday Ozone and Hydrocarbon Concentrations
in Baltimore-Washington Metropolitan Area, Atmos. Env., 9, 1040–1040, 1975.
Jacobson, M. Z.: Studying the effects of aerosols on vertical photolysis rate coefficient and 10
temperature profiles over an urban airshed, J. Geophys. Res.-Atmos., 103, 10 593–10 604, 1998.
Jimenez, P., Parra, R., Gasso, S., and Baldasano, J. M.: Modeling the ozone weekend effect in very complex terrains: a case study in the Northeastern Iberian Peninsula, Atmos. Env., 39, 429–444, 2005.
15
Karl, T. R.: Day of Week Variations of Photo-Chemical Pollutants in St-Louis Area, Atmos. Env., 12, 1657–1667, 1978.
Lamanna, M. S. and Goldstein, A. H.: In situ measurements of C2-C10 volatile organic compounds above a Sierra Nevada ponderosa pine plantation, J. Geophys. Res.-Atmos., 104(D17), 21247, doi:10.1029/1999JD900289, 1999.
20
Marr, L. C. and Harley, R. A.: Modeling the effect of weekday-weekend differences in motor vehicle emissions on photochemical air pollution in central California, Env. Sci. Tech., 36, 4099–4106, 2002a.
Marr, L. C. and Harley, R. A.: Spectral analysis of weekday-weekend differences in ambient ozone, nitrogen oxide, and non-methane hydrocarbon time series in California, Atmos. Env., 25
36, 2327–2335, 2002b.
National Research Council, Air Quality Management in the United States, The National Academies Press, 2004.
Paschalidou, A. K. and Kassomenos, P. A.: Comparison of air pollutant concentrations between weekdays and weekends in Athens, Greece for various meteorological conditions, Environ. 30
Technol., 25, 1241–1255, 2004.
Pont, V. and Fontan, J.: Comparison between weekend and weekday ozone concentration in large cities in France, Atmos. Env., 35, 1527–1535, 2001.
ACPD
6, 11427–11464, 2006Weekend effect in Sacramento Part 1
ozone, NOxand VOC
J. G. Murphy et al. Title Page Abstract Introduction Conclusions References Tables Figures ◭ ◮ ◭ ◮ Back Close
Full Screen / Esc
Printer-friendly Version Interactive Discussion
EGU Pryor, S. C. and Steyn, D. G.: Hebdomadal and Diurnal Cycles in Ozone Time-Series From the
Lower Fraser Valley, BC, Atmos. Env., 29, 1007–1019, 1995.
Pun, B. K., Seigneur, C., and White, W.: Day-of-week behavior of atmospheric ozone in three US cities, J. Air Waste Manage. Assoc., 53, 789–801, 2003.
Qin, Y., Tonnesen, G. S., and Wang, Z.: Weekend/weekday differences of ozone, NOx, CO,
5
VOCs, PM10and the light scatter during ozone season in southern California, Atmos. Env., 38, 3069–3087, 2004.
Rubin, J. I., Kean, A. J., Harley, R. A., Millet, D. B., and Goldstein, A. H.: Temperature depen-dence of volatile organic compound evaporative emissions from motor vehicles, J. Geophys. Res.-Atmos., 111, D03305, doi:10.1029/2005JD006458, 2006.
10
Sillman, S.: The Use Of NOy, H2O2, And HNO3 As Indicators For Ozone-NOx-Hydrocarbon Sensitivity In Urban Locations, J. Geophys. Res.-Atmos., 100, 14 175–14 188, 1995.
Vukovich, F. M.: The spatial variation of the weekday/weekend differences in the Baltimore area, J. Air Waste Manage., 50, 2067–2072, 2000.
Vukovich, F. M. and Scarborough, J.: 15-year simulation of ozone in Baltimore using SIPM, 15
Atmos. Environ., 38, 4825–4837, 2004.
Wendisch, M., Mertes, S., Ruggaber, A., and Nakajima, T.: Vertical profiles of aerosol and radiation and the influence of a temperature inversion: Measurements and radiative transfer calculations, J. Appl. Meteorol., 35, 1703–1715, 1996.
Winer, A. M., Peters, J. W., Smith, J. P., and Pitts, J. N.: Response Of Commercial Chemilu-20
minescent NO-NO2Analyzers To Other Nitrogen-Containing Compounds, Env. Sci. Tech., 8, 1118–1121, 1974.
Yarwood, G., Stoeckenius, T. E., Heiken, J. G., and Dunker, A. M.: Modeling weekday/weekend Los Angeles region for 1997, J. Air Waste Manage., 53, 864–875, 2003.
Zaremba, L. L. and Carroll, J. J.: Summer wind flow regimes over the Sacramento Valley, J. 25
Appl. Meteorol., 38, 1463–1473, 1999.
Zhong, S. Y., Whiteman, C. D., and Bian, X. D.: Diurnal evolution of three-dimensional wind and temperature structure in California’s Central Valley, J. Appl. Meteorol., 43, 1679–1699, 2004.
ACPD
6, 11427–11464, 2006Weekend effect in Sacramento Part 1
ozone, NOxand VOC
J. G. Murphy et al. Title Page Abstract Introduction Conclusions References Tables Figures ◭ ◮ ◭ ◮ Back Close
Full Screen / Esc
Printer-friendly Version Interactive Discussion
EGU
Fig. 1. The dependence of the ozone production rate P(O3) on the abundance of nitrogen oxides (NOx) at three different VOC reactivities. As the VOC reactivity is increased, the con-centration at which O3production becomes NOx-saturated is higher. Increasing VOC reactivity increases O3 production where NOx is high but has a small effect when production is NOx
-limited. The exact quantities obtained depend on the production and loss rates of HOx which for this calculation are set to 2.25 ppb h−1 (a reasonable value based on production from the
ACPD
6, 11427–11464, 2006Weekend effect in Sacramento Part 1
ozone, NOxand VOC
J. G. Murphy et al. Title Page Abstract Introduction Conclusions References Tables Figures ◭ ◮ ◭ ◮ Back Close
Full Screen / Esc
Printer-friendly Version Interactive Discussion
EGU
Fig. 2. The location of the monitoring sites in the Sacramento Valley and Mountain Counties
(separated by the dashed line) used in this analysis. The light grey shaded area represents to Sacramento municipal area, and the dark grey area to its northeast is a California State Park.
ACPD
6, 11427–11464, 2006Weekend effect in Sacramento Part 1
ozone, NOxand VOC
J. G. Murphy et al. Title Page Abstract Introduction Conclusions References Tables Figures ◭ ◮ ◭ ◮ Back Close
Full Screen / Esc
Printer-friendly Version Interactive Discussion
EGU
(a)
(b)
Fig. 3. 8-h maximum air quality statistic (3 year average of 4th highest value) for the individual
sites in (a) the Sacramento Valley and (b) the Mountain Counties. The top of the grey area is the basin-wide statistic of the 4th highest values calculated by finding the highest 8-h maximum each day from any site in the basin.
ACPD
6, 11427–11464, 2006Weekend effect in Sacramento Part 1
ozone, NOxand VOC
J. G. Murphy et al. Title Page Abstract Introduction Conclusions References Tables Figures ◭ ◮ ◭ ◮ Back Close
Full Screen / Esc
Printer-friendly Version Interactive Discussion
EGU
Fig. 4. Predominant meteorological regime that persists in Central California during the
sum-mer months with daytime upslope flow (white arrows) and nighttime downslope flow (black arrows). The dotted outline represents the area of interest shown in Fig. 2.
ACPD
6, 11427–11464, 2006Weekend effect in Sacramento Part 1
ozone, NOxand VOC
J. G. Murphy et al. Title Page Abstract Introduction Conclusions References Tables Figures ◭ ◮ ◭ ◮ Back Close
Full Screen / Esc
Printer-friendly Version Interactive Discussion
EGU
Fig. 5. Wind roses depicting the frequency of observed daytime (10:00-18:00, black) and
nighttime (22:00-06:00, grey) wind direction (rings are spaced by 5% with the outer ring repre-senting 30% of the observations. (a–e) are sites in the Sacramento Valley and (f–i) are sites in the Mountain Counties.
ACPD
6, 11427–11464, 2006Weekend effect in Sacramento Part 1
ozone, NOxand VOC
J. G. Murphy et al. Title Page Abstract Introduction Conclusions References Tables Figures ◭ ◮ ◭ ◮ Back Close
Full Screen / Esc
Printer-friendly Version Interactive Discussion
EGU
Fig. 6. Percent of days on weekends (Sat–Sun) or weekdays (Mon–Fri) for which a particular
site exceeded the federal 8-h ozone standard for May–October 1998–2002. The six sites on the left are located in the SV while the six sites on the right are in the MC.