HAL Id: hal-03206395
https://hal.archives-ouvertes.fr/hal-03206395
Submitted on 23 Apr 2021
HAL is a multi-disciplinary open access
archive for the deposit and dissemination of
sci-entific research documents, whether they are
pub-lished or not. The documents may come from
teaching and research institutions in France or
abroad, or from public or private research centers.
L’archive ouverte pluridisciplinaire HAL, est
destinée au dépôt et à la diffusion de documents
scientifiques de niveau recherche, publiés ou non,
émanant des établissements d’enseignement et de
recherche français ou étrangers, des laboratoires
publics ou privés.
U–Pb dating
Louise Lenoir, Thomas Blaise, Andréa Somogyi, Benjamin Brigaud, Jocelyn
Barbarand, Claire Boukari, Julius Nouet, Aurore Brézard-Oudot, Maurice
Pagel
To cite this version:
Louise Lenoir, Thomas Blaise, Andréa Somogyi, Benjamin Brigaud, Jocelyn Barbarand, et al..
Ura-nium incorporation in fluorite and exploration of U–Pb dating. Geochronology, Copernicus
Publica-tions, 2021, 3 (1), pp.199-227. �10.5194/gchron-3-199-2021�. �hal-03206395�
https://doi.org/10.5194/gchron-3-199-2021 © Author(s) 2021. This work is distributed under the Creative Commons Attribution 4.0 License.
Uranium incorporation in fluorite and exploration of U–Pb dating
Louise Lenoir1, Thomas Blaise1, Andréa Somogyi2, Benjamin Brigaud1, Jocelyn Barbarand1, Claire Boukari1,
Julius Nouet1, Aurore Brézard-Oudot3, and Maurice Pagel1 1CNRS, GEOPS, Université Paris-Saclay, Orsay, 91405, France
2Synchrotron SOLEIL, Université Paris-Saclay, Saint-Aubin, 91190, France 3CNRS, CentraleSupélec, Group of Electrical Engineering Paris (GeePs),
Université Paris-Saclay, Gif-sur-Yvette, 91192, France
Correspondence:Louise Lenoir ([email protected])
Received: 15 October 2020 – Discussion started: 24 November 2020
Revised: 15 February 2021 – Accepted: 25 February 2021 – Published: 19 April 2021
Abstract.The age of ore deposits constitutes a decisive el-ement in understanding their formation. Deciphering their precise chronology may be a challenge in the absence of min-eral phases that can be dated by conventional geochronome-ters. Fluorite is very common either as the major or acces-sory mineral in a wide variety of ores and may provide in-formation regarding the origin and timing of mineralizing fluid flows. In this contribution, we explore U–Pb dating on fluorite crystals from the world-class carbonate strata-bound fluorite ore of Pierre-Perthuis in Burgundy (Morvan massif, France). The uranium distribution within fluorite is mapped using induced fission-track and synchrotron radiation X-ray fluorescence nano-imaging, showing that higher U content is measured in an overgrowth of fluorite (Flog) as a discrete
band. Preservation of a micrometer-thick zonation in U, as-sociated with other substituted elements such as Sr, Y, Fe and Zr, implies that neither solid-state diffusion nor dissolution– recrystallization occurred. These U-bearing external fluorite overgrowths contain solid inclusions of about 30 µm globu-lar pyrite crystals with a mean δ34S of −23.6 ± 0.4 ‰V-CDT.
We propose that the U incorporation in the fluorite lattice re-sults from the development of a redox front during bacterial sulfate reduction. Flog generation sampled and analyzed by
laser ablation–inductively coupled plasma mass spectrome-try (LA-ICP-MS) on four different crystals provides identical U–Pb ages within the limits of analytical uncertainty. Con-sidered altogether, these four crystals yield an age estimate of 40.0 ± 1.7 Ma, not corrected for matrix-related elemen-tal fractionation. Our results show that fluorite LA-ICP-MS U–Pb geochronology has potential for dating distinct crystal
growth stages, although further research should be conducted to evaluate its accuracy.
1 Introduction
Sedimentary rocks lying unconformably on a crystalline basement may host large concentrations of authigenic F, Ba, Pb, Zn and U minerals that are of economic interest (Boiron et al., 2002; Gigon et al., 2020; Gigoux et al., 2015; Leach et al., 2005; Sizaret, 2006). These unconformity-related de-posits are usually the result of multiple episodes of fluid flow, inducing mineral dissolution–recrystallization, remobiliza-tion and precipitaremobiliza-tion (Chi et al., 2018; Walter et al., 2018). Knowing the timing of these successive fluid flow events is essential for building robust genetic models for mineral de-posits. Fluorite, one of the 27 raw materials defined as cru-cial for the economy of the European Union (European Com-mission, 2017), commonly occurs in mineral assemblages in veins or strata-bound deposits. Fluorite Sm–Nd geochronol-ogy (Chesley et al., 1991; Galindo et al., 1994; Dill et al., 2011) might help to reconstruct the geological scenario that led to the mineral deposition, together with other direct ra-diometric dating of authigenic phases, either by bulk disso-lution, e.g., Rb–Sr on sphalerite (Nakai et al., 1993), Re–Os on molybdenite (Markey et al., 1998; Stein et al., 2001) and Re–Os on pyrite (Cardon, 2007; Mathur et al., 2000), or by in situ sampling and analysis, e.g., Ar–Ar on adularia (Cathe-lineau et al., 2012; Mark et al., 2005), Ar–Ar on Mn oxides (Deng and Li, 2017) or U–Pb on uraninite (Alexandre et al., 2009; Martz et al., 2019).
However, it is common that fluorite Sm–Nd geochronol-ogy produces errorchrons, and additionally, when the age es-timation is considered geologically consistent, results may be unreliable due to poor analytical precision. Moreover, it is sometimes difficult to interpret Sm–Nd ages when they are obtained from the bulk dissolution of a crystal fragment that may be composed of several growth stages. To overcome these issues, a non-radiometric method based on the acquisi-tion of chemical remnant magnetizaacquisi-tion in fluorite has been developed and employed to date fluorite deposits in areas where the geodynamic evolution and the apparent polar wan-der path are well documented (Kawasaki and Symons, 2008; Symons, 1994; Symons et al., 2017). Along with other ele-ments, fluorite accepts the incorporation of U and Pb in its crystal lattice in substitution for Ca2+(typically at low con-centrations from a few parts per million to a few per mill; Piccione et al., 2019). As a result, fission-track (Grønlie et al., 1990) and (U–Th) / He (Evans et al., 2005; Wolff et al., 2015) thermochronology have been tested in fluorite. Wolff et al. (2016) show that He diffusion in fluorite varies depend-ing on elemental substitution in the crystal lattice.
In recent years, in situ U–Pb geochronology has been suc-cessfully applied to a growing number of mineral matri-ces, including calcite and dolomite (Burisch et al., 2017), hematite (Walter et al., 2018), opal (Nuriel et al., 2019), cassiterite (Moscati and Neymark, 2020), Mn-rich chryso-colla and pseudomalachite (Kahou et al., 2020), epidote (Peverelli et al., 2021), and nacrite and fluorite (Piccione et al., 2019). Piccione et al. (2019) reported for the first time laser ablation–inductively coupled plasma mass spectrome-try (LA-ICP-MS) U–Pb ages acquired on fluorite that are consistent with those of adjacent nacrite crystals, showing that fluorite U–Pb geochronology can constrain the timing of fluid flows and provide favorable U / Pb. However, the incor-poration and retention of U and Pb in the crystal structure of CaF2 are very poorly documented, hence currently limiting
the reliability of fluorite U–Pb dating. Moreover, compared to other common Pb-bearing minerals, fluorite sampling by laser ablation presents some additional analytical challenges, such as laser-induced damage (De Bonis et al., 2014; Jia et al., 2005; Rafique et al., 2012) and ejection of solid fragments causing variable ablation rates (Gogoll et al., 1996).
The aim of this study is to examine the spatial distribution of U and Pb and to further explore small-scale LA-ICP-MS U–Pb geochronology in fluorite crystals. The unconformity-related F–Ba ore in Pierre-Perthuis (Morvan massif, France) was chosen as a case study. This ore has been investigated in previous studies (Gigoux et al., 2015, 2016), and a generation of macroscopic geodic fluorite has been dated at 130 ± 15 Ma by Sm–Nd geochronology (Gigoux et al., 2015). As in many other F–Ba deposits, the most commonly used geochronome-ters are lacking in Pierre-Perthuis, making it an interest-ing target to gain knowledge on fluorite precipitation ages through fluorite U–Pb dating. Through the use of various petro-geochemical investigations involving multiple
analyti-cal methods, including induced fission-track mapping, syn-chrotron radiation X-ray fluorescence nano-imaging, sec-ondary ion mass spectrometry and LA-ICP-MS, this paper will address the following questions.
– How are U and Pb spatially distributed within micrometer-thick fluorite growth bands?
– How is U incorporated in fluorite?
– Are U and Pb effectively retained in fluorite?
– Can we use fluorite U–Pb geochronology to gain knowl-edge of the chronology of fluid flows?
2 Geological setting
The studied area is located at the unconformity between the Paris Basin and the French Massif Central (FMC), about 200 km southeast of Paris. The Paris Basin is an intracratonic sedimentary basin that formed above Cadomian and Variscan basement rocks (Guillocheau, 2000). The FMC was struc-tured during the Variscan orogeny (Lardeaux et al., 2014; Vialette, 1973). The northern edge of the FMC corresponds to the Morvan massif made up mostly of granitic rocks em-placed during the early and late Carboniferous (Lardeaux et al., 2014; Vialette, 1973). The northern Morvan base-ment is composed of three granitic units (namely Avallon, Lormes and Les Settons) and a metamorphic unit (lower gneiss unit). The Pierre-Perthuis ore is spatially related to an unconformity between the Avallon granite basement and the Late Triassic sediments on the northwestern part of the Morvan massif (Fig. 1a). Two main geological units crop out at Pierre-Perthuis: (1) the Avallon two-mica granite, which shows a weathered zone of about 0.5 to 3 m thickness at its top; and (2) 4 to 8 m of silicified dolostone that corresponds to the Assise de Chitry Formation (Fm), a Carnian–Norian dolomite formation (235–208 Ma) silicified after the deposi-tion (Fig. 1b). The main fluorite mineralizadeposi-tion forms euhe-dral (cubic habits) fluorite crystals dispersed within the sili-cified dolomite rock. A second occurrence forms centimeter cubic fluorite in geodic cavities that crystallized under a rel-atively narrow temperature range of 80–100◦C (Gigoux et al., 2016). Both fluorite mineralizations are complemented by two barite stages (an early small blade-shaped barite stage and a late fan-shaped pink barite stage), three quartz stages (a microcrystalline stage responsible for the silicification of the Assise de Chitry Fm co-precipitated with chalcopyrite, followed by a quartz fringe stage and a late granular stage) and at least four sulfide stages.
3 Materials and methods
3.1 Sampling strategy
The Pierre-Perthuis district is composed of three areas: (1) Bois Dampierre, (2) Bois de l’Epenay and (3) La roche
Figure 1.(a) Geological map of the Morvan massif with the location of the strata-bound fluorite ore of Pierre-Perthuis (modified according to the 1 : 1 000 000 geological map, BRGM) and its (b) stratigraphic log modified according to Soulé de Lafont and Lhégu (1980).
percée (Fig. 2a). All samples were collected at the Pierre-Perthuis ore from outcropping rocks in the weathered granite (Fig. 2b) close to the sedimentary cover and are summarized in Table 1.
3.2 Petrographic observations
Polished thin sections were investigated with optical mi-croscopy in transmitted and reflected light, as well as un-der cathodoluminescence (CL) equipment composed of a BX41 microscope coupled to a cold cathode from NewTec operating at 12 kV and 200–300 µA and a Qicam Fast 1394 digital camera. More details about the cathodoluminescence activators and inhibitors in fluorite can be found in Baele et al. (2012) and Kempe et al. (2002). Uncoated polished thin sections were also imaged and analyzed by scanning electron microscopy (SEM, Phenom X Pro) using a charge compensation sample holder in backscattered electron mode (BSE). Images were produced at an acceleration voltage of 15 keV. Semi-quantitative elemental compositions were mea-sured through energy-dispersive X-ray spectrometry (EDS) at an acceleration voltage of 15 keV and an accumulation time of 30 s.
3.3 Uranium distribution mapping
To map the U distribution in fluorite crystals of the Pierre-Perthuis ore, the fission-track cartography based on the in-duced fission of 235U was carried out using the external detector method (Gleadow, 1981). Fluorite crystals were mounted in an epoxy resin and polished. Polished sec-tions were covered by muscovite detectors in close con-tact and irradiated in the Research Neutron Source Heinz Maier-Leibnitz (FRM II) at the Technical University of Mu-nich (Garching, Germany). Thermal neutron fluence was 1 × 10¹⁶neutrons cm−2. Track densities are calibrated using the standard reference glass CN5 with a total U concentration of 12.17 ppm. After irradiation, the external detectors were detached and etched in 48 % HF at 20 ± 1◦C for 20 min. In-duced fission tracks revealed on detectors were observed and counted using a Leica DMLM optical microscope in trans-mitted light with 1000× magnification.
The correction factor for U concentration between a stan-dard and any unknown geological material depends on the range of latent track lengths and the density of materials (Enkelmann et al., 2005). The latent track lengths of fission particles (2R) in fluorite have been simulated using SRIM® software (Ziegler et al., 2010). Numerical data employed and
Figure 2.(a) Location of the mineralized outcrops at Pierre-Perthuis and (b) a W–E geological profile localized on the geological map by the red line, modified according to the 1 : 50 000 geological map of Avallon (Horon et al., 1966; Gigoux et al., 2016; Soulé de Lafont and Lhégu, 1980).
results of these simulations are summarized in Table A1. The calculated correction factor (Fcorr) for U concentration in
flu-orite is 0.866.
3.4 Scanning synchrotron radiation X-ray fluorescence nano-imaging
Fluorite crystals were mounted in an epoxy resin, polished on both sides to a thickness of 100 µm and cut into 5 mm edge squares. These mounts were fixed on Teflon rings and positioned perpendicular to the incoming X-ray beam.
Seven fluorite samples were scanned by synchrotron radi-ation X-ray fluorescence (SR-XRF) using the Nanoscopium hard X-ray nanoprobe beamline (Bergamaschi et al., 2017; Somogyi et al., 2015) of synchrotron SOLEIL (Université Paris-Saclay, Saint Aubin, France). Elemental distribution mapping was acquired from these polished sections in
differ-ent areas at a spatial resolution varying from 50 nm to 1 µm and with an integration time per pixel varying from 150 to 20 ms. The 18 keV monochromatic X-ray beam was focused on the crystal samples by a Kirckpatrick–Baez nano-focusing mirror. This excitation energy of 18 keV was chosen farther away from the U-L3absorption edge (17.168 keV) in order
to avoid overlapping the U-L3X-ray lines and the Compton
scattering peak of the incident X-ray beam from the sample. This allows the optimization of the analytical sensitivity of U due to the reduced spectral background below the U-L3
lines. To obtain nanometer-scale resolution elemental maps on square-millimeter-sized samples, a fast continuous scan-ning technique (FLYSCAN) has been employed (Lanzirotti et al., 2010; Medjoubi et al., 2013). Full XRF spectra were collected at each pixel of the scans by two silicon drift detec-tors of 50 mm2 useful area (KETEK H50, KETEK GmbH) with XMAP (XIA LLC) fast digital multichannel analyzer
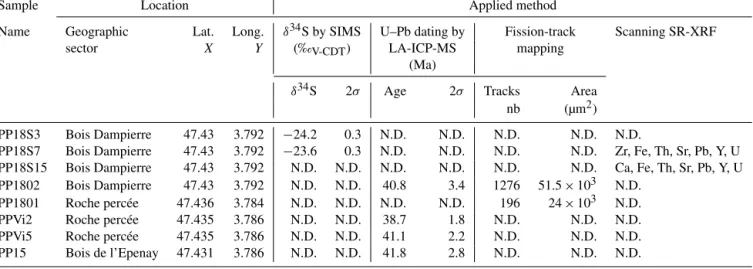
Table 1.Sample location, sulfur stable isotopic composition of pyrite, fluorite U–Pb age, fission track and scanning SR-XRF of fluorite (N.D. – not determined).
Sample Location Applied method
Name Geographic Lat. Long. δ34S by SIMS U–Pb dating by Fission-track Scanning SR-XRF sector X Y (‰V-CDT) LA-ICP-MS mapping
(Ma)
δ34S 2σ Age 2σ Tracks Area nb (µm2) PP18S3 Bois Dampierre 47.43 3.792 −24.2 0.3 N.D. N.D. N.D. N.D. N.D.
PP18S7 Bois Dampierre 47.43 3.792 −23.6 0.3 N.D. N.D. N.D. N.D. Zr, Fe, Th, Sr, Pb, Y, U PP18S15 Bois Dampierre 47.43 3.792 N.D. N.D. N.D. N.D. N.D. N.D. Ca, Fe, Th, Sr, Pb, Y, U PP1802 Bois Dampierre 47.43 3.792 N.D. N.D. 40.8 3.4 1276 51.5 × 10³ N.D.
PP1801 Roche percée 47.436 3.784 N.D. N.D. N.D. N.D. 196 24 × 103 N.D. PPVi2 Roche percée 47.435 3.786 N.D. N.D. 38.7 1.8 N.D. N.D. N.D. PPVi5 Roche percée 47.435 3.786 N.D. N.D. 41.1 2.2 N.D. N.D. N.D. PP15 Bois de l’Epenay 47.431 3.786 N.D. N.D. 41.8 2.8 N.D. N.D. N.D.
cards. The XRF detectors were placed at 20◦relative to the sample surface (Somogyi et al., 2015).
The high-resolution scans consisted of 100 000–300 000 individual XRF spectra corresponding to an XRF spectrum at each image pixel. In order to treat this dataset, as a first step we used the XRF sum spectrum of the entire scanned area to identify the main elements present. The distribution maps of these elements were reconstructed by an in-house MATLAB®code. Because the scanned areas sometimes in-cluded different mineral matrices (fluorite and pyrite) or suc-cessive growth bands of distinct chemical composition in the same mineral, sub-zones were defined by the MATLAB® code from the elemental distribution maps in order to extract the average XRF spectrum corresponding exclusively to the targeted mineral matrix or growth band. These sub-zones, or regions of interest (ROIs), were selected by using ImageJ® software (Schneider et al., 2012). The mean XRF spectra of the ROIs were fitted using PyMCA® software (Solé et al., 2007). This allowed us to identify additional elements present only in tiny areas or in small quantities (e.g., Th) and as such not detectable in the sum spectrum of the whole sam-ple area. As a second step, the elemental distribution maps of all the identified elements were reconstructed by correct-ing for spectral overlaps dependcorrect-ing on the intensity ratios of the X-ray lines. The depth of information specific to each element included in the present paper is documented in Ta-ble A3.
3.5 Sulfur stable isotope composition of pyrite
Sulfur isotopes were measured by secondary ion mass spectrometry (SIMS) using a multi-collector CAMECA IMS1270 E7 microprobe at the Centre de Recherches Pétro-graphiques et Géochimiques (CRPG, Université de Lor-raine and CNRS) in Nancy (France). Samples that were
already prepared for synchrotron XRF spectromicroscopy were reused. They were glued on a glass slide, then coated with a layer of 30 nm of Au. To accurately locate the SIMS analysis, petrographic observations using reflected light mi-croscopy were carried out before and after gold plating. Pyrite inclusions in fluorite were sputtered with a 10 kV Cs+ primary ion beam with a current of 2.7 nA. A normal-incidence electron gun was used for charge compensation.
32S− and 34S− secondary ions were detected in
multi-collection mode using two Faraday cups. Samples were pre-sputtered for 120 s with a beam raster of 20 × 20 µm prior to signal acquisition to minimize surface contamination. Faraday cup backgrounds were measured during the pre-sputtering before each analysis and then used for correcting the data. Typical count rates of32S−and34S−were 4.8 × 10⁸ and 2 × 10⁷counts per second (cps), respectively, during 30 cycles of 4.96 s acquisition time. The spot size was about 15 µm in diameter. A nominal mass resolution (M/1M) of 4998 was used to resolve interference with hydrides.
A Sierra pyrite sample was used as an internal matrix-match standard to correct the sulfur isotopic ratio. Data were integrated as a32S /34S ratio (δ34S in ‰) and referenced to the Vienna-Canyon Diablo Troilite (V-CDT) scale (Ding et al., 2001). Homogeneity of the Sierra pyrite has been docu-mented by LaFlamme et al. (2016) with three analytical tech-niques (EPMA: electron probe micro analysis, wavelength-dispersive X-ray spectroscopy maps and SEM-BSE) and its δ34S measured by fluorination gas-source mass spec-trometry at 2.17 ± 0.08 ‰V-CDT. Measurements were
car-ried out through daily sequences consisting of five analy-ses of matrix-match reference material followed by spots on unknown samples. For the first session, Sierra pyrite was measured at 0.94 ± 0.02 ‰V-CDTand at 0.92 ± 0.02 ‰V-CDT
for the second analytical session. Instrumental mass frac-tionation (IMF) for34S−/32S− was quantified during each
analytical session using all the replicated analyses of the matrix-match standard. During the first session the IMF was −1.23 ± 0.34 ‰V-CDTand −1.25 ± 0.28 ‰V-CDTfor the
sec-ond. Final uncertainties are reported at a 95 % confidence level (2σ ), propagating the systematic uncertainty of the primary reference material Sierra pyrite (3.7 %; LaFlamme et al., 2016) and the propagated correction for instrumen-tal mass fractionation through the analytical session by quadratic addition.
3.6 In situ U–Pb geochronology
Uranium and Pb isotopic compositions were measured for four fluorite samples showing fluorite overgrowth (Flog):
(1) PPVi2 (n = 16), (2) PPVi5 (n = 20), (3) PP1802 (n = 30) and (4) PP15 (n = 26). This was done using a 193 nm excimer laser (Teledyne, Photon Machines) coupled to a Thermo Scientific™ sector field inductively coupled plasma mass spectrometer (SF-ICP-MS), ELEMENT XR (Thermo Fisher Scientific, Waltham, USA), at the Geosciences labo-ratory (GEOPS) of the University Paris-Saclay.
The overall analytical procedure follows the methods used for LA-ICP-MS U–Pb geochronology of carbonates (Roberts et al., 2020) developed at the University Paris-Saclay for calcite (Brigaud et al., 2020) – see Table A4 for analyti-cal details. The main difference concerns the laser energy needed to ablate fluorite. Indeed, a fluence of 6 J cm−2was required to ablate our natural fluorite crystals. To properly correct for downhole fractionation (DF) and other sources of laser-induced elemental fractionation (LIEF) on the mea-sured 206Pb /238U ratios, a fluorite primary reference ma-terial (RM) should be used. However, such a fluorite RM does not exist yet. Thus, similarly to Piccione et al. (2019), we used a calcite RM, the Permian Reef Complex Walnut Canyon WC-1 (Roberts et al., 2017), as the primary refer-ence material. We highlight the fact that our fluorite U–Pb ages are thus not corrected for matrix-related elemental frac-tionation. To evaluate the accuracy of our U–Pb ages, we in-cluded the analysis of a fluorite sample independently dated by (U–Th–Sm) / He thermochronology (Wolff et al., 2016). It corresponds to a sodium- and REE-rich (REE: rare earth element) green fluorite from the Horni Krupka deposit in the Czech Republic (named HK13) that has been dated by Wolff et al. (2016) at 290 ± 10 Ma.
The laser beam diameter for fluorite unknowns was 85 µm. Fluorite crystals were ablated at a repetition rate of 10 Hz and a fluence of 6.25 J cm−2. Calcite reference materials, includ-ing WC-1 primary standard and two secondary standards that are detailed below, were ablated at a repetition rate of 8 Hz, a fluence of 1 J cm−2and a beam diameter of 150 µm. Glass reference materials NIST612 and NIST614 (Jochum et al., 2011) were ablated at a repetition rate of 10 Hz, a fluence of 6.25 J cm−2 and a beam size of 40 µm for NIST612 and 110 µm for NIST614.
Each analysis consists of 30 s background acquisition fol-lowed by 30 s of sample ablation and 30 s washout. Prior to analysis, each spot was pre-ablated for 7 s at a frequency of 10 Hz and with a fluence of 6.25 J cm−2 for reference material (NIST) and fluorite samples. The frequency was 8 Hz with a fluence of 1 J cm−2 for calcite reference ma-terials. These pre-ablations are over an area larger than the beam diameter to clean the surface (155 µm for cal-cite, 50 µm for NIST612, 110 µm for fluorite and 135 µm for NIST614) and remove potential surficial Pb contamination. The laser-induced aerosol was carried by He (large volume at 0.5 L min−1and inner cup at 0.375 L min−1) from the sample cell to a mixing funnel in which the sample and He are mixed with 0.950 to 1 L min−1argon to stabilize the aerosol input to the plasma. The signal strength of the ICP-MS was tuned for maximum sensitivity while keeping Th / U at 1.02 and ThO / Th below 0.3 % on NIST612. Isotopes206Pb,207Pb,
208Pb,232Th and238U were acquired with integration times
per peak of 10 ms for208Pb,232Th and238U, 30 ms for206Pb, and 40 ms for207Pb during 70 runs.
We used NIST614 to correct for207Pb /206Pb fraction-ation (Jochum et al., 2011). For mass bias correction of the measured 238U /206Pb ratios, we used the WC-1 cal-cite reference material (Roberts et al., 2017). Two sec-ondary calcite reference materials were analyzed during the analytical sessions: Duff Brown Tank (DBT), dated at 64.0 ± 0.7 Ma by U–Pb isotope dilution–ICP-MS (Hill et al., 2016), and AUG-B6, a calcite breccia dated by LA-ICP-MS U–Pb at 42.99 ± 0.98 Ma (Pagel et al., 2018). In-ternal secondary reference calcite AUG-B6 comes from the Gondrecourt graben (eastern Paris Basin), part of the Euro-pean Cenozoic Rift System, and has been routinely analyzed for 2 years at GEOPS (University Paris-Saclay). Measure-ments have been made by sequences starting with six ref-erence material analyses (two NIST612, two NIST614 and two WC-1) with a repetition of 10 spots on unknown fluorite followed by eight reference material analyses (two NIST614, two WC-1, two DBT and two AUG-B6) and 10 spots on un-known fluorite, ending with six reference material analyses (two NIST612, two NIST614 and two WC-1). Data were ac-quired in fully automated mode overnight in two sequences of 336 analyses during about 12 h of analysis on 19 and 20 December 2019.
Data were reduced in Iolite© using the NIST614 glass as the primary reference material to correct for baseline, for Pb isotope mass bias and for206Pb /238U instrumental drift over the sequence time (Lawson et al., 2018; Paton et al., 2011). No downhole fractionation correction is applied in Iolite© (Nuriel et al., 2017). The 2-sigma errors in207Pb /206Pb and
206Pb /238U ratios measured on NIST614 during the
analyt-ical session were propagated to the final age uncertainty of fluorite samples by quadratic addition. During the first ses-sion, NIST614 2-sigma error on 207Pb /206Pb was 0.31 % and 1.10 % for206Pb /238U, and for the second session the 2-sigma errors on207Pb /206Pb and238U /206Pb were 2.20 %
and 0.69 %, respectively. A signal peak of 206Pb,207Pb or
238U can occur due to unstable ablation conditions,
caus-ing an unusually high 206Pb /238U or 207Pb /206Pb stan-dard error (2σ ) typically greater than 20 %. In Fig. A1, we document four examples of LA-ICP-MS intensity sig-nals during fluorite ablation together with the correspond-ing 3D surface images of laser craters acquired by optical profilometry. A total of 35 spots, having 2σ errors greater than 20 %, were excluded (5 on PPVi5, 7 on PPVi2, 15 on PP1802 and 8 on PP15). Each reduced datum is plotted in a238U /206Pb versus207Pb /206Pb Tera–Wasserburg graph using IsoplotR (Vermeesch, 2018). An isochron is drawn and the isochron age is deduced by the intersection on the concor-dia. For each sequence, the age and uncertainty of WC-1 ref-erence calcite, following normalization using NIST614 glass, were calculated without further normalization using a Tera– Wasserburg intercept age. Following the analytic run, we ap-plied a linear correction factor to correct the 206Pb /238U so that the primary WC-1 yields the correct intercept age (254.4 ± 6.4 Ma; Roberts et al., 2017). For the first session, we obtained 167.0 ± 3.7 Ma for WC-1 with 23 analyses; hence, we applied a linear correction factor of 0.656 to cor-rect all206Pb /238U ratios of secondary calcite reference ma-terials and fluorite unknowns. For the second analytical ses-sion, WC-1 was dated at 148.0 ± 2.3 Ma with 39 analyses. Then, the linear correction factor for the 206Pb /238U ra-tio was 0.582. We fixed the 207Pb /206Pb ratio at 0.85 for the common Pb based on Stacey and Kramers (1975) when we calculated the Tera–Wasserburg intercept age on WC-1 (Roberts et al., 2017). Regarding unknown fluorite samples, Tera–Wasserburg intercept ages are calculated by plotting each spot from a single sample and by applying the linear correction factor found for WC-1 to the corresponding ses-sion to correct the206Pb /238U ratios. An age is then calcu-lated without fixing the initial207Pb /206Pb value. Error el-lipses of each spots and the error on the Tera–Wasserburg in-tercept age are 2σ . In each Tera–Wasserburg graph, a first age uncertainty is given that does not include uncertainty propa-gations (except uncertainties related to the decay constants of
235U and238U). A second age uncertainty is given in brackets
by propagating the systematic uncertainty of primary refer-ence material WC-1 age (2.6 %; Roberts et al., 2017) and the 2-sigma error of the 207Pb /206Pb and 206Pb /238U of the analytical session by quadratic addition. Calculated ages for calcite secondary reference materials analyzed during the two sequences were 40.7 ± 1.6 and 44.4 ± 2.0 Ma for AUG-B6 and 63.7 ± 2.2 and 64.6 ± 2.9 Ma for DBT, without fixing the initial207Pb /206Pb ratio. These ages are identical within analytical uncertainty to the ages published for these two cal-cites (Pagel et al., 2018; Hill et al., 2016, respectively). HK13 fluorite was dated at 285.9 ± 29.3 (30.9) Ma. Even though the isochron is less well defined, this U–Pb age matches the (U–Th–Sm) / He age obtained by Wolff et al. (2016) at 290 ± 10 Ma.
Tera–Wasserburg diagrams of primary and secondary cal-cite reference materials and metadata for LA-ICP-MS U–Pb ages of fluorite can be found in Figs. A2–A3 and Table A4 of Appendix A. Metadata can be found in the Supplement.
4 Results
4.1 Petrographic observations
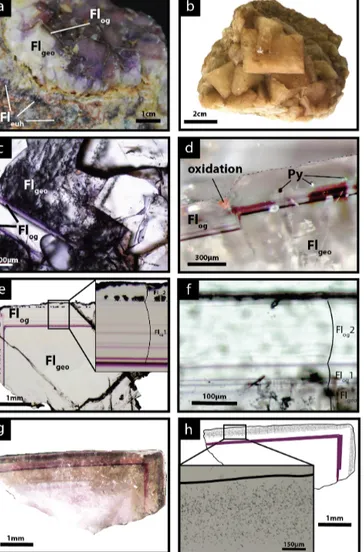
Three fluorite generations are described below and illustrated in Fig. 3a. The first fluorite stage is composed of 50 µm to 1 mm white cubes disseminated in the altered granite and mainly in the Assise de Chitry Fm, named euhedral fluorite Fleuh (Gigoux et al., 2016). These crystals may sometimes
form centimeter-sized aggregates (Fig. 3a).
The second stage fills geodic cavities or centimetric vein-lets that are several centimeters to pluri-decimetric. This geodic fluorite (Flgeo) forms millimetric to centimetric
well-developed white and yellow translucent cubes, which are more or less interlinked (Fig. 3b). These crystals are frac-tured and contain many fluid inclusions (Fig. 3c).
Geodic fluorites (Flgeo) sometimes display one or several
overgrowths (Flog). These overgrowths form the third and
last stage of fluorite. They appear translucent in transmitted plane-polarized light and do not contain any fluid inclusions (see Figs. 3c and A4). From the center to the border, two growth phases have been noted: (1) a translucent fluorite ini-tiated by one or several purple rims (Flog1) and (2) a second
growth stage of fluorite with a laminar texture (Flog2),
delin-eated by a fringe of well-aligned small globular pyrite crys-tals of about 30 µm (Fig. 3e and f). These pyrite cryscrys-tals are rarely oxidized along fractures (Fig. 3d).
Fission-track mapping carried out on Flgeo, Flog1 and
Flog2 shows that Flgeoand Flog1 are almost devoid of tracks,
while a high track density is observed in Flog2 (Fig. 3g and
h). Uranium is only detected and measured in Flog2, with the
U concentration varying from 4 to 50 ppm according to the track counting zones and an average of 7 to 26 ppm per sam-ple (see Table A2 for details).
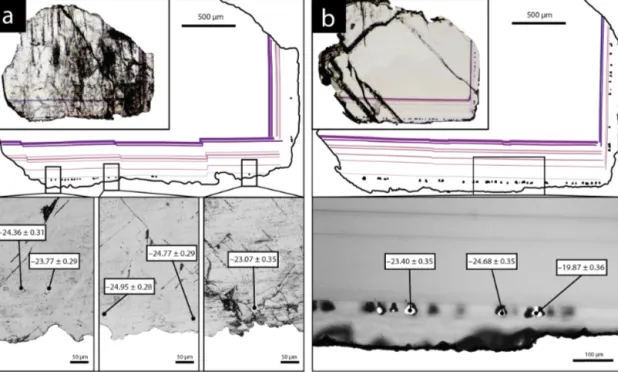
4.2 Sulfur stable isotope composition
SIMS analyses were carried out for two fluorite crystals con-taining pyrite inclusions in their rims (Fig. 4). Five pyrite crystals in sample PP18S3 have δ34S values varying from −23.1 ‰V-CDT to −24.9 ‰V-CDT. The sulfur isotopic ratio
of pyrite from sample PP18S7 varies from −19.9 ‰V-CDT
to −24.7 ‰V-CDT. The mean of δ34S values for PP18S3 and
PP18S7 are −24.2 ‰V-CDTand −23.6 ‰V-CDT, respectively.
The 2-sigma uncertainty is below 0.4 ‰V-CDT.
4.3 SR-XRF mapping
We studied in detail two samples that contain the last two generations of fluorite (Flgeo and Flog described above) to
Figure 3. Photographs of the fluorite stages from the Pierre-Perthuis ore. (a) Geode in the altered granite with milky white cu-bic crystals (Flgeo) and the translucent fluorite overgrowth (Flog)
delimited by a thin purple band. The euhedral fluorite (Fleuh) forms
patches in the Avallon granite (from Gigoux et al., 2015). (b) Centi-metric cubes of Flgeo, (c) transmitted light microscopy photography
of Flgeoand the overgrowth corresponding to Flog, (d) photography
of the limit between Flgeo and Flog with a pyrite crystal affected
by a fracture and oxidized, and (e) transmitted light microphoto-graph of a geodic fluorite crystal with the two stages constituting Flog: (1) a translucent fluorite initiated by one or several purple
rims (Flog1) and (2) a final growth stage of laminar fibrous
fluo-rite with pyfluo-rite inclusions (Flog2). (f) Microphotograph in
transmit-ted light focused on Flog2 showing a laminar texture, (g)
photog-raphy in transmitted light of an irradiated crystal of Flgeo+Flog,
and (h) corresponding interpreted map of the induced fission-track distribution in a crystal illustrated in panel (g) with a zoom into the muscovite detector.
investigate geochemical heterogeneities. PP18S7 shows sev-eral pyrite crystals at various depths, while PP18S15 shows a single pyrite at the surface of the sample (Fig. 5a and b, respectively). Synchrotron radiation XRF mapping of a tran-sect from Flgeoto Flog2 shows areas of a lower concentration
of Ca exclusively within the Flog2 (Fig. 5b) and higher
con-centrations of substituted elements such as Zr, Y, Sr, U, Th and Pb (Fig. 5a). Lead is present in both the pyrite crystals (Fig. 5a) and in Flog2 (Fig. 6).
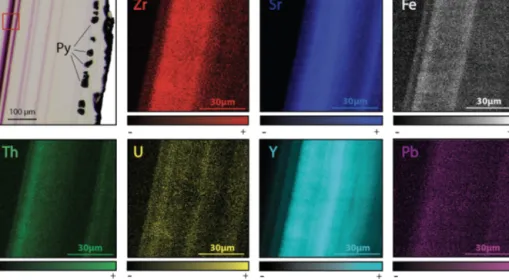
Other maps have been generated with a focus on the tran-sition between Flog1 and Flog2 (Fig. 6), highlighted as
dis-tinct by petrographic observations and fission-track mapping (Fig. 3f and h). This map reveals elemental substitution and U incorporation. At this scale, SR-XRF mapping shows en-richment in Fe, Th, Sr, Pb, Y and U in Flog2. Lead was
de-tected by SR-XRF mapping, and its spatial distribution in Flog2 is correlated with Th (Fig. 6) but not with U (Fig. A5).
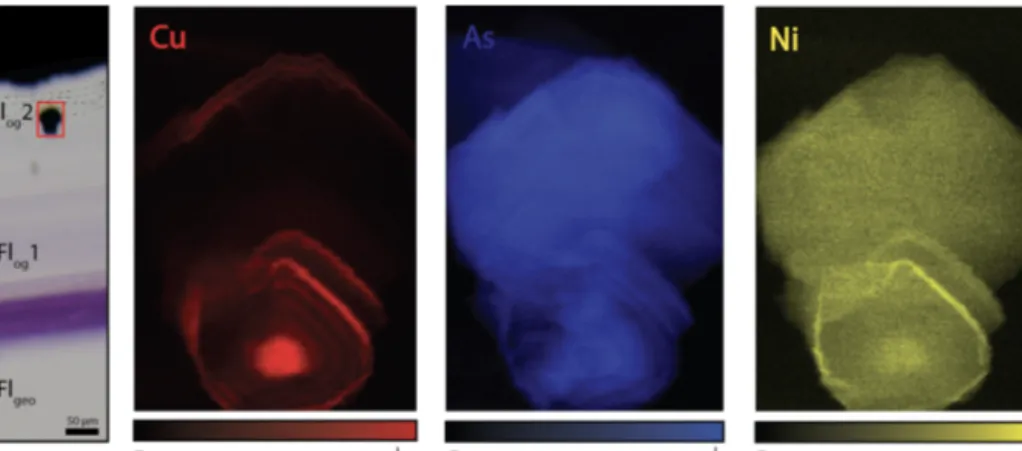
The details of the pyrite in Flog2 reveal concentric
zona-tion in Cu, As and Ni (Fig. 7).
4.4 Laser ablation U–Pb geochronology
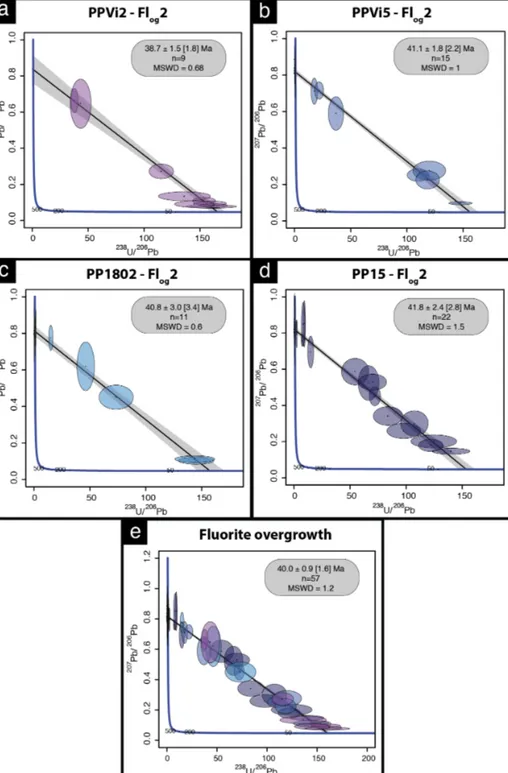
Four isochrons were calculated, with an initial207Pb /206Pb composition ranging from 0.815 to 0.840 (Tera–Wasserburg graphs were generated without anchoring the upper intercept of the discordia line to a given207Pb /206Pb composition). Outer rims of geodic fluorite crystals from Pierre-Perthuis yield an age of 38.7 ± 1.5 (1.8) Ma with 9 analyses and an MSWD of 0.68 (Fig. 8a) for PPVi2, 41.1 ± 1.8 (2.2) Ma (MSWD = 1 and n = 15) for PPVi5 (Fig. 8b), 40.8 ± 3.0 (3.4) Ma for PP1802 with 11 analyses and an MSWD = 0.6 (Fig. 8c), and 41.8 ± 2.4 (2.8) Ma for PP15 (MSWD = 1.5 and n = 22; Fig. 8d). As these ages are identical within an-alytical uncertainties, all data from the different crystals but corresponding to the same generation according to petrog-raphy were then plotted in a single graph (Fig. 8e), giving an age of 40.0 ± 0.9 (1.7) Ma (MSWD = 1.2). Because U is variable in the samples, data are well distributed in the Tera–Wasserburg space, and the isochron is rather well con-strained.
To evaluate the accuracy of fluorite LA-ICP-MS U–Pb dat-ing in the absence of calibration against a fluorite primary RM, we tested the HK13 fluorite, a sample independently dated at 290 ± 10 Ma by (U–Th–Sm) / He thermochronol-ogy (Wolff et al., 2016). Although we found an age of 285.9 ± 30.9 Ma (Fig. A3), interpretation of results is some-how limited by a poor data spread on the Tera–Wasserburg diagram and by rather large uncertainties regarding single analytical spots related to unstable ablation rates.
5 Discussion
5.1 Uranium and lead incorporation in fluorite
The fluorite overgrowths are composed of two distinct lay-ers: (1) Flog1, which is devoid of U, and (2) Flog2, in which U
was effectively incorporated within the crystal and correlated with precipitation of pyrite. Flog2 appears colorless with an
internal fibrous texture. We did not observe any pleochroic halos like Dill and Weber (2010) documented in fluorite
Figure 4.Location of SIMS analyses and the δ34S measurements (‰V-CDT) for (a) sample PP18S3 and (b) sample PP18S7.
Micropho-tographs in the upper half are in transmitted plane-polarized light, and microphoMicropho-tographs at the bottom are gold metallized zoomed areas in reflected plane-polarized light.
Figure 5.Transmitted plane-polarized light microphotographs and corresponding synchrotron radiation X-ray fluorescence elemental maps through a transect from the core crystal of Flgeoto the Flogrim from (a) sample PP18S7 and (b) PP18S15. Black areas indicate a
concentra-tion below the limit of detecconcentra-tion of the element. Globular pyrite crystals are included in Flog2.
around actinide-rich inclusions. Fission-track mapping in-stead shows a homogeneous incorporation of U (Fig. 3g and h). On a smaller scale, SR-XRF reveals micrometer-scale fluctuations in U concentrations along the growth directions, correlated with the incorporation of other substituted ele-ments such as Sr and Zr (Fig. 5). The incorporation of Zr in the fluorite lattice, together with U, may reflect a contribution from the leaching of volcanic glasses. Indeed, correlations between U and Zr concentrations have been documented in
various U deposits spatially associated with volcanic rocks or volcanic fragments reworked in sandstones and conglom-erates (Forbes et al., 1984; Cinelu and Cuney, 2006; Pons, 2015). Late Variscan ignimbrites crop out ca. 35 km south of Pierre-Perthuis (Carpena et al., 1984).
The transition between Flog1 and Flog2 may be explained
by the development of a redox front, causing U incorpora-tion in the crystal lattice. The presence of numerous pyrite crystals in Flog2, similar to those reported by Dill and
We-Figure 6.SR-XRF imaging of the transition between Flog1 and Flog2 in PP18S15 showing the distribution of Fe, Th, Sr, Pb, Y and U
contents. Map dimensions are 261 µm × 122 µm.
Figure 7.Copper, arsenic and nickel distribution maps of a pyrite included in Flog2. Map dimensions are 52 µm × 76 µm.
ber (2010), characterizes a reducing environment that prob-ably initiated the precipitation of U. Pyrite is common in roll-front U deposits (Bonnetti et al., 2015; Cai et al., 2007; Campbell et al., 2012; Ingham et al., 2014). Globular pyrites, similar to those observed in Flog2, are usually interpreted
as biogenic in origin (Belyi et al., 1972; Blakeman et al., 2002; Chen et al., 2019; Bonnetti et al., 2020; Cai et al., 2007; Rackley, 1972). This hypothesis is supported by the sulfur stable isotope composition of the pyrites included in Flog2 (mean δ34S = −23.6 ‰V-CDT). The homogeneous δ34S
of these pyrites indicates a large amount of sulfate available for reduction by bacteria in an open system (Hough et al., 2019; Magnall et al., 2016). Concentric incorporation of Ni, As and Cu (Fig. 7) was reported in both biogenic (Baum-gartner et al., 2020) and abiogenic pyrite (Wu et al., 2019). Barbarand et al. (2013) show that the basement of the south-eastern Paris Basin was subjected to temperatures less than 60◦C during the Eocene period. This temperature estimate is
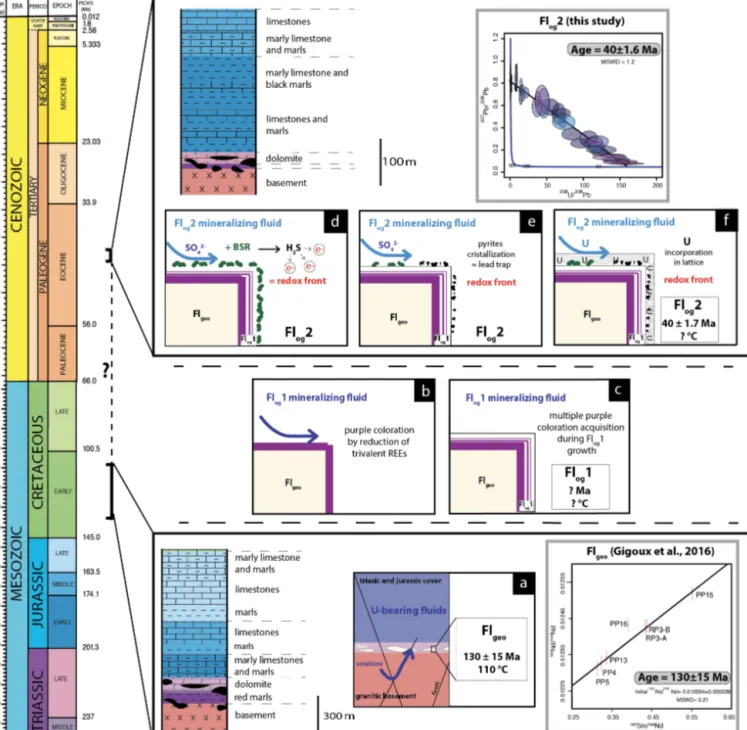
compatible with bacterial activity. Hence, we propose that U incorporation in Flog2 is related to bacterial sulfate reduction
(BSR; Fig. 9). The solubility of U was enhanced by F-bearing solutions (Xing et al., 2019) that leached the granitic base-ment through the fracture network (Fig. 9a). When reaching the unconformity between the basement and the sedimentary cover, a local redox front generated by BSR causes U to pre-cipitate (Fig. 9d). BSR produces sulfur species reacting with iron oxyhydroxides or dissolved iron to form iron disulfides (Fig. 9e; Bonnetti et al., 2017; Machel, 2001). The incorpo-ration of U, together with other elements (Figs. 5 and 6), may have been enhanced through their adsorption by bac-terial biofilms developed at the surface of fluorite crystals (Fig. 9f). Indeed, the collomorphic fibrous texture of the ex-ternal overgrowth Flog2 in the Pierre-Perthuis crystals could
result from the development of biofilms in pore–geode lin-ings (see Figs. 3f and 4b, lower right; Fig. 6, lower left; and Fig. A4). Although the secretion of extracellular polymeric
Figure 8.Tera–Wasserburg diagram of LA-ICP-MS data for fluorite. (a–d) U–Pb ages of the four fluorite overgrowth (Flog2) samples.
(e) Isochron obtained from the compilation of all data illustrated in panels (a)–(d); n is the number of analytical spots for each sample.
substances leading to the formation of bacterial biofilms on pyrite has been extensively documented, their development at the surface of fluorite crystals remains largely unexplored apart from Heim et al. (2012), who reported tubular struc-tures within fluorite-filling fracstruc-tures in the Äspö diorite in Sweden, interpreted as fossilized microbial biofilms.
The development of purple colorations in fluorite has long been recognized to be related to the vicinity of U-bearing minerals (Chatagnon et al., 1982; Pi et al., 2007). Bill and Calas (1978) proposed that the incorporation of Eu2+, together with metallic calcium colloids formed by long-time irradiation, can cause purple colorations. Chatagnon et al. (1982) and later Kempe et al. (2002) show that such
col-Figure 9.Conceptual model of U incorporation in the fluorite lattice. (a) Uranium is leached by F-rich solutions flowing through the granitic basement and reaching Flgeo in the basement–cover interface. (b) Formation of purple layers on the fluorite surface by F-bearing fluids.
(c) Crystallization of Flog1. (d) A local redox front is generated by BSR. (e) S species react with Fe oxyhydroxides or dissolved Fe to form
pyrite. (f) U is incorporated in Flog2.
orations have rather been caused by the reduction and stabi-lization of Tm and Ho in the divalent state under irradiation by the radioactive decay series of U. SR-XRF mapping fo-cused on small well-defined purple growth bands (Fig. 10) shows enrichment in U and Th. Because the width of such bands is sometimes less than 10 µm, we have discarded the hypothesis of a coloration acquired through internal alpha
ir-radiation (Dill and Weber, 2010; Pi et al., 2007; Vochten et al., 1977). Moreover, it must be noted that such coloration is not developed in the U-bearing Flog2 layer (Figs. 5 and 6).
We rather suggest that coloration was acquired through ex-ternal gamma irradiation. In the following section, we will further discuss the spatial distribution and retention of U and
Figure 10.Transmitted plane-polarized light photography from PP18S7 and corresponding synchrotron X-ray fluorescence elemental maps. The area of the XRF scan is outlined by a red box on the photograph. Map dimensions are 80 × 80 µm.
Pb as well as the reliability of the U–Pb geochronometer in fluorite.
5.2 Fluorite U–Pb geochronology 5.2.1 Retention of U in fluorite
We further discuss potential alterations of the U–Pb geochronometer through (1) the development of fractures and cleavages, (2) dissolution and recrystallization, and (3) solid-state diffusion.
1. Fractures and cleavages.
Fluorite is well known to develop cleavages and frac-tures. Although cleavages are abundant in the core of the crystals (Flgeo), they are rare on the rims (Fig. 3c).
Scarce fractures crosscutting Flog2 were observed,
caus-ing the oxidation of pyrite (Fig. 3e). Adjacent pyrite crystals being unaffected, these fractures only generated local alterations and were consequently avoided in LA-ICP-MS analyses (Fig. 3d).
2. Dissolution and recrystallization.
Dissolution and re-precipitation of fluorite in hydrother-mal deposits are common (Burisch et al., 2017). In Pierre-Perthuis, some crystals show irregular surfaces, demonstrating that a late fluid event was able to slightly dissolve fluorite. These corroded crystals were not se-lected for LA-ICP-MS analyses. In the other crystals, the preservation of pyrite crystals, the internal fibrous texture of fluorite, and the perfect geometric relation-ship between Flgeoand Flog(Fig. 3d and e) demonstrate
that Flog2 was not dissolved and recrystallized.
3. Solid-state diffusion.
Cherniak et al. (2001) determined the diffusion rates of Sr, Y and REE in natural fluorite and concluded that no significant diffusion (< 100 µm) should occur at temper-atures below 500◦C. Bosze and Rakovan (2002), how-ever, document diffuse boundaries between REE sec-toral zoning in fluorite, interpreted as resulting from the diffusion of these elements over a distance of 200– 300 µm. In Pierre-Perthuis, the preservation of ca. 10 µm thick violet bands with sharp terminations demonstrates the absence of significant REE diffusion (Kempe et al., 2002). SR-XRF mapping also shows the preservation of Sr, Y, Th, Pb and U-rich bands of a thickness of ca. 10 µm (Fig. 6), providing evidence for the absence of solid-state diffusion of these elements in our samples. Although the crystallization temperature of Flog2 is
un-known due to the absence of fluid inclusions, a maxi-mum temperature of 100◦C is speculated based (1) on the fluid inclusion homogenization temperature ranging from 80 to 100◦C for Flgeo at Pierre-Perthuis (Gigoux
et al., 2016), (2) δ34S values of pyrite suggesting BSR and (3) the fact that the paleotemperatures reached by the Assise de Chitry Fm in the area were low during the Cenozoic period (Barbarand et al., 2013; Gigoux et al., 2016). We thus conclude that U and Pb did not diffuse within Flog2.
5.2.2 In situ LA-ICP-MS U–Pb dating
The uranium concentration in fluorite is highly variable (Pic-cione et al., 2019; Walter et al., 2018; Wolff et al., 2016) and is often insufficient for U–Pb dating (Piccione et al., 2019). In the Pierre-Perthuis fluorite ore, the geodic fluorite Flgeo,
dated at 130 ± 15 Ma by Sm–Nd (Gigoux et al., 2015), could not have been tested for U–Pb geochronology because it con-tains no U. Likewise, Flog1 is not amenable to U–Pb
dat-ing. The first fluorite generation, Fleuh, precipitated during
the dissolution of the host dolomite rock and therefore con-tains too many carbonate impurities that cannot be excluded from sampling in LA-ICP-MS.
Compared to U–Pb geochronology of other common Pb-bearing minerals such as calcite (e.g., Roberts et al., 2020), fluorite U–Pb geochronology presents some additional ana-lytical challenges. Laser-induced damage in fluorite has been extensively studied (De Bonis et al., 2014; Jia et al., 2005; Rafique et al., 2012; Reichling et al., 1994). Due to ther-mal stress and shock waves, large fractures and the ejec-tion of solid fragments commonly occur during the first laser shots (Gogoll et al., 1996; Johansen et al., 1995). A 7 s pre-ablation, excluded from data used for U–Pb age calculation, helps in getting more stable ablation rates.
Ablation quality depends on numerous factors including laser parameters (wavelength, fluence and repetition rate) and intrinsic crystallographic features like orientation, chem-ical impurities, fluid inclusions or defects (Gogoll et al., 1996). Therefore, ablation rate and quality may largely vary from one natural fluorite crystal to another.
Variations in ablation rates (crater depth to crater diame-ter) may generate variable downhole fractionation (DF). To minimize DF, a low laser fluence (typically 1 J cm−2) and a large diameter are generally preferred (Mangenot et al., 2018). However, a fluence of at least 6 J cm−2was required to ablate Flog2. Optical profilometry measurements of
abla-tion pits in Flog2 reveal variable laser crater aspect ratios (see
Fig. A1 for measured crater depths by optical profilometry). The total crater depths, including the material excluded for analysis during the 7 s pre-ablation, vary from 103 to 145 µm in Pierre-Perthuis fluorite samples and is ca. 210 µm for the HK13 fluorite (see Table A5). To correct for DF, a matrix-match primary RM can be used if laser ablation generates similar crater aspect ratios between the reference material and unknown samples (Elisha et al., 2020; Guillong et al., 2020). Such a matrix-match RM is not yet available for flu-orite U–Pb geochronology (Piccione et al., 2019). However, even with the use of such an RM, DF correction may turn out to be incorrect because of variable crater aspect ratios in fluorite. Further research is needed to improve the preci-sion and accuracy of fluorite U–Pb geochronology through the systematic comparison of LA-ICP-MS crater aspect ra-tios in fluorite samples of known ages. In addition to DF, other sources of elemental fractionation should also be inves-tigated, such as the influence of the chemical composition of the aerosol (Sylvester, 2008). Piccione et al. (2019) reported comparable U–Pb ages acquired on fluorite and associated nacrite, suggesting that this effect may not introduce a sig-nificant bias.
5.3 U–Pb age significance and wider considerations regarding radiometric dating of ore deposits
In the absence of elemental fractionation correction against a fluorite RM, the age of the last generation of fluorite in Pierre-Perthuis ore (Flog2), 40.0 ± 1.7 Ma, may be
overesti-mated or underestioveresti-mated. Considering an age offset of 20 % as an extreme case (Guillong et al., 2020), this age estimate still significantly differs from the Sm–Nd age of 130 ± 15 Ma (Gigoux et al., 2015) for the prior geodic fluorite crystals Flgeo.
Bergerat (1984) proposed an N–S compressive stress field during the Eocene through microstructural analysis in the studied area, interpreted as the consequence of the Pyre-nean compression. Evidence of late Eocene brittle defor-mation and associated fluid flows is also found in the east-ern Paris Basin, ca. 150 km northeast of Pierre-Perthuis, where calcite-cementing hydraulic breccias were dated at 43 ± 1 Ma (Brigaud et al., 2020; Pagel et al., 2018). Volcanic activity in the northern part of the French Massif Central has been reported by Bellon et al. (1974) and Lefort and Agar-wal (2002) during this period about 80–120 km southeast of the study area. In conclusion, a local compressive stress field related to the propagation of N–S Pyrenean compression in the intraplate domain may have generated fluid flows and the crystallization of Flog2.
In Pierre-Perthuis, the geodic fluorite crystals Flgeo yield
an Sm–Nd age of 130 ± 15 Ma (Gigoux et al., 2015). Here, we show that later fluid flows took place during the Cenozoic period, recorded as rims overlaying Flgeo. Hence, at least two
mineralizing events occur during a time period of ca. 90 Myr. In some ore deposits, the fluorite Sm–Nd system is the only available geochronometer. However, errorchrons and imprecise ages may result. In such cases, U–Pb geochronol-ogy of authigenic phases with elevated common Pb such as calcite (Rasbury and Cole, 2009), hematite (Walter et al., 2018), chalcedony (Nuriel et al., 2011) or nacrite (Piccione et al., 2019) offers new perspectives to gain knowledge on the successive chronology of mineralizing fluid flows. In Pierre-Perthuis, however, as in some other F–Ba deposits, these minerals are absent. A late Eocene age estimate for the last fluorite-mineralizing event reveals that the ore formation is polygenic. Fluorite was deposited during several succes-sive fluid flows induced by the reactivation of faults affect-ing the granitic basement. Small-scale radiometric dataffect-ing of single growth bands in authigenic phases makes it possible to determine the chronology of these multiple crystallization events. Future research should be conducted to test the U– Pb geochronometer in fluorite crystals dated by Sm–Nd and other direct ((U–Th–Sm) / He) or indirect methods.
6 Conclusion
We have explored the U–Pb geochronometer in fluorite. In the Pierre-Perthuis F–Ba deposit, U was found in the most
external rim of fluorite crystals. SR-XRF mapping demon-strates the preservation and retention of micrometer-thick zonation in the U concentration in fluorite. Petrographic ob-servations coupled to induced fission tracks and SR-XRF mapping show that U is incorporated in the fluorite crystal lattice by elemental substitution. The incorporation of U is related to bacterial sulfate reduction, evidenced by globular pyrite inclusions. Relying on careful and detailed petrogra-phy, we show that such growth bands can be dated by U–Pb geochronology. The Tera–Wasserburg lower intercept yields an age of 40.0 ± 1.7 Ma, not corrected for matrix-related el-emental fractionation. This age estimate corresponds to the last minor fluorite-mineralizing event. Since the crystal cores were previously dated at 130 ± 15 Ma by Sm–Nd, at least two episodes of fluid flow occurred during ca. 90 Myr. Fu-ture research should be conducted to correct for238U /206Pb fractionation during LA-ICP-MS analysis in fluorite through the definition of a fluorite reference material.
Appendix A
A1 Uranium concentration measured by counted fission tracks
The range of latent track lengths of fission particles depends on the density of materials; the correction factor between two matrixes is given by Enkelmann et al. (2005). The latent fission-track lengths corresponding to the combined ranges of the light (Lt) and heavy (Hv) nuclide ejected in opposite directions from the fission of235U after capture of a thermal neutron (Jonckheere, 2003) have been simulated by SRIM®
software (Ziegler et al., 2010). The numerical values for the mass and energy of these nuclides are taken from Kahn and Forgue (1967); the glass standard reference CN5 density is from De Corte et al. (1998), and all data and simulation re-sults are summarized in Table A1.
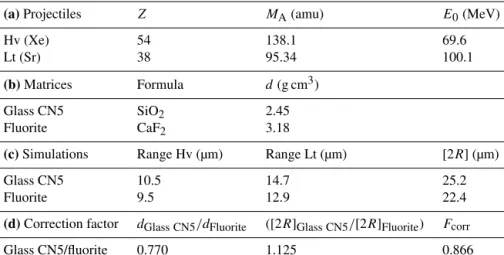
Table A1.Data used to calculate the correction factor for U concentration in fluorite using induced fission-track mapping in SRIM®software. (a) Mass (MA) and energy (E0) of heavy (Hv) and light (Lt) nuclides produced by the fission of235U. (b) The formula and density (d) of
the two simulated materials. (c) The latent track lengths (2R) obtained by adding the simulated range lengths of both nuclides. (d) Uranium concentration correction factor (Fcorr) calculated for fluorite with glass standard material (Enkelmann et al., 2005).
(a) Projectiles Z MA(amu) E0(MeV)
Hv (Xe) 54 138.1 69.6
Lt (Sr) 38 95.34 100.1
(b) Matrices Formula d(g cm3)
Glass CN5 SiO2 2.45
Fluorite CaF2 3.18
(c) Simulations Range Hv (µm) Range Lt (µm) [2R] (µm)
Glass CN5 10.5 14.7 25.2
Fluorite 9.5 12.9 22.4
(d) Correction factor dGlass CN5/dFluorite ([2R]Glass CN5/[2R]Fluorite) Fcorr
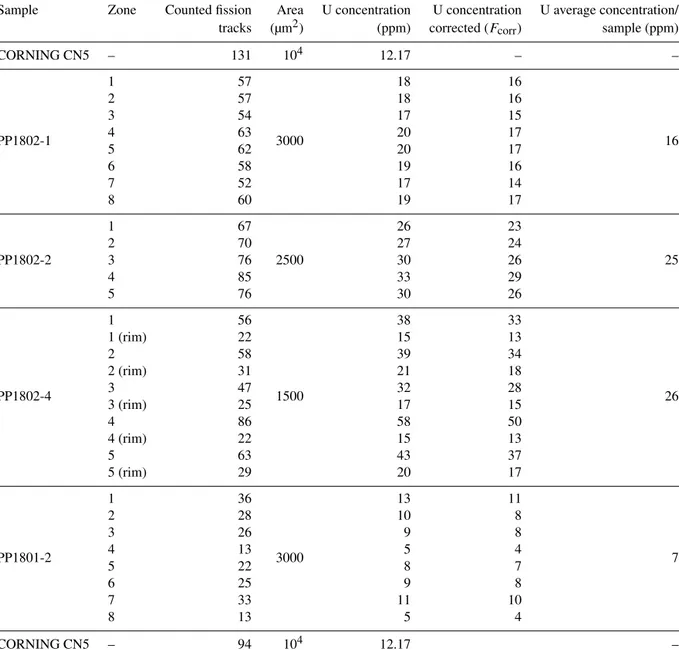
Table A2.Fission-track analytical results. Counted areas are distributed along Flog2 on different samples. The correcting factor employed
for U concentration calculation on each sample depends on the counted area and followed a bracketing method (thanks to the two CN5 standards certified at 12.17 ppm).
Sample Zone Counted fission Area U concentration U concentration U average concentration/ tracks (µm2) (ppm) corrected (Fcorr) sample (ppm)
CORNING CN5 – 131 104 12.17 – – PP1802-1 1 57 3000 18 16 16 2 57 18 16 3 54 17 15 4 63 20 17 5 62 20 17 6 58 19 16 7 52 17 14 8 60 19 17 PP1802-2 1 67 2500 26 23 25 2 70 27 24 3 76 30 26 4 85 33 29 5 76 30 26 PP1802-4 1 56 1500 38 33 26 1 (rim) 22 15 13 2 58 39 34 2 (rim) 31 21 18 3 47 32 28 3 (rim) 25 17 15 4 86 58 50 4 (rim) 22 15 13 5 63 43 37 5 (rim) 29 20 17 PP1801-2 1 36 3000 13 11 7 2 28 10 8 3 26 9 8 4 13 5 4 5 22 8 7 6 25 9 8 7 33 11 10 8 13 5 4 CORNING CN5 – 94 104 12.17 –
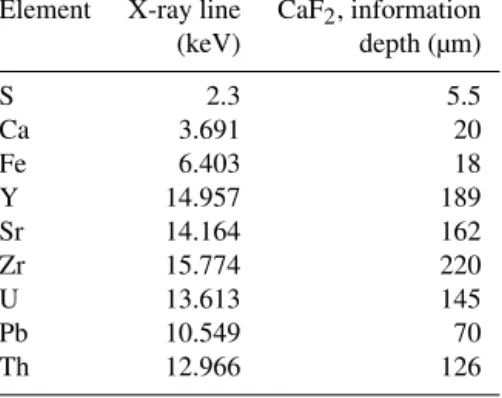
A2 Estimation of the penetration depth of SR-XRF
Table A3.Information depth estimation (µm) and measured X-ray line (keV) of the SR-XRF method in fluorite for each element.
Element X-ray line CaF2, information
(keV) depth (µm) S 2.3 5.5 Ca 3.691 20 Fe 6.403 18 Y 14.957 189 Sr 14.164 162 Zr 15.774 220 U 13.613 145 Pb 10.549 70 Th 12.966 126
A3 LA-ICP-MS U–Pb dating parameters
Table A4.Data for fluorite LA-ICP-MS U–Pb analysis at University Paris-Saclay, GEOPS laboratory. Laboratory and sample preparation
Laboratory name Géosciences Paris Sud (GEOPS), Université Paris-Saclay, Orsay, France Sample type/mineral Fluorite
Sample preparation Fluorite crystals mounted in epoxy resin Imaging Optical microscopy using transmitted light Laser ablation system
Make, model and type 193 nm ArF (Teledyne Photon Machines)
Ablation cell HelEx
Laser wavelength (nm) 193 m
Pulse width (ns) 5 ns
Fluence (J cm−2) 6.25 J cm−2 Repetition rate (Hz) 10 Hz
Pre-ablation Each spot during 7 s Ablation duration (s) 30 s
Spot size (mm) 150 µm
Sampling mode/pattern Static spot ablation
Carrier gas He
Cell carrier gas flow (L min−1) Helium
Large volume: 0.5 L min−1 Inner cup: 0.375 L min−1 ICPMS instrument
ICPMS instrument Make, model and type
Thermo Scientific Element XR
Sample introduction Ablation aerosol
RF power (W) 1175 W
Make-up gas flow in ablation funnel (L min−1) Ar = 0.950 to 1 L min−1 Detection system Ion counter
Masses measured 206, 207, 208, 232, 238 Average gas background (cps)
19 December 2019
12 for 206, 10 for 207, 26 for 208, 0.1 for 232, 0 for 238
Average gas background (cps) 20 December 2019
20 for 206, 17 for 207, 53 for 208, 0.1 for 232, 0 for 238
Integration time per peak (ms) 10 ms for208Pb,232Th,238U, 30 ms for206Pb, 40 ms for207Pb by 70 runs
Total integration time per reading (s) 0.1 s IC dead time (ns) 30 ns Signal strength at ICPMS tuned conditions Th / U = 1.02
Table A4.Continued. Data processing
Data acquisition Fully automated mode overnight in sequences of 399 analysis maximum Gas blank 30 s background, 30 s sample ablation and 30 s washout
Calibration strategy NIST614 for Pb–Pb, calcite WC-1 for U–Pb, secondary reference ma-terials: calcite Duff Brown Tank (DBT), calcite breccia AUG-B6 and fluorite HK13
Reference material info WC-1 age: 254.4 ± 6.4 Ma (Roberts et al., 2017), Duff Brown Tank age: 64 ± 0.7 Ma (Hill et al., 2016), calcite breccia AUG-B6 age: 43 ± 1 Ma (Pagel et al., 2018), fluorite HK13 age: 290 ± 10 Ma (Wolff et al., 2016) Data processing package used/correction for
LIEF
Iolite to calculate uncertainties, no downhole fractionation correction
Mass discrimination 207Pb /206Pb normalization to NIST614;206Pb /238U normalization to WC-1
Common Pb correction, composition and uncertainty
No common Pb correction applied
Uncertainty level and propagation Ages in the data table are quoted at 2-sigma (2σ ) absolute, uncertainty propagation by quadratic addition
Quality control/validation 19 December 2019
Measurements of WC-1 age = 167.04 ± 3.7 Ma, Duff Brown Tank (DBT) age = 63.75 ± 2.2 Ma, AUG-B6 age = 40.7 ± 1.6 Ma; NIST614 was done along with samples throughout the analytical session
Quality control/validation 20 December 2019
Measurements of WC-1 age = 148.02 ± 2.3 Ma, Duff Brown Tank (DBT) age = 64.57 ± 2.9 Ma, AUG-B6 age = 44.45 ± 2.0 Ma; HK13 fluorite was dated at 285.9 ± 29.3 (30.9) Ma; NIST614 was done along with samples throughout the analytical session
A4 Depth and diameter of laser craters
3D images of laser craters have been acquired with an op-tical profilometer 3D Contour GT-X (Bruker Corp., Biller-ica, MA, USA) in VSI (vertical shift interference) mode at GeePs laboratory, Université Paris-Saclay. This instrument produces 3D images of a surface and also depth profiles on chosen axes thanks to Vision®analysis software (VISIONx Inc., Pointe Claire, Quebec, Canada). The VSI mode is based on white light vertical scanning interferometry, with measur-able topography up to 1 mm and a vertical resolution of 3 nm. Lateral resolution measurements are a function of the ob-jective magnification (× 50 magnification was used for this study), giving a lateral resolution of 0.2 µm.
Table A5.Statistical analysis of crater depths induced by laser ab-lation for U–Pb dating by an optical profilometer. The total crater depths and volumes include the 7 s pre-ablation (N.D. – not deter-mined).
Sample Total depth, including Volume pre-ablation (µm) (µm3) PPVi2_no. 13 130 574 842 PPVi2_no. 19 116 675 090 PPVi2_no. 24 145 818 605 PPVi2_no. 25 105 626 830 Average 124 673842 PPVi5_no. 1 140 875 287 PPVi5_no. 2 140 912 850 PPVi5_no. 3 120 834 602 PPVi5_no. 8 125 757 431 Average 131 845 043 PP1802_no. 6 103 524 342 PP1802_no. 9 110 507 250 PP1802_no. 11 122 549 564 PP1802_no. 12 132 621 271 Average 117 550 607 PP15_no. 3 105 249 329 PP15_no. 9 110 329 296 PP15_no. 14 110 360 308 PP15_no. 15 130 451 288 Average 114 347 555 HK13 no. 1, no. 5 210 N.D.
Figure A1.Various crater aspects induced by laser ablation on different fluorite sample (a) 3D surface images of craters reconstructed by an optical profilometer. (b) Corresponding 2D axial section with the measurement of crater depth thanks to two markers: R (the average value of the planar surface around the crater) and M (the deepest point in the crater) expressed as 1z (µm); illustrated in grey is the volume below a crater diameter of 85 µm. (c) The corresponding LA-ICP-MS signal intensity of238U,206Pb and207Pb during the laser ablation. Analyses PPVi5 no. 8, PPVi5 no. 1 and PPVi2 no. 6 were included in the Tera–Wasserburg diagrams, while PP15 no. 14 is an example of an analysis discarded due to variable238U /206Pb.
Figure A2.Tera–Wasserburg diagrams of secondary calcite reference materials. (a, b) Tera–Wasserburg diagrams displaying corrected ages for the calcite of the Gondrecourt graben AUG-B6 measured during the two analytical sessions. (c, d) Tera–Wasserburg diagram displaying the Duff Brown Tank corrected ages measured during the two analytical sessions.
Figure A3. Tera–Wasserburg diagrams of secondary fluorite ref-erence materials; HK13 fluorite dated at 290 ± 10 Ma by Wolff et al. (2016).
A5 Petrographic observations
Figure A4.Microphotography of the fluorite stages from the Pierre-Perthuis ore showing the contrast in fluid inclusion concentrations between Flgeoand Flog. Py: pyrite.
Figure A5.Scatter plot of Pb as a function of Th (blue) and U (red) in pixel intensities, corresponding to the scanned area illustrated in Fig. 6.
Code availability. The MATLAB (r) code developed in-house and used for SR-XRF elemental mapping is specific to the software and hardware environment of the Nanoscopium beamline of SOLEIL in order to optimize it for on-line fast data treatment during experi-ments. As such, this software is not intended to be publicly avail-able. However, there are freewares, such as the PyMCA software, which can be applied to data treatment a posteriori (we also applied PyMCA for some a posteriori data treatment tasks).
Data availability. All data are included in the paper and in the Supplement.
Supplement. The supplement related to this article is available online at: https://doi.org/10.5194/gchron-3-199-2021-supplement.
Author contributions. JN and CB were involved in the prepara-tion of the fluorite samples for SEM observaprepara-tions, SR-XRF and in-duced fission-track mapping. AS directed the elemental mapping experiments on the Nanoscopium beamline at synchrotron SOLEIL and supervised SR-XRF data interpretation. ABO carried out the measurements by 3D optical profilometry at the Group of Electri-cal Engineering Paris (GeePs) laboratory. JB, BB and MP were in-volved in fieldwork, data interpretation and the improvement of the paper. LL and TB participated in every step of the study and pre-pared the paper.
Competing interests. The authors declare that they have no con-flict of interest.
Acknowledgements. The authors acknowledge SOLEIL for the provision of synchrotron radiation facilities and thank Kadda Med-joubi for assistance in using the Nanoscopium beamline. The au-thors would like to thank Kadda Medjoubi for support and the scien-tific discussions during SR-XRF experiments on the Nanoscopium beamline at SOLEIL. We acknowledge Nordine Bouden and Jo-han Villeneuve for the acquisition of sulfur stable isotope ratios by SIMS at the CRPG. We would like to thank Frederic Haurine for his assistance during the acquisition of the U–Pb analyzes performed on the LA-ICP-MS, which is part of the PANOPLY platform (GEOPS-LSCE). Portions of this research were carried out at the SOLEIL synchrotron radiation laboratory, a national user facility operated by CEA and CNRS (Proposal number: 20190188). This research was partly funded by TelluS Program CESSUR “Connaissance et Technologie du Sous-Sol pour son Exploitation et Usage Durable” of CNRS/INSU. Reinhard Wolff is warmly thanked for sharing fluo-rite sample HK13. This paper greatly benefited from the detailed re-views of Istvàn Dunkl, Troy Rasbury, associate editor Axel Schmitt and editor Klaus Mezger.
Financial support. This research has been supported by the Tel-luS Program CESSUR “Connaissance et Technologie du Sous-Sol pour son Exploitation et Usage Durable” of CNRS/INSU.
Review statement. This paper was edited by Axel Schmitt and reviewed by Troy Rasbury and István Dunkl.
References
Alexandre, P., Kyser, K., Thomas, D., Polito, P., and Marlat, J.: Geochronology of unconformity-related uranium deposits in the Athabasca Basin, Saskatchewan, Canada and their integra-tion in the evoluintegra-tion of the basin, Miner. Deposita, 44, 41–59, https://doi.org/10.1007/s00126-007-0153-3, 2009.
Baele, J.-M., Monin, L., Navez, J., and André, L.: Systematic REE Partitioning in Cubo-Dodecahedral Fluorite from Bel-gium Revealed by Cathodoluminescence Spectral Imaging and Laser Ablation-ICP-MS, Proceedings of the 10th International Congress for Applied Mineralogy (ICAM), 1–5 August 2011, Trondheim, Norway, 23–30, https://doi.org/10.1007/978-3-642-27682-8_4, 2012.
Barbarand, J., Quesnel, F., and Pagel, M.: Lower Paleo-gene denudation of Upper Cretaceous cover of the Mor-van Massif and southeastern Paris Basin (France) revealed by AFT thermochronology and constrained by stratigra-phy and paleosurfaces, Tectonostratigra-physics, 608, 1310–1327, https://doi.org/10.1016/j.tecto.2013.06.011, 2013.
Baumgartner, R. J., Van Kranendonk, M. J., Pagès, A., Fiorentini, M. L., Wacey, D., and Ryan, C.: Accumulation of transition met-als and metalloids in sulfidized stromatolites of the 3.48 billion-year-old Dresser Formation, Pilbara Craton, Precambrian Res., 337, 105534, https://doi.org/10.1016/j.precamres.2019.105534, 2020.
Bellon, H., Gillot, P. Y., and Nativel, P.: Eocene volcanic activity in Bourgogne, Charollais, Massif Central (France), Earth Planet. Sc. Lett., 23, 53–58, https://doi.org/10.1016/0012-821X(74)90029-6, 1974.
Belyi, V., Vinogradov, V., and Lisitsin, A.: Sulfur isotope compo-sition of uranium roll ore bodies and its genetic significance, Litologiya i Poleznye Iskopaemye, 6, 42–53, 1972.
Bergamaschi, A.: Développements méthodologiques et logiciels pour l’imagerie X multimodale par balayage sur la ligne de lu-mière Nanoscopium, Thèse de doctorat, Université Paris Saclay, Saint-Aubin, France, 146 pp., 2017.
Bergerat, F.: La fracturation nivernaise: Influences bourguignonne et centralienne sur la structuration du Nivernais, Bulletin d’information des géologues du bassin de Paris, 21, 27–31, 1984. Bill, H. and Calas, G.: Color centers, associated rare-earth ions and the origin of coloration in natural fluorites, Phys. Chem. Miner., 3, 117–131, https://doi.org/10.1007/BF00308116, 1978. Blakeman, R. J., Ashton, J. H., Boyce, A. J., Fallick, A.
E., and Russell, M. J.: Timing of Interplay between Hy-drothermal and Surface Fluids in the Navan Zn + Pb Ore-body, Ireland: Evidence from Metal Distribution Trends, Min-eral Textures, and 34S Analyses, Econ. Geol., 97, 73–91, https://doi.org/10.2113/gsecongeo.97.1.73, 2002.
Boiron, M. C., Cathelineau, M., Banks, D. A., Buschaert, S., Four-cade, S., Coulibaly, Y., Michelot, J. L., and Boyce, A.: Fluid transfers at a basement/cover interface Part II: Large-scale in-troduction of chlorine into the basement by Mesozoic basinal brines, Chem. Geol., 192, 121–140, 2002.
Bonnetti, C., Cuney, M., Michels, R., Truche, L., Malartre, F., Liu, X., and Yang, J.: The Multiple Roles of Sulfate-Reducing