HAL Id: hal-00317693
https://hal.archives-ouvertes.fr/hal-00317693
Submitted on 3 Nov 2004
HAL is a multi-disciplinary open access
archive for the deposit and dissemination of
sci-entific research documents, whether they are
pub-lished or not. The documents may come from
teaching and research institutions in France or
abroad, or from public or private research centers.
L’archive ouverte pluridisciplinaire HAL, est
destinée au dépôt et à la diffusion de documents
scientifiques de niveau recherche, publiés ou non,
émanant des établissements d’enseignement et de
recherche français ou étrangers, des laboratoires
publics ou privés.
local time for southeast IMF orientation: implications
for solar wind-magnetosphere coupling
P. E. Sandholt, C. J. Farrugia, W. F. Denig
To cite this version:
P. E. Sandholt, C. J. Farrugia, W. F. Denig. Detailed dayside auroral morphology as a function of
local time for southeast IMF orientation: implications for solar wind-magnetosphere coupling. Annales
Geophysicae, European Geosciences Union, 2004, 22 (10), pp.3537-3560. �hal-00317693�
Annales Geophysicae (2004) 22: 3537–3560 SRef-ID: 1432-0576/ag/2004-22-3537 © European Geosciences Union 2004
Annales
Geophysicae
Detailed dayside auroral morphology as a function of local time for
southeast IMF orientation: implications for solar
wind-magnetosphere coupling
P. E. Sandholt1, C. J. Farrugia2, and W. F. Denig3
1Department of Physics, University of Oslo, Oslo, Norway
2Space Science Center, University of New Hampshire, Durham, New Hampshire, USA
3Space Vehicles Directorate, Air Force Research Laboratory, Hanscom AFB, Massachusetts, USA
Received: 1 March 2004 – Revised: 15 June 2004 – Accepted: 24 June 2004 – Published: 3 November 2004
Abstract. In two case studies we elaborate on spatial and
temporal structures of the dayside aurora within 08:00–16:00 magnetic local time (MLT) and discuss the relationship of this structure to solar wind-magnetosphere interconnection topology and the different stages of evolution of open field lines in the Dungey convection cycle. The detailed 2-D au-roral morphology is obtained from continuous ground ob-servations at Ny ˚Alesund (76◦ magnetic latitude (MLAT)),
Svalbard during two days when the interplanetary magnetic field (IMF) is directed southeast (By>0; Bz<0). The
auro-ral activity consists of the successive activations of the fol-lowing forms: (i) latitudinally separated, sunward moving, arcs/bands of dayside boundary plasma sheet (BPS) origin, in the prenoon (08:00–11:00 MLT) and postnoon (12:00– 16:00 MLT) sectors, within 70–75◦ MLAT, (ii) poleward moving auroral forms (PMAFs) emanating from the pre- and postnoon brightening events, and (iii) a specific activity ap-pearing in the 07:00–10:00 MLT/75–80◦MLAT during the prevailing IMF By>0 conditions. The pre- and postnoon
ac-tivations are separated by a region of strongly attenuated au-roral activity/intensity within the 11:00–12:00 MLT sector, often referred to as the midday gap aurora. The latter aurora is attributed to the presence of component reconnection at the subsolar magnetopause where the stagnant magnetosheath flow lead to field-aligned currents (FACs) which are of only moderate intensity. The much more active and intense auro-rae in the prenoon (07:00–11:00 MLT) and postnoon (12:00– 16:00 MLT) sectors originate in magnetopause reconnection events that are initiated well away from the subsolar point. The high-latitude auroral activity in the prenoon sector (fea-ture iii) is found to be accompanied by a convection channel at the polar cap boundary. The associated ground magnetic deflection (DPY) is a Svalgaard-Mansurov effect. The con-vection channel is attributed to effective momentum
trans-Correspondence to: P. E. Sandholt
(p.e.sandholt@fys.uio.no)
fer from the solar wind-magnetosphere dynamo in the high-latitude boundary layer (HBL), on the downstream side of the cusp.
Key words. Magnetospheric physics (auroral phenomena:
magnetopause, cusp and boundary layers; solar wind-magnetosphere interactions)
1 Introduction
This study deals with auroral signatures of temporal and spatial aspects of solar wind-magnetosphere-ionosphere cou-pling processes which are in operation during intervals of southward directed interplanetary magnetic field (IMF) when a significant east-west (By) component is also present.
The spatial aspect is closely related to the IMF By
-regulated dawn-dusk asymmetry of the dayside magneto-sphere (Jørgensen et al., 1972; Cowley, 1981; Gosling et al., 1990), appearing strongly in plasma convection (Mozer et al., 1974; Heppner and Maynard, 1987; Cowley et al., 1991; Weimer, 1995), auroral precipitation and field-aligned cur-rents (Potemra and Saflekos, 1979; Friis-Christensen, 1984; Taguchi et al., 1993; Watanabe et al., 1996; Farrugia et al., 2003), while the temporal aspect refers to the pulsed na-ture of the magnetopause reconnection process (Russell and Elphic, 1978). The spatial aspect we study includes the role played by the high-latitude boundary layer (HBL) in the By-regulated solar wind-magnetosphere coupling
(Sis-coe et al., 2000) in the Dungey convection cycle, giving rise to a Svalgaard-Mansurov effect in ground magnetic deflec-tions (Svalgaard, 1973).
In previous studies of the dayside aurora based on ground-and/or space-based observations attention has been directed mainly on the temporal structure. This approach has given us important insight on the coupling of temporal features of the magnetopause reconnection process (flux transfer events;
FTEs) to the ionosphere (Sandholt et al., 1990, 1993b; Mi-lan et al., 2000; Neudegg et al., 2001; Sandholt et al., 2003; Lockwood et al., 2003). A major issue under debate in mag-netospheric physics today is the magnetopause reconnection topology (Moore et al., 2002; Russell, 2003; Maynard et al., 2003). The investigation of the spatial structure of the day-side aurora is in our view very relevant to this issue. Up to now many studies of the spatial structure have been severely hampered by the restricted field of view (FOV) provided by single ground instruments and/or by the poor spatial resolu-tion in the space-based observaresolu-tions.
In a few case studies the FOV has been extended by the combination of data from similar instruments located at different sites, providing partly overlapping fields of view (Sandholt et al., 2003). In a few other cases the limited ground perspective has been combined with space-based au-roral observations (Farrugia et al., 2004b). The latter ap-proach is very useful and promising, but only very few data sets of this type have been studied so far. Thus, despite the various efforts that have been made over the years to improve the spatial resolution and coverage, the present description of the dayside auroral morphology is still fragmentary. As indicated above, this is mainly due to the restricted spatial coverage of the ground observations and to the poor spatial resolution in the space-based observations.
In the present study we extend the ground perspective (spatial coverage) by applying a long series of observations from a single station as it sweeps through the entire dayside from ∼08:00 to 15:00 MLT on 3 December 1997 and 12 De-cember 1999. This approach is particularly relevant since the interplanetary magnetic field (IMF) orientation, as rep-resented by the clock angle in the Y-Z plane, remained in the same sector (90–150◦; B
z<0; By>0) most of the time
during these two days. Thus, we can provide an updated description of the detailed dayside auroral morphology as a function of local time (MLT) for this particular regime of IMF orientation. Under the actual IMF condition a distinct component of the ground magnetic deflection is of the type referred to as DPY (Friis-Christensen and Wilhjelm, 1975), or the Svalgaard-Mansurov effect (Svalgaard, 1973). An im-portant aspect of this study is the demonstration of the associ-ation between the dayside aurora and a polar cap convection channel, giving rise to a Svalgaard-Mansurov effect. For this purpose we shall apply ion drift data from spacecraft DMSP F13. Particle precipitation data obtained from three DMSP spacecraft are used to identify the plasma sources of the var-ious auroral forms.
Very different reconnection topologies and associated ionospheric signatures are predicted for the different recon-nection models during conditions involving an IMF with a strong east/west (By) component. It is therefore of great
in-terest to document the detailed spatial structure of the day-side aurora in such cases.
First, we shall give a brief description of three different re-connection topologies for the case of southeast or southwest IMF orientations. Case (I) is the component reconnection model (Sonnerup, 1974; Gonzalez and Mozer, 1974; Hill,
1975; Cowley, 1976; Moore et al., 2002), according to which there is no strong restriction on the magnetic shear between the external and internal fields, except perhaps for a cutoff at shear angles below ∼40◦ (Phan and Paschmann, 1996). In this case reconnection in the subsolar region is present along a tilted reconnection line. Until a few years ago this was the majority view even as a result of the success in interpretation of data from ISEE 1 and 2, which crossed the magnetopause at typically low latitudes and which gave the first evidence for the occurrence of reconnection (Paschmann et al., 1978, 1979; Sonnerup et al., 1981).
In contrast to case (I), the antiparallel reconnection hy-pothesis, which is our case (II), limits the process to regions of field shear close to 180◦(Crooker, 1979; Luhmann et al., 1984). In this case, for an IMF pointing southeast/west, re-connection is absent in the subsolar region, but is present simultaneously at high northern (southern) latitudes in the postnoon (prenoon) sector and at high southern (northern) latitudes in the prenoon sector during positive (negative) IMF
Byconditions.
Substantial differences in ionospheric footprints of the re-connection process are expected in these two scenarios in the form of plasma convection (Coleman et al., 2001; Chisham et al., 2002a; Rodger et al., 2003) and auroral precipita-tion (Newell et al., 1995; Maynard et al., 2001; Sandholt et al., 2004). In case II, IMF Bybifurcates the cusp
longitudi-nally due to the split (two-branch) X-line topology (Crooker, 1979; Luhmann et al., 1984). As a consequence there is a substantive subsolar region where there is no reconnected flux and hence no evidence of an open low-latitude bound-ary layer (Rodger et al., 2003).
Thus, in case II and for positive Byconditions, the
recon-nection site is shifted to high northern latitudes in the post-noon sector and to high southern latitudes in the prepost-noon sector for By positive conditions. Observations indicating
the occurrence of reconnection, in the form of flux transfer events (FTEs), at high magnetopause latitudes have been re-ported by Haerendel et al. (1978). The antiparallel recon-nection topology was also considered by Rijnbeek (1984) to be a possible interpretation of certain FTEs observed by spacecraft HEOS 2 at high latitudes. Magnetohydrodynamic (MHD) simulations indicating that antiparallel reconnection is ocurring have been reported by, for example, White et al. (1998) and Peroomian (2003).
In a third possible reconnection topology (case III), the process may occur simultaneously in different modes/rates in different sectors along a tilted X-line running through the subsolar region and extending to high latitudes (see, e.g. Fig. 4 of Moore et al., 2002). In this model reconnection is of the component type in the subsolar region and antiparallel at high latitudes in the northern dusk (dawn) and southern dawn (dusk) sectors for positive (negative) IMF Byconditions (see
also Siscoe et al., 2001).
In the model of Luhmann et al. (1984) (case II), recon-nection is limited to conditions of near-antiparallel fields. Thus, this model may also allow for a small guide field along the reconnection line. The latter may be important for
P. E. Sandholt et al.: Detailed dayside auroral morphology 3539 the formation of reconnected flux tubes in bursty
reconnec-tion (FTEs). Recall that, considering the continuity of the field component normal to the magnetopause, BN, Cowley
(1982), and, independently, Paschmann et al. (1982) postu-lated a twisted field in the reconnected flux tube. Saunders et al. (1984) gave two-spacecraft examples verifying this idea observationally. Later, Lee and Fu (1985) incorporated this idea as an essential feature in their model, but extended it to include multiple X-lines.
In recent years there has been an intense search for iono-spheric signatures of antiparallel merging. Modelling work on the ionospheric footprint of the antiparallel X-line topol-ogy has been reported by Coleman et al. (2001) and by Rodger et al. (2003), who mapped the antiparallel merg-ing region (X-line) to the ionosphere, usmerg-ing the Tsyganenko (1996) field line mapping for an IMF condition characterized by Bz=−3 nT and By=3 nT (clock angle in the GSM Y−Z
plane=135◦). They found a small gap in the ionospheric
foot-print at noon under conditions very similar to those we study: December solstice in the Northern Hemisphere (see below). The convection signature is manifest in the form of a limited region in the midday sector, where the ion flow signature is very weak at a time when there are strong flows on either side of it, in the prenoon and postnoon convection cells (see Fig. 5 in Chisham et al., 2002a, and Fig. 8 in Chisham et al., 2002b).
Elements of interpretation of the dayside auroral morphol-ogy reported in this study, which is representative of a south-east (By>0) IMF orientation, are as follows:
(A) The midday gap aurora and the subsolar magnetopause: Component reconnection in the subsolar region gives rise to an open low-latitude boundary layer (LLBL). Field-aligned current generation in the open LLBL is strongly related to the local flow shear (Sonnerup and Siebert, 2003). This flow shear reaches a minimum at the stagnant, subsolar magne-topause (Spreiter et al., 1966; Russell et al., 1981), giving rise to a corresponding minimum in FAC intensity around noon (11:00–12:00 MLT sector in our case) and the associ-ated midday gap aurora.
(B) Pre- and postnoon auroral brightening events threaded by newly-open field lines: These forms are attributed to the presence of antiparallel (or near-antiparallel) reconnection in different hemispheres (prenoon/south and postnoon/north), as envisaged by Luhmann et al. (1984). Strong flow shears in the pre- and postnoon boundary layers give rise to strong FAC intensities in these sectors (away from noon) and asso-ciated enhanced auroral intensity there.
(C) High-latitude auroral events in the prenoon sector (07:00–11:00 MLT/75–80◦ MLAT) threaded by old open field lines: They are accompanied by a channel of strong plasma convection and the associated DPY magnetic deflec-tion, a Svalgaard-Mansurov effect (Svalgaard, 1973). This specific aurora and plasma convection are manifestations of high-latitude momentum transfer events on the downstream side of the cusp.
(D) High-latitude auroral form (polar arc; see also Lyons et al., 1996) in the postnoon sector (13:00–16:00 MLT): This
WIND/SWE/MFI December 3, 1997 (GSM) 4 5 6 7 8 9 10 11 0 5 10 N (cm -3) 4 5 6 7 8 9 10 11 330 380 V (km s -1) 4 5 6 7 8 9 10 11 0 1•105 2•105 T (K) 4 5 6 7 8 9 10 11 0 1 2 Pdyn (nPa) 4 5 6 7 8 9 10 11 0 5 B (nT) 4 5 6 7 8 9 10 11 -5 0 5 Bx (nT) 4 5 6 7 8 9 10 11 -5 0 5 By (nT) 4 5 6 7 8 9 10 11 -5 0 5 Bz (nT) 4 5 6 7 8 9 10 11 UT 180 150 120 90 60 Clock Ang ( o) (199.0, 1.4, 26.5) RE (200.0, 1.8, 26.4) RE Figure 1
Fig. 1. Solar wind plasma and IMF observations from spacecraft
Wind during the interval 04:00–01:00 UT on 3 December 1997. Panels from top to bottom shows proton density, bulk speed, tem-perature, solar wind dynamic pressure, the total field intensity and the GSM components (Bx, By, and Bz) of the interplanetary
mag-netic field (IMF). The three selected intervals for which we re-port/discuss dayside auroral observations are indicated by vertical guidelines.
aurora is located in a region of flow shear (see Reiff et al., 1978), well poleward of the R1 current, i.e. between this cur-rent and the regime of polar rain precipitation. Lobe recon-nection is a candidate source (Reiff and Burch, 1985; Eriks-son et al., 2002, 2003).
The paper is organized as follows. The presentation of the observations, including solar wind plasma and IMF param-eters, the optical aurora obtained from ground-based instru-mentation, satellite observations of particle precipitation and ionospheric ion drift, and ground magnetic deflections, rep-resenting two cases/days, is followed by a summary of the observations, a discussion section, and a final list of conclu-sions.
09 MLT
12
70
80
90
80
15
MLAT
52F14(1020-1028)
D
C
B
b)F11 (1009-1017)
70
A
F13
1058)
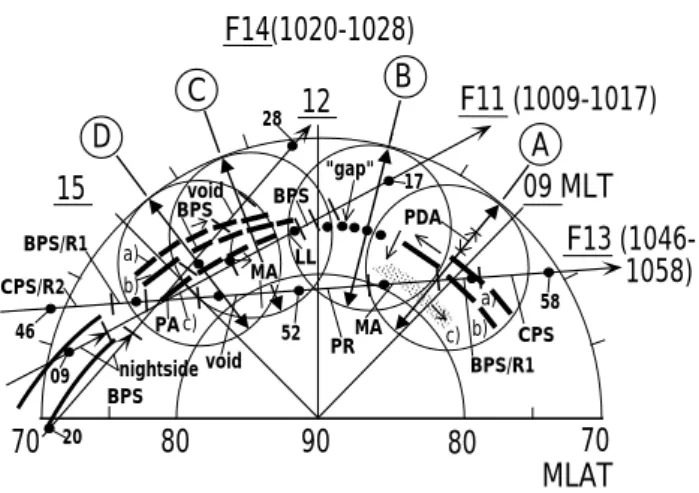
MA BPS PR BPS/R1 CPS/R2 46 BPS/R1 nightside CPS PDA BPS void BPS void "gap" 20 58 MA LL PA a) c) a) b) c) 17 28 09 Figure 2Fig. 2. Schematic illustration of dayside auroral configuration applicable to the interval 05:50–11:00 UT on 3 December 1997. The coordinate system is MLAT/MLT. The fields of view at 630.0 nm of the MSP and all-sky camera (ASC) in Ny ˚Alesund for 05:50 UT (A), 07:40 UT (B), 09:50 UT (C), and 10:50 UT (D) are marked by double-arrowed meridional lines and circle, respectively. The tracks of DMSP spacecraft F11, F13, and F14 during the inter-vals 10:09–10:17 (F11), 10:20–10:28 UT (F14), and 10:46–10:58 (F13), respectively, are indicated. Precipitation regimes are marked along the tracks. Multiple, fragmented BPS arcs in the pre- and postnoon sectors are marked a, b, as well as directions of auro-ral motion (arrows). A deep minimum of auroauro-ral intensity in the
∼11:00–12:00 MLT sector is marked with solid dots.
2 Data presentation
2.1 Case 1: 3 December 1997
2.1.1 IMF and solar wind plasma data
Figure 1 shows solar wind plasma and IMF observations obtained from spacecraft Wind during the interval 04:00– 11:00 UT on 3 December 1997. The positions of Wind at 04:00 and 11:00 UT are (199.0; 1.4; 26.5) RE and (200.0;
1.8; 26.4) RE. The Wind-to-ground propagation delay is
es-timated to be ∼58 min. The latter estimate is based on the ob-served auroral responses to the southward and northward ro-tations of the IMF recorded by Wind at 04:30–04:50 UT and 08:18 UT, respectively. Vertical guidelines delimit the inter-vals 04:20–05:00 UT, 06:30–06:40 UT, and 08:30–09:30 UT, corresponding to three of the selected intervals of auroral ob-servations which are discussed below, when the ground au-roral station swept through the following local time sectors 04:20–05:00 MLT, 11:00 MLT, and 13:00–14:00 MLT. The solar wind and IMF conditions are very similar in these in-tervals. They are characterized by a slow solar wind speed (360 km/s), normal field strength (5 nT), slightly below nor-mal dynamic pressure (∼1 nPa), negative Bx, positive By,
and negative Bz. The IMF clock angle regime is 90–150◦.
2.1.2 Overview of the auroral observations
The observation geometry for this case, as well as some main features of the auroral observations obtained from Ny
˚
Alesund during the interval 05:50–11:00 UT on 3 Decem-ber 1997, are indicated schematically in Fig. 2. Approx-imate fields of view of the meridian scanning photometer (MSP) and the ASC are marked A (05:50 UT), B (07:40 UT), C (09:50 UT), and D (10:50 UT). The multiple, frag-mented BPS arcs in the prenoon (∼08:00–10:00 MLT) and postnoon (∼12:30–16:00 MLT) sectors, characterized by noonward motions (see arrows), are shown (labels a and b), as well as the “midday gap aurora” (solid dots) in the ∼11:00–12:00 MLT sector. Particle precipitation/field-aligned current regimes are marked by bars along the tracks of DMSP spacecraft F11, F13, and F14 during the intervals 10:09–10:17 UT (F11), 10:20–10:28 UT (F14), and 10:46– 10:58 UT (F 13). These intervals were selected in order to demonstrate typical features of the aurora in the pre-noon, midday, and postnoon sectors.
The prenoon sector perspective reveals, in addition to the BPS arcs located in the vicinity of 75◦ MLAT, the pres-ence of a pulsed, diffuse aurora (PDA) to the south, within the regime of CPS precipitation, and a pulsing cusp/mantle (MA) aurora in the north (form c). For a detailed description of the auroral activity within the field of view marked A in Fig. 2 we refer to Farrugia et al. (2003) (see their Figs. 9, 12, and 13). The plasma sources and FAC regimes associ-ated with these aurorae, as observed from spacecraft Polar, are also reported in Farrugia et al. (2003). The IMF regula-tion of the prenoon sector auroral activity during the prevail-ing IMF By>0 conditions has also been reported in
Sand-holt et al. (2004). In this case presentation we shall focus on the following features: (i) the high-latitude activity in the prenoon sector (form c), (ii) the postnoon sector activity, and (iii) the phenomenon of midday gap aurora in the ∼11:00– 12:00 MLT sector. The latter is characterized by a deep min-imum in auroral intensity/activity when compared with the pre- and postnoon sector activities.
2.1.3 Auroral observations in detail
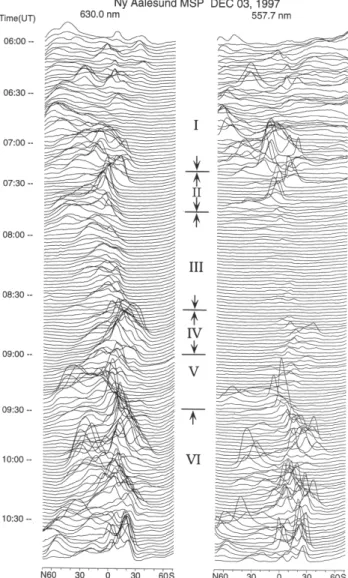
Figure 3 shows stacked plots of the meridian scanning pho-tometer (MSP) observations at 630.0 and 557.7 nm obtained at Ny ˚Alesund during the interval 05:55–11:00 UT on 3 De-cember 1997. These observations illustrate both spatial and temporal variability of the dayside aurora as observed along the local magnetic meridian, within the ∼70–82◦ MLAT
range, as the station rotates with the Earth from morning through midday to postnoon magnetic local times. We note the following features: (i) strong, multiple (latitudinally sep-arated) forms, appearing in both wavelength channels, last-ing until ∼07:20 UT (10:50 MLT; interval I), (ii) one slast-ingle form located close to zenith (both channels), with weaker emission towards north during 07:30–07:50 UT (interval II), (iii) midday gap aurora, characterized by reduced red line in-tensity and very weak green line emission, during the interval
P. E. Sandholt et al.: Detailed dayside auroral morphology 3541
Figure 3 Fig. 3. Meridian scanning photometer (MSP) observations from Ny
˚
Alesund during the interval 05:55–11:00 UT. Left and right columns show stacked plots of line of sight intensity vs. zenith angle for the wavelength channels at 630.0 and 557.7 nm, respectively. Intervals showing different auroral characteristics are marked.
07:50–08:40 UT (11:20–12:10 MLT; interval III), (iv) equa-torward boundary intensifications (EBIs), appearing most prominently in the red line emission, and associated equa-torward expansion during 08:40–09:00 UT (interval IV), (v) poleward boundary intensifications (PBIs) in interval V, and (vi) interval VI (09:30–11:00 UT) characterized by alterna-tively EBIs and PBIs, and associated equatorward and pole-ward expansions of the equatorpole-ward boundary. EBIs and PBIs in interval VI are strong in both emissions. The 2-D as-pects of these activities, shown schematically in Fig. 2, will be documented with all-sky camera (ASC) observations be-low.
The detailed 2-D aspects of the auroral activity within the field of view marked (A) in Fig. 2 have been documented in Farrugia et al. (2003). Different auroral forms from lower to higher latitudes are marked in Fig. 2: (i) pulsed diffuse
aurora (PDA), (ii) discrete forms a and b characterized by eastward (noonward) moving luminosity structures, and (iii) form c. The latter form appears as a sequence of brightening events, each of which is moving westward (antisunward), as indicated by arrow.
The auroral observations during intervals II and III in Fig. 3 are summarized by perspective (B) in Fig. 2. A repre-sentative ASC sequence is shown in Fig. 4. The evolution of the event during this interval (07:34–07:44 UT) shows a brightening appearing in the western part of the field of view, which is followed by rapid eastward expansion dur-ing 07:34–07:38 UT, and then a poleward expansion durdur-ing 07:40–07:44 UT. This 2-phase evolution is marked by ar-rows in Fig. 2. The last image, representing 07:44 UT (lower right), shows the presence of bright forms at the eastern and western boundaries of the FOV, with a “gap” in the center.
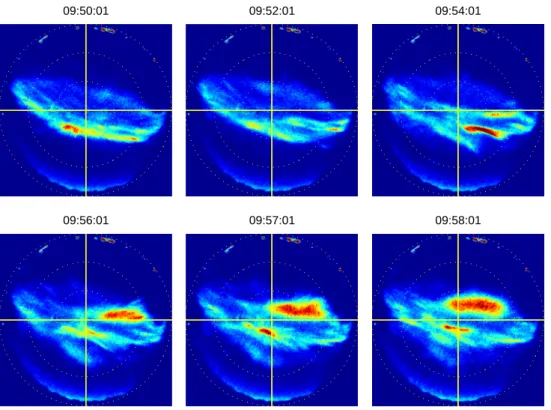
ASC camera observations representing perspective (C) in Fig. 2 are shown in Fig. 5. This figure, represent-ing the interval 09:50–09:58 UT, shows the successive ac-tivation/westward expansion of three latitudinally separated forms. These three forms are referred to as (a) (lowest lati-tude), (b), and (c) (highest latitude) in Fig. 2. A colour-coded contour plot of the meridian scanning photometer data for this event, which nicely confirms the successive activations of the three forms, will be shown below.
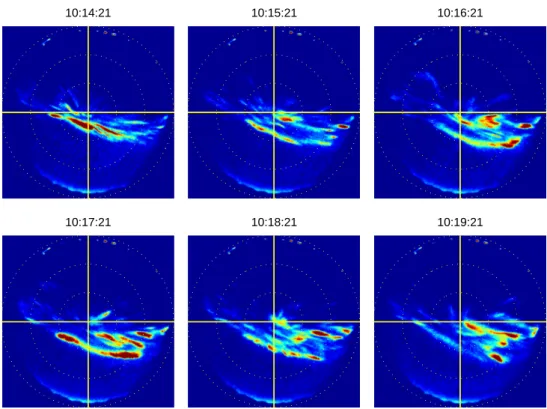
Figure 6 shows the ASC observations at 557.7 nm of the subsequent auroral activation taking place during 10:14– 10:19 UT. We note the high degree of fragmentation, also in the direction along the forms. Brightenings are moving from east to west along these forms which are closely spaced in latitude.
Figure 7 shows the ASC observations at 557.7 nm for the interval 10:25–10:29 UT. While auroral forms (a) and (b) (see Fig. 2) intersect the MSP meridian south of zenith, the highest-latitude form (c) intersects to the north of zenith (to the right in the figure). It is seen that form (c) expanded westward and poleward during this 4-min long interval. At 10:29 UT (right panel) form (c) is brightest on the western side of the local MSP meridian. Thus, form (c) expanded across the MSP field of view (local magnetic meridian) dur-ing the interval 10:26–10:29 UT. This is clearly reflected in the MSP data shown in Fig. 8 (see panel b). This MSP figure is included in order to document the detailed spatio-temporal structure of the aurora, in particular the sequential activations of forms and the equatorward boundary motions. The former phenomenon is most clearly seen during inter-val 09:50–09:58 UT (compare ASC sequence in Fig. 5). The same sequential activation of latitudinally separated forms is seen during the interval 10:20–10:30 UT (compare ASC se-quence in Fig. 7). Intervals characterized by equatorward expansion of the auroral equatorward boundary are 09:35– 09:50 UT and 10:10–10:25 UT. These intervals are separated by a 10-min long interval of weaker auroral intensity, which is accompanied by poleward retraction of the equatorward boundary. The strong brightening event located well to the north of zenith (30–40◦NZ) is our form (c).
07:34:00 07:36:00 07:38:00
07:40:00 07:42:00 07:44:00
Figure 4
Fig. 4. Ny ˚Alesund ASC observations at 630.0 nm during the interval 07:34–07:44 UT on 3 December 1997. The reference frame is zenith angle (dotted circles at 30, 60, and 90◦) and azimuth. The MSP scanning meridian (magnetic meridian) is marked by the vertical yellow line. North is up. West is to the left. The integration time is 2 s.
09:50:01 09:52:01 09:54:01
09:56:01 09:57:01 09:58:01
Figure 5
Fig. 5. Ny ˚Alesund ASC observations at 630.0 nm for the interval 09:50–09:58 UT on 3 December 1997. The reference frame is zenith angle (dotted circles at 30, 60, and 90◦) and azimuth. Same format as in Fig. 4. The integration time is 2 s.
P. E. Sandholt et al.: Detailed dayside auroral morphology 3543 10:14:21 10:15:21 10:16:21 10:17:21 10:18:21 10:19:21 Figure 6 10:25:51 10:27:51 10:29:51 Figure 7
Fig. 6. Ny ˚Alesund ASC observations at 557.7 nm for the interval 10:14–10:17 UT on 3 December 1997. The reference frame is zenith angle (dotted circles at 30, 60, and 90◦) and azimuth. Same format as in Fig. 4. The integration time is 1 s.
10:14:21 10:15:21 10:16:21
10:17:21 10:18:21 10:19:21
Figure 6
10:25:51 10:27:51 10:29:51
Figure 7
Fig. 7. Ny ˚Alesund ASC observations at 557.7 nm for the interval 10:25–10:19 UT on 3 December 1997. Same format as in Fig. 4. The integration time is 1 s.
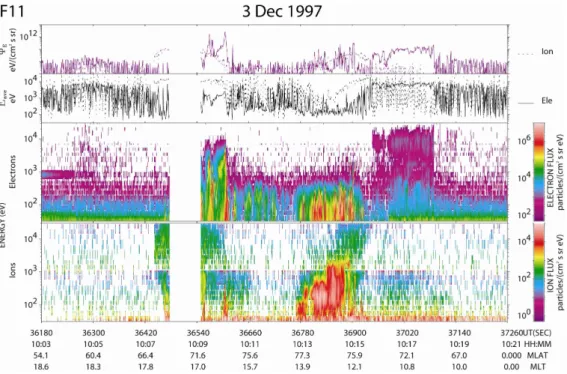
2.1.4 Particle precipitation data from DMSP spacecraft In Figs. 9 and 10 we show particle precipitation data from spacecraft F11 and F14, obtained during the two intervals when the spacecraft recorded precipitation within the FOV of the ground optical instruments or in its vicinity (see Fig. 2). In Fig. 9 we focus on the interval 10:13–10:17 UT, when spacecraft F11 crossed the optical FOV in the ∼11:00– 1400 MLT sector. Vertical guidelines along the satellite track in Fig. 2, representing the interval 10:13–10:17 UT, mark transitions between the following particle regimes: mantle (MA)-low-latitude boundary layer (LL)-BPS-void-CPS. The BPS regime is characterized by two narrow layers of elec-tron precipitation at energy ≤1 keV, centered at 10:15 UT.
This precipitation corresponds to auroral forms marked (a) and (b) in Fig. 2, which, according to the ASC records in Fig. 6, are relatively weaker on the western side of the MSP scanning meridian (near noon), where the satellite in-tersection ocurred, compared with the eastern side. Just after 10:15 UT, when exiting the region of BPS precipitation/arcs, the satellite instrument recorded an abrupt decrease in the precipitation flux. This is the region we call precipitation void, following the notation of Newell and Meng (1994). At
∼10:15:40 UT the spacecraft entered the regime of CPS elec-trons in the prenoon sector.
Between 10:13–10:15 UT two regions of precipitation (ions and electrons) belonging to the LLBL (LL) and mantle (MA) type were traversed. Both regions show electron fluxes
Figure 8a
Figure 8b
Fig. 8. MSP observations from Ny ˚Alesund during the interval 09:30–10:30 UT. The upper and lower panels show the red and green line emissions, respectively. Line of sight intensities are color-coded according to the scale the bottom of each panel.
at energy <300 eV (average energy ∼ 150 eV) and ion fluxes at energy <1 keV. In the first, highest-latitude patch, the ion energy is <500 eV, while in the later, located at ∼76◦MLAT, the ion energy is ≤1 keV. We note that the cusp-type precip-itation recorded at ∼77◦ MLAT (∼10:13:30–10:14:00 UT) corresponds to the aurora located between ∼20–30◦NZ in
Fig. 8 (see the observation geometry in Fig. 2). This is the northernmost auroral form recorded by the MSP in Ny
˚
Alesund. The actual aurora, which we label (c), is particu-larly strong during the intervals 09:55–10:00 UT and 10:27– 10:30 UT, but is also present at reduced intensity at the time when the satellite crossed the MSP meridian, at 10:13:30 UT (Fig. 8). The particle precipitation observed at this time we classify as mantle.
Then we move to the DMSP F14 data shown in Fig. 10. As an introductory remark we note from Fig. 2 that F14 tra-versed two closely spaced arcs, which we mark (a) and (b), within the 75–76◦ MLAT/13:30−15:00 MLT sector during the interval 10:24:30−10:25:30 UT. The particle precipita-tion data show two “patches” of intense fluxes of keV elec-trons corresponding to these auroral forms, which are identi-fied in Fig. 7. The precipitation in these two strong arcs are classified as dayside BPS. The energy spectrum of the elec-tron flux, reaching high levels within the range 0.7–4 keV, is consistent with the strong intensity of the green line emission (∼10 kR), appearing as bright (red) spots in the lower panel of Fig. 8.
After crossing the southernmost arc labelled (a) in Fig. 2 spacecraft F14 went into a region of markedly reduced par-ticle fluxes in the 13:00–14:00 MLT/74–75◦ MLAT sector.
This is the void regime. Thereafter, it entered a broad zone of CPS electrons. The strong fluxes of discrete electrons recorded in the dusk sector between 10:19–10:22:30 UT we called nightside BPS in Fig. 2.
Figure 11 shows particle precipitation data from the dusk-dawn pass of spacecraft DMSP F13 during the interval 10:44–11:02 UT. We shall focus on the double-arc traversed within ∼14:00–15:00 MLT/76–77◦ MLAT at ∼10:49 UT. The satellite track is indicated in Fig. 2. The auroral con-dition at 10:49 UT is very similar to that observed at the time of the F14 pass through the same sector at 10:25 UT. We shall be concerned with the documentation of the parti-cle source of the northernmost postnoon sector auroral form, which we have marked (c). From the present figure we can see that it consists of keV electrons, and that it is well sep-arated from the oval aurora and the R1 current system (see bottom panel of Fig. 11) on its southern side. Thus, our arc (c) is the same phenomenon as that referred to as polar cap arc (PA) by Lyons et al. (1996, 1999). In the present paper we document the morphology and dynamics of this auroral type and we shall be able to place it in the broader context of dayside auroral activity which takes place during magne-topause reconnection events. The electron precipitation is very weak (classed as void) on the poleward side of the po-lar arc, before the satellite entered into the regime of popo-lar rain precipitation in the central polar cap. The discrete au-roral forms corresponding to the precipitation encountered on the prenoon side are those marked (a), (b), and (c) in the schematic Fig. 2.
2.1.5 Ground magnetic deflections
X component magnetic deflections from the Svalbard net-work of IMAGE magnetometer stations (see http://www.geo. fmi.fi/image/) for the interval 05:00–11:00 UT on 3 Decem-ber 1997 are shown in Fig. 12. The stations, ordered from north (76◦MLAT) to south (71◦MLAT), are Ny ˚Alesund (NAL), Longyearbyen (LYR), Hornsund (HOR), Hopen (HOP), and Bear Island (BJN). An interval of quiet con-ditions (absence of magnetic transients) is observed during 07:50−08:30 UT (11:20–12:00 MLT). A series of positive X
P. E. Sandholt et al.: Detailed dayside auroral morphology 3545
Figure 9 Figure 9
Fig. 9. Particle spectrograms and ionospheric ion drift obtained from spacecraft DMSP F13 during the interval 10:03–10:21 UT on 3
Decem-ber 1997. Panels 1 and 2 show differential energy flux for electrons (solid) and ions (dashed) and average energy, respectively. Panels 3 and 4 show color-coded particle spectrograms for electrons and ions, respectively. Panel 5 show ion drift in the horizontal (cross track; violet) and vertical (upward; green) directions.
Figure 10
Fig. 10. Particle precipitation obtained from spacecraft F14 during the interval 10:14–10:32 UT on 3 December 1997. Same format as in the
Figure 11
Fig. 11. Particle precipitation and magnetic deflections obtained from spacecraft F13 during the interval 10:44–11:02 UT on 3 December
1997. Same format as in the previous figure except for the bottom panel which shows two components of magnetic deflection: DBY (blue; along the track) and DBZ (red; normal to the track).
deflections occurred both before and after this interval. These magnetic events are associated with auroral brightenings, some of which are reported above, or in previous studies. Among these are: (i) 05:40–06:00 UT (see Farrugia et al. (2003)), (ii) 07:40 UT (Fig. 4), (iii) 08:50 UT (Fig. 3), (iv) 09:50 UT (Fig. 5), and (v) 10:25–10:30 UT (Fig. 7).
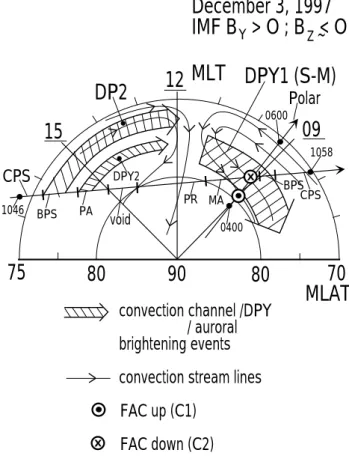
A qualitative sketch illustrating essential features of the equivalent convection pattern derived from the IMAGE mag-netometers on 3 December 1997 is shown in Fig. 13. Three separate channels of strong westward equivalent convection are marked by broad arrows with hatching. These channels correspond to distinct auroral activities in the corresponding sectors. The magnetic activity is strongly pulsed as is the aurora. The channel of strong X-deflection in the 12:00– 16:00 MLT sector (marked DP2) is longitudinally separated from a similar, but weaker channel in the 08:00–11:00 MLT sector (no hatching) by a “gap” in the 11:00–12:00 MLT sector. This “gap” corresponds to the quiet interval (07:50– 08:30 UT) in Fig. 12.
We now turn to the deflection mode labelled DPY1 in Fig. 13, which under the prevailing positive IMF By
con-ditions is strong in the prenoon sector. This is the Svalgaard-Mansurov effect (Svalgaard, 1973, 1975). The field-aligned current system and aurorae associated with this magnetic ef-fect on 3 December 1997 have been reported by Farrugia et al. (2003). We note that the poleward boundary of the
DPY1 effect is not known due to the lack of magnetic sta-tions beyond 76◦MLAT. But from ion drift observations ob-tained during cross polar cap passes by spacecraft DMSP F13 we know that this type of convection channel has a relatively narrow latitudinal extent at the polar cap boundary (see be-low). The FAC system connected to the flow channel in the present case spans the latitude range 75–80◦MLAT (Farru-gia et al., 2003), as indicated in the figure.
Particle precipitation regimes along the DMSP F13 trajec-tory, obtained during the interval 10:46–11:58 UT on this day (see Fig. 11), are indicated in Fig. 13. We note the following features. In the the midday sector (beyond 80◦MLAT) F13 recorded polar rain precipitation, before traversing a zone of mantle (MA) precipitation within 77–80◦ MLAT in the 09:00–11:00 MLT sector. The latter zone, which is typically accompanied by enhanced antisunward convection (speeds within 1–2 km/s), and a corresponding belt of Hall current, is that accounting for the DPY1 magnetic deflection (the Svalgaard-Mansurov effect) marked in Fig. 13.
The northernmost convection channel in the postnoon sec-tor (marked DPY2) corresponds to the auroral form labelled (c) in Fig. 2. In some cases this convection mode (DPY2) is activated while the other (DPY1) is not (see the 09:15– 09:20 UT event in Fig. 12). This event was triggered by the northward rotation of the IMF recorded by Wind at 08:18 UT (Fig. 1). In other cases both DP channels are present, giving
P. E. Sandholt et al.: Detailed dayside auroral morphology 3547
IMAGE magnetometer network 1997-12-03
05 06 07 08 09 10 11 Hour (UT) X-COMPONENT 50 nT 1 minute averages NAL LYR HOR HOP BJN Figure 12
Fig. 12. X component magnetic deflections from the Svalbard
IM-AGE stations, spanning the latitude range from 76◦MLAT (NAL) to 71◦MLAT (BJN). The interval shown is 05:00–11:00 UT on 3 De-cember 1997.
rise to a very wide latitude range of X deflection, such as dur-ing the 10:25–10:35 UT event on 3 December 1997. In gen-eral, DP2 and DPY1 are both activated by southward ings of the IMF, while DPY2 is activated by northward turn-ings. The deflection modes DPY1 and 2 are strongly related to the IMF By polarity. Some of the magnetic deflections
belong to the category of Pc 5 pulsations, which is typical for the closed field line regime in the prenoon sector (see sta-tions HOR-HOP-BJN during the interval 05:00–07:30 UT on 3 December 1997).
2.2 Case 2: 12 December 1999
Although the IMF orientation on 3 December 1997 (case 1) was rather stable and characterized by By>0 and Bz<0,
some variability is observed, which is not ideal in relation to our purpose of distinguishing between temporal and spa-tial structure in the dayside aurora. In an attempt to remove this possible source of ambiguity we searched in our data-base for a day with similar IMF orientation (By>0; Bz<0),
but even more stable conditions than in case 1. We found an almost perfect day in this respect: 12 December 1999.
09
12
70
80
90
80
15
MLAT
0400Polar
75
0600MLT DPY1 (S-M)
DP2
CPS
1046 BPS PA DPY2 PR MA BPS CPS voidDecember 3, 1997
IMF B > O ; B < O
1058 X Y Z~
convection channel /DPY
/ auroral
brightening events
convection stream lines
FAC up (C1)
FAC down (C2)
X
Figure 13
Fig. 13. Schematic illustration of equivalent convection in MLAT/MLT coordinates for IMF Bz<0; By>0 conditions, as
de-rived from the IMAGE chain X component magnetic deflections on 3 December 1997. Three regions of strong magnetic deflec-tion are marked by arrows with hatching. They are labelled DP2 (strongest effect seen in the postnoon sector), DPY1 (the Svalgard-Mansurov effect; strongest in the prenoon sector), and DPY2 (post-noon sector). Trajectories of spacecraft DMSP F13 during the inter-val 10:46–10:58 UT and Polar during the interinter-val 04:00–06:00 UT are indicated.
2.2.1 IMF and solar wind plasma data
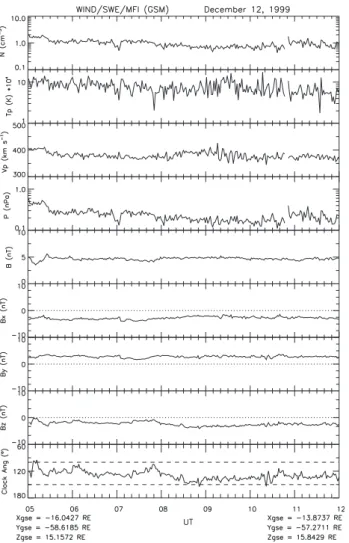
Figure 14 shows solar wind plasma and IMF observations obtained from spacecraft Wind during the interval 05:00– 12:00 UT on 12 December 1999. The positions of Wind at 05:00 and 12:00 UT are (−16.0; −58.6; 15.1) RE and
(−13.8; −57.3; 15.8) RE, respectively. We can see that the
solar wind and IMF conditions are exceptionally stable dur-ing this 7-h long interval. We note the followdur-ing features: (i) solar wind speed at 350–400 km/s, (ii) solar wind dynamic pressure at 0.1–0.2 nPa (well below the average value), (iii)
Bx<0; By>0 (3 nT); Bz<0 (−1, −3 nT), (iv) IMF clock
an-gle generally within the range 120–150◦. Below we will re-port on the spatial-temporal structure of the dayside aurora under this condition, obtained from the ground as the station rotated with the Earth through the prenoon and midday sec-tors during the interval 06:00–10:00 UT.
Figure 14
Fig. 14. Solar wind plasma and IMF observations from spacecraft
Wind during the interval 05:00–12:00 UT on 12 December 1999. Panels from top to bottom shows proton density, bulk speed, tem-perature, solar wind dynamic pressure, the total field intensity and the GSM components (Bx, By, and Bz) of the interplanetary
mag-netic field (IMF), and the clock angle in the GSM Y−Z plane.
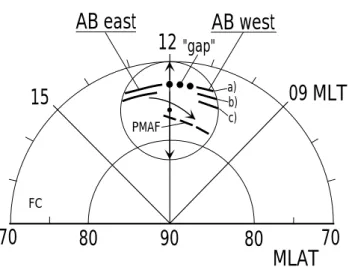
2.2.2 Overview of aurora and polar cap convection Figure 15 shows a schematic overview of essential features of the dayside aurora on 12 December 1999 as derived from the ground perspective in Ny ˚Alesund. ASC fields of view corresponding to two representative intervals of the auroral activities in the prenoon and midday/postnoon sectors, repec-tively, are marked A and B in the figure. The actual time intervals are 07:10–07:30 UT (A), and 09:10–09:25 UT (B). Perspective A shows three latitudinally separated forms in the prenoon sector, labelled (a), (b), and (c). As we shall demonstrate below, these forms are sequentially activated (progressing from lower to higher latitudes) during bright-ening events. Auroral motions are indicated by arrows. The auroral brightenings in the postnoon sector (AB east) typi-cally expand westward and poleward (marked by arrow) be-fore fading (marked by dashed line) in the vicinity of the zenith of the station or even further north. A feature to notice
Figure 15
Fig. 15. Schematic illustration of the dayside auroral configu-ration in the 09:00–14:00 MLT sector, applicable to the interval 07:00–10:00 UT on 12 December 1999, and polar cap convection derived from four DMSP F13 passes during the interval 09:10– 14:30 UT. The coordinate system is MLAT/MLT. The fields of view at 630.0 nm of the MSP and all-sky camera (ASC) in Ny ˚Alesund for 07:20 UT (A), and 09:15 UT (B), are marked by double-arrowed meridional lines and circle, respectively. Track of DMSP spacecraft F13 during the intervals 09:11–09:20, 10:53–11:05, 12:35–12:47, and 14:17–14:26 UT are indicated. Horizontal cross-track ion drifts are marked along the tracks. Hatched areas represent the location of auroral forms. Midday gap aurora is indicated by dotted line.
09
12
70
80
90
80
15
MLAT
70
CPSMLT
CPS BPS PAs PR PMAF MA BPS CPS F13 (0911– 0920)plasma flow lines
convection channel and DPY / aurora "midday gap" aurora
brightening forms CPS BPS PR BPS PA c) b) c) a) b) a) F13 (1235– 1247) B A C Figure 16
Fig. 16. Schematic illustration of auroral observations in relation to
plasma convection for 12 December 1999 (case 2) in MLT/MLAT coordinates. Auroral forms appearing within the FOV of the optical instruments in Ny ˚Alesund are shown by hatching for the following intervals: 07:10–07:30 UT (A), 09:10–09:30 UT (B), and 11:10– 11:30 UT (C). Convection channel on the dawn side of the polar cap is marked by broad arrow. Particle precipitation regimes along two DMSP F13 tracks are indicated.
is that the two separate brightenings (AB west and AB east) appear to occur near-simultaneously (within 1 min).
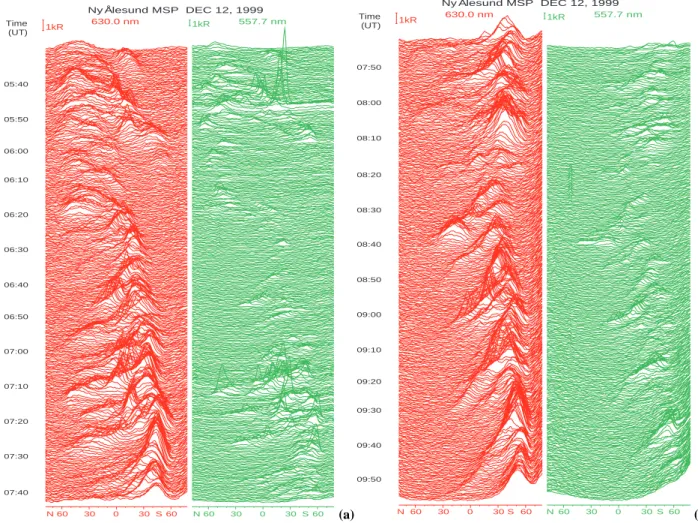
P. E. Sandholt et al.: Detailed dayside auroral morphology 3549 Ny Ålesund MSP DEC 12, 1999 630.0 nm 60 30 0 30 60 N S 1kR 557.7 nm 60 30 0 30 60 N S 1kR 05:40 05:50 06:00 06:10 06:20 06:30 06:40 06:50 07:00 07:10 07:20 07:30 07:40 Time (UT) Figure 17a (a) Ny Ålesund MSP DEC 12, 1999 630.0 nm 60 30 0 30 60 N S 1kR 557.7 nm 60 30 0 30 60 N S 1kR 07:50 08:00 08:10 08:20 08:30 08:40 08:50 09:00 09:10 09:20 09:30 09:40 09:50 Time (UT) Figure 17b (b) Fig. 17. MSP observations from Ny ˚Alesund during the intervals (a) 05:30–07:40 UT and (b) 07:40–09:55 UT. Left and right columns show stacked plots of line of sight intensity vs. zenith angle for the wavelength channels at 630.0 and 557.7 nm, respectively. Same format as in Fig. 3.
The figure also shows cross track ionospheric ion drift ob-tained from four successive DMSP passes across the polar cap on 12 December 1999. These observations are included in order to place the auroral observations in the context of polar cap convection. We place focus on the presence of a 5◦-wide convection channel in the prenoon sector (06:00–
09:00 MLT/75–80◦MLAT) of the polar cap. A rather homo-geneous convection, directed antisunward at moderate speed (≤0.5 km/s), is observed in the center of the polar cap (above 80◦MLAT), where the particle precipitation is of type po-lar rain. A much higher (1–2 km/s) antisunward ion drift is observed within the sector 75–80◦MLAT/07:00–09:00 MLT. Thus, we refer to this as a convection channel. It is marked in the figure by bars along the track (the latitudinal extent) and thick arrows (representing the flow speed component normal to the track). Similar ion drift speeds (2 km/s) in the opposite direction (sunward) are observed equatorward of the sharp convection reversal boundary. The convection reversals are marked along each satellite pass. The reversal during the earliest pass (closest to noon; at 09:45 MLT; 73◦MLAT) is
rather gradual, showing the character of a rotational
rever-sal, while the others (within the 06:00–09:00 MLT sector) are very sharp, indicating a shear reversal. As we shall see below, the channel of strong antisunward convection in the dawn-prenoon sector of the polar cap gives rise to a charac-teristic mode of ground magnetic deflection, often referred to as DPY, or the Svalgaard-Mansurov effect. We note that the convection channel in the 09:00–11:00 MLT sector is ob-served to be colocated with the strong auroral forms labelled (b) and (c).
A summary of the association between features of the dayside auroral structure and plasma convection/DPY mag-netic deflection in the polar cap (DMSP F13 ion drift data and ground magnetograms) for 12 December 1999 (case 2) is given in Fig. 16 which shows auroral forms within the 09:00–16:00 MLT sector by a combination of fields of view representing the time intervals 07:10–07:30 UT (A), 09:10– 09:30 UT (B), and 11:10–11:30 UT (C). Plasma flow lines are drawn on the basis of ion drift data obtained from the four cross polar cap passes of DMSP F13 shown in Fig. 15. The aurora representing 11:10–11:30 UT (marked C in the fig-ure) is included here for completeness, but is not described
08:26:00 08:28:00 08:30:00
08:32:00 08:34:00 08:36:00
Figure 18
Fig. 18. Ny ˚Alesund ASC observations at 630.0 nm for the interval 08:26–08:36 UT on 12 December 1999. The reference frame is zenith angle (dotted circles at 30, 60, and 90◦) and azimuth. Same format as in Fig. 4. The integration time is 2 s.
in detail in this paper. Auroral forms located at different lati-tudes in the pre- and postnoon sectors are labelled (a), (b) and (c). The following particle precipitation zones are marked along two DMSP F13 tracks: CPS (central plasma sheet), BPS (boundary plasma sheet), PAs (polar cap arcs), PR (po-lar rain), MA (mantle), BPS, and CPS. The detailed parti-cle precipitation and ion drift data for these two F13 passes are shown in the next chapter. Equivalent convection in re-gions of DPY magnetic deflections are marked by hatching and arrows. The 12:00–13:00 MLT sector is characterized by classical poleward moving auroral forms (PMAFs) and asso-ciated DPY magnetic transients, while sequential activations of latitudinally separated forms (those marked (a), (b), and (c) and a broad convection channel (and associated DPY de-flection) within 75–80◦MLAT are prominent features in the prenoon sector.
2.2.3 Auroral observations in detail
Figures 17a and b show Ny ˚Alesund MSP observations for the intervals 05:30–07:40 and 07:40–09:55 UT, respec-tively. During the interval 05:30–10:00 UT the ground sta-tion swept through the sector 09:00–13:30 MLT. Early on (05:30–06:20 UT) we find the aurora located mainly to the north of zenith (within 0–60◦NZ). The northernmost form is the prenoon sector form marked (c) in Fig. 16. A strong auroral form (type (a) in Fig. 16) is present in the vicinity of zenith during 05:40–05:50 UT. Then a brightening in the vicinity of zenith at 06:20 UT is followed by a sequence of
similar brightening events. The auroral equatorward bound-ary is migrating equatorward until 07:20 UT.
Particularly strong auroral events, also in the green line, are observed during the interval 07:05–07:30 UT. This au-roral activity appears in the form of sequential activations of the latitudinally separated forms marked (a), (b), and (c) in the schematic Fig. 16. We emphasize that the northern-most aurora observed in the prenoon sector (see MSP inter-val 05:40–07:30 UT) is that referred to as form (c) in the schematic Fig. 16.
The aurora in the MSP meridian plane is particu-larly weak during the interval 08:10–08:30 UT (11:40– 12:00 MLT). Then a sequence of seven classical brighten-ing events/poleward movbrighten-ing auroral forms (PMAFs) is seen between 08:30 and 10:00 UT. Thus, the average recurrence time is 13 min. The 2-D evolution of these events is indicated in the schematic Fig. 15. As an illustration of the 2-D au-rora around the time of the minimum MSP intensity recorded around 08:20–08:30 UT we shall apply the all-sky camera (ASC) sequence shown below.
Figure 18 shows Ny ˚Alesund ASC observations at 630.0 nm for the interval 08:26–08:36 UT. The first image (0826 UT; upper left) shows the very beginning of a bright-ening event. Brightbright-enings in the eastern and western parts of the FOV (slightly south of the station) are separated by a clear “gap” centered slightly to the south-east of the station. The brightening saturates at around 08:34 UT (lower mid-dle). At this time a poleward moving auroral form (PMAF) is seen to advance northwestward, beyond the zenith.
P. E. Sandholt et al.: Detailed dayside auroral morphology 3551
09 MLT
12
70
80
90
80
15
70
MLAT
FC"gap"
AB west
AB east
a) b) c) PMAF0830 UT
Figure 19Fig. 19. Schematic illustration of the auroral brightening event
dur-ing the interval 08:25–08:40 UT on 12 December 1999. The coor-dinate system is MLAT/MLT. Same format as in Fig. 15.
Figure 19 shows a schematic illustration of the aurora within the FOV of the Ny ˚Alesund ASC during the inter-val 08:25–08:40 UT. The coordinate system is MLAT/MLT. The auroral event is characterized by the following fea-tures: (i) the presence of a midday gap aurora in the 11:30– 12:00 MLT sector (marked by dots), separating strong auro-ral forms to the east (postnoon) and west (prenoon), (ii) near-simultaneous auroral brightenings in the eastern (postnoon) and western (prenoon) parts of the field of view (called AB east and AB west), followed by (iii) westward and poleward expansions of a form emanating from the AB east activity. The latter auroral motion is marked by arrow.
As an illustration of the simultaneous nature of the AB east and AB west brightenings, indicated in Figs. 15 and 19, we show in Fig. 20 an ASC sequence for the interval 09:10– 09:13 UT. The first image (upper left; 09:10:30) shows a weak band stretching across the FOV from east to west to the south of the station. The appearance of spots of higher lumi-nosity is seen at the boundary of the FOV in the east and west at 09:11:00 UT (second image). In the following images the spots grow in intensity. These are the postnoon and prenoon brightenings called AB east and AB west in the schematic illustrations. In the last image (lower right; 09:13:30) the two bright spots are well-developed and still separated by a stable band of much weaker emission, the midday gap au-rora. Later on the brightening called AB east (to the right in the image) expanded westward and poleward, as indicated in Figs. 15 and 19. A sharp onset of the brightening is seen in the MSP records when this form (PMAF) entered the MSP field of view at 09:16 UT (see Fig. 17b). This form faded out during the interval 09:25–09:30 UT, 15–20 min after its initial brightening.
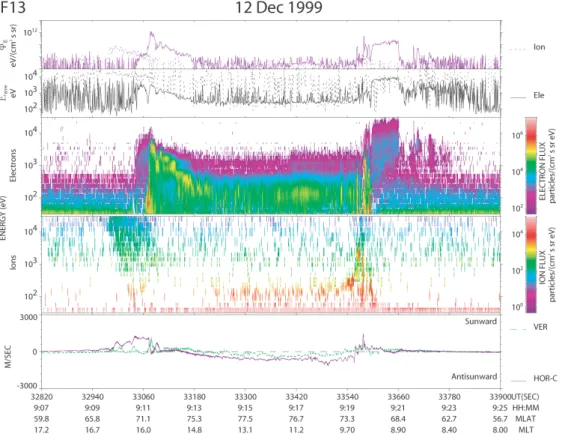
2.2.4 DMSP data: particle precipitation and ion drift
Figure 21 shows electron and ion precipitation data and cross-track ion drift obtained at the time of the DMSP pass during 09:07–09:25 UT. The track is indicated in Figs. 15 and 16. Figure 22 shows electron and ion precipitation data and cross track ion drift obtained during the DMSP pass that took place in the interval 12:35–12:47 UT. The track is indicated in Figs 15 and 16.
From these observations we note the following features: (i) Particle precipitation zones traversed along the track from the dusk side to dawn side, as labelled in Fig. 16 are: CPS (central plasma BPS (boundary plasma sheet)-PA (polar arc)-PR (polar rain)-MA (mantle)-BPS-CPS; (ii) Plasma convection characteristics: (a) central polar cap: ho-mogeneous antisunward flow at typical speeds of 0.6 (09:14– 09:18 UT) and 0.4 km/s (12:37–12:43 UT), accompanied by polar rain precipitation, (b) channel of strong antisunward convection at speeds of 0.5–1.8 km/s at the polar cap bound-ary (75–80◦MLAT) in the 07:00–08:00 MLT sector (second pass in Fig. 16), accompanied by structured electron precip-itation of mantle type, (c) weak (stagnant) flow (cross-track component) at the dusk side of the polar cap, (d) rotational and shear convection reversals on the dawn side, at 10:00 and 07:00 MLT, respectively, and (e) rotational type reversals on the dusk side, both in the 15:00 and 17:00 MLT sectors.
2.2.5 Ground magnetic deflections
Figure 23 shows X component magnetograms from the Sval-bard IMAGE chain for the interval 05:00–10:00 UT on 12 December 1999. The observed magnetic deflections are stud-ied with reference to the schematic Fig. 16. The positive deflections recorded at the highest latitude stations (maxi-mizing at NAL) from 06:20 UT onwards are clear signatures of the DPY mode (the Svalgaard-Mansurov effect). This activity is related to the strong convection channel and au-roral precipitation (auau-roral form (c)) observed at the polar cap boundary in the prenoon sector, as illustrated in Fig. 16. The magnetic transients observed during the interval 07:10– 07:30 UT are events corresponding to the sequential acti-vations of the auroral forms marked (a), (b), and (c) in the schematic figure (see the aurora in Fig. 17a). This is fol-lowed by an interval of little X deflection (07:35–08:00 UT). Then a new regime of positive deflection, maximizing at sta-tion HOR (74◦MLAT), is occurring during 08:00–09:00 UT. Two transient events (positive X deflections maximizing at HOR-LYR) with clear correspondence to auroral brighten-ings/PMAFs are observed during the intervals 09:10–09:25 and 09:35–09:50 UT. The equivalent convection associated with these classical poleward moving events, originating in the postnoon sector, are marked in Fig. 16 by the hatched arrow in the 12:00–13:00 MLT sector.
09:10:30 09:11:00 09:11:30
09:12:00 09:12:30 09:13:30
Figure 20
Fig. 20. Ny ˚Alesund ASC observations at 630.0 nm for the interval 09:10–09:13 UT on 12 December 1999. Same format as in Fig. 4. The integration time is 2 s.
Figure 21
Fig. 21. Particle spectrograms and ionospheric ion drift obtained from spacecraft DMSP F13 during the interval 09:07–09:25 UT on 12
De-cember 1999. Panels 1 and 2 show differential energy flux for electrons (solid) and ions (dashed) and average energy, respectively. Panels 3 and 4 show color coded particle-spectrograms for electrons and ions, respectively. Panel 5 show ion drift in the horizontal (cross track; violet) and vertical (upward; green) directions.
P. E. Sandholt et al.: Detailed dayside auroral morphology 3553
Figure 22
Fig. 22. Particle spectrograms and cross-track ionospheric ion drift obtained from DMSP F13 during the interval 12:30–12:46 UT on 12
December 1999. Same format as in Fig. 21.
3 Summary of observations
The necessary spatial resolution needed to reveal the true spatio-temporal structure of the dayside aurora can only be obtained by ground-based observations. The limitation due to the restricted FOV can be mitigated by combining the spa-tial perspectives provided by single ground instruments when they rotate with the Earth during the day. This technique is particularly relevant for cases when the interplanetary mag-netic field and solar wind dynamic pressure remain fairly steady over extended intervals, allowing a sampling of auro-ral/ionospheric conditions as a function of MLT. When this technique is applied, synoptic views of the dayside aurora, such as that given in Figs. 2 and 16, are obtained. These fig-ures represent the dayside auroral morphology during IMF
Bz<0 and By>0 conditions. The focus in this study is placed
on the spatial structure, in longitude and latitude, of the au-rora and its associated plasma convection/magnetic deflec-tion signatures and particle precipitadeflec-tion.
Outstanding features of the observations, as inferred from both cases, are summarized in the schematic Fig. 24 and listed below:
(I) Longitudinal auroral structure:
It is characterized by active auroral forms (BPS precipitation) in the prenoon (08:00–11:00 MLT) and postnoon (12:00– 16:00 MLT) sectors, separated by a ∼1 h long-interval char-acterized by a deep minimum in auroral intensity/activity
(midday gap aurora) somewhere in the 11:00–13:00 MLT sector. We document that activations of the pre- and post-noon sector forms (called AB west and AB east) occur near-simultaneously (within 1 min) in response to magnetopause reconnection events (see also Sandholt et al., 2004; Sandholt and Farrugia, 2003).
(II) Latitudinal auroral structure:
(i) The postnoon activity, consisting of multiple, latitudi-nally closely separated forms (labelled a, b and c) moving noonwards, are located on sunward convecting field lines. The highest-latitude form (cross-hatched in Figure 24) is re-lated to a convection reversal, possibly associated with a lobe cell, as indicated in Fig. 16. (ii) The activity in the prenoon sector (08:00–11:00 MLT) also consists of latitu-dinally separated forms which we label (A), (B), and (C) (Fig. 24). These auroral forms span a latitude regime charac-terized by a staircase type ion dispersion signature (see F13 data in Fig. 11). (iii) While prenoon form A is located in the regime of sunward convection, form (B) appears close to a rotational convection reversal. (iv) The highest lati-tude form (C) is associated with a channel of strong anti-sunward convection, where mantle type precipitation is ob-served. This aurora appears in the form of a sequence of brightening events well north of zenith of our station in Ny
˚
Alesund (see the interval 05:30–06:20 UT in Fig. 17 a). The high-altitude plasma injections and FACs (observations from spacecraft Polar) associated with this type of auroral
activ-IMAGE magnetometer network 1999-12-12 05 06 07 08 09 10 Hour (UT) X-COMPONENT 50 nT 1 minute averages NAL LYR HOR HOP BJN Figure 23
Fig. 23. X component magnetic deflections from the Svalbard
IM-AGE stations, spanning the latitude range from 76◦MLAT (NAL) to 71◦MLAT (BJN). The interval shown is 05:00–10:00 UT on 12 De-cember 1999.
ity have been documented by Farrugia et al. (2003). Here we demonstrate the association with a plasma flow channel (marked FC in Fig. 24) and the DPY mode of magnetic de-flection, a Svalgaard-Mansurov (S-M) effect. This associa-tion is schematically illustrated in Figs 13, 16, and 24. (v) A pulsating diffuse aurora (PDA) was observed in the 09:00– 10:00 MLT sector, on the equatorward side of the staircase cusp/BPS precipitation (Fig. 2). This is the CPS precipita-tion regime (Newell and Meng, 1994). (vi) PMAFs: While the discrete forms in the 09:00–10:00 MLT sector are mov-ing predominantly eastward (noonward) and westward (an-tisunward) in the BPS and mantle regimes, respectively, the direction of auroral motion in the 10:00–11:00 MLT sector (at the westward boundary of the midday gap) is predomi-nantly poleward, as also marked in Fig. 2. These forms (see Fig. 4) are poleward moving auroral forms (PMAFs) (Sand-holt et al., 1986; Fasel, 1995; Sand(Sand-holt et al., 2004). A second category of PMAFs consists of those appearing as a charac-teristic expansion across the 12:00 MLT meridian of bright-ening events originating in the postnoon sector (form c in Fig. 24). (vii) High-latitude form PA in the postnoon sec-tor: This form (polar arc) is bordered on the poleward side by polar rain (PR) precipitation (Figs. 2 and 11). The
on-Figure 24
Fig. 24. Schematic illustration of the spatio-temporal evolution of
the auroral brightening events. Successive activations of auroral forms in the pre- and postnoon sectors are marked A-B-C and a-b-c, respectively. Auroral motions are indicated by arrows. Polar arc on the dusk side of the polar cap is marked PA. Plasma convec-tion streamlines are superimposed. Plasma flow channel (FC) and associated Svalgaard-Mansurov effect (1X>0) are marked.
set of polar rain started immediately after satellite F13 exited a regime of polar cap arc precipitation on the postnoon side. The latter precipitation (PA) is that causing the postnoon sec-tor auroral form marked (c) in Fig. 2 and crosshatched (PA) in Fig. 24. The associated magnetic deflection is called DPY2 in Fig. 13.
(III) Spatio-temporal structure:
Both the pre- and postnoon sector auroral activities are char-acterized by sequential activations of latitudinally separated forms. The activity is progressing from lower to higher lat-itudes. Thus, forms a-b-c and A-B-C represents different stages of evolution of the individual brightening events.
(IV) Equatorward boundary motions:
The motions of the auroral equatorward boundary observed during the interval 09:30–11:00 UT (see details in Fig. 8) are very similar to those observed in association with IMF north-south rotations by Sandholt et al. (1998). With the present data set we document the detailed 2-D structure of the aurora in such cases (see Figs. 5 and 6). Thus, they are noonward moving brightening structures that are activated at succes-sively higher latititude. The time scale of the equatorward expansions of the equatorward boundary (∼15 min) is sim-ilar to that predicted by the Cowley and Lockwood (1992) model for the ionospheric response to individual bursts of re-connection.
In the discussion below we want to highlight three as-pects of the spatial structure of the dayside aurora and their implications for the solar wind-magnetosphere inter-connection topology and momentum coupling along open field lines, applicable to intervals of southeast IMF orien-tation: (A) The greatest dayside auroral intensity and ac-tivity occur in the prenoon (08:00–11:00 MLT) and
post-P. E. Sandholt et al.: Detailed dayside auroral morphology 3555
Figure 25
Fig. 25. Reconnection topology for a southeast directed IMF. The
Earth’s field (just inside the magnetopause) is indicated. The per-spective is from the Sun towards the Earth. IMF field lines merg-ing with the Earth’s field in different sectors are superimposed. A tilted reconnection line, representing component reconnection at the subsolar, stagnant magnetopause (solid line; segment II) con-nects sectors favourable to antiparallel merging (dashed lines) at higher latitudes in the Southern (prenoon; segment I) and North-ern (postnoon, III) Hemispheres. The stagnation point (magne-tosheath flow) is shifted slightly to the prenoon side of the subsolar point. Regimes in the pre-and postnoon sectors, where strong auro-ral events are observed, as well as the “midday gap aurora” (within 11:00–12:00 MLT), have been marked. The high-latitude magne-topause in the postnoon-dusk and prenoon-dawn sectors are marked IV and V, respectively.
noon (12:00–16:00 MLT) sectors. (B) These auroral inten-sities/activities appear in sharp contrast to the weaker and more stable emission band in the “midday gap” within the
∼11:00–12:00 MLT sector. (C) The high-latitude aurora in the prenoon sector (IMF By>0) is associated with a strong
convection channel/Svalgaard-Mansurov effect.
4 Discussion
4.1 Spatial structure of the dayside aurora: implications for IMF – magnetosphere interconnection topology Figure 25 is a schematic illustration of a magnetopause re-connection topology applicable to our case of southeast IMF orientation (see, e.g. Moore et al., 2002). IMF field lines merging with the Earth’s field in different sectors are indi-cated. While field lines marked I, II, and III are located on the equatorward (upstream) side of the cusp, field lines marked
IV and V are located on the downstream side of the cusp. Favourable sites of near-antiparallel reconnection (Luhmann et al., 1984) in the prenoon (Southern Hemisphere) and post-noon (Northern Hemisphere) sectors are marked by dashed lines in segments I and III, respectively. These sectors on the magnetopause map to sectors in the ionosphere where strong auroral brightening events are observed. The pres-ence of strong field-aligned currents in these regions may be derived from the theory of Sonnerup and Siebert (2003) (see their Fig. 8).
It is our assumption that the midday gap aurora within the 11:00–12:00 MLT sector maps to the stagnant subsolar mag-netopause (Spreiter et al., 1966), marked as II in Fig. 25, where the flow shears at the magnetopause and its transi-tion boundary layer (TBL; Sonnerup and Siebert, 2003) are expected to be low compared to that on the pre- and post-noon flanks. Thus, the stagnant magnetosheath flow may ex-plain the minimum in field-aligned current intensity (Iijima and Potemra, 1978; Potemra and Saflekos, 1979; Weimer, 2001) and auroral intensity observed at the cusp equator-ward boundary around noon. Here we apply the same the-ory of FAC generation by flow shear (viscous stresses) in the open low latitude boundary layer, provided by Sonnerup and Siebert (2003).
The slight shift of the stagnation point towards the prenoon side, as predicted by gas dynamics (Russell et al., 1981), is consistent with our observations of the midday gap aurora and do support our interpretation. In our model of the recon-nection topology (Fig. 25) the subsolar region is character-ized by component reconnection (Moore et al., 2002). The presence of subsolar reconnection may be derived from the polar rain (Fairfield and Scudder, 1985) precipitation extend-ing across the dayside polar cap in such cases, as documented in the DMSP F13 data shown in Figs. 11 and 21 (see also Sandholt and Farrugia, 2003, their Fig. 5).
4.2 Magnetosphere-ionosphere coupling on the down-stream side of the cusp: aurora, plasma convection and field-aligned currents
The high-latitude sector marked IV in Fig. 25 is the site of possible lobe reconnection for our IMF orientation (Reiff and Burch, 1985; Crooker et al., 1998; Eriksson et al., 2003). It is possible that the postnoon-dusk sector auroral form crosshatched in Fig. 24 is an ionospheric manifestation of this process. Related to this we note that lobe reconnection for the actual IMF orientation (southeast) is widely consid-ered to be a summer hemisphere phenomenon (Crooker and Rich, 1993; Weimer, 1995). In order to resolve this issue further study is needed.
The actual aurorae in the 13:00–16:00 MLT sector are lo-cated between the R1 FAC to the south and the regime of polar rain precipitation to the north (see Fig. 11). Similar pre-cipitation features have in previous studies been attributed to lobe reconnection (Eriksson et al., 2002, 2003). The aurora in question may be associated with upward-directed Birke-land current resulting from current-continuity requirements