HAL Id: hal-00295193
https://hal.archives-ouvertes.fr/hal-00295193
Submitted on 24 Jun 2002
HAL is a multi-disciplinary open access
archive for the deposit and dissemination of
sci-entific research documents, whether they are
pub-lished or not. The documents may come from
teaching and research institutions in France or
abroad, or from public or private research centers.
L’archive ouverte pluridisciplinaire HAL, est
destinée au dépôt et à la diffusion de documents
scientifiques de niveau recherche, publiés ou non,
émanant des établissements d’enseignement et de
recherche français ou étrangers, des laboratoires
publics ou privés.
provide insights into the high northern latitude surface
CO inventory
T. Röckmann, P. Jöckel, Valérie Gros, M. Bräunlich, G. Possnert, C. A. M.
Brenninkmeijer
To cite this version:
T. Röckmann, P. Jöckel, Valérie Gros, M. Bräunlich, G. Possnert, et al.. Using 14C, 13C, 18O
and 17O isotopic variations to provide insights into the high northern latitude surface CO inventory.
Atmospheric Chemistry and Physics, European Geosciences Union, 2002, 2 (2), pp.147-159.
�hal-00295193�
www.atmos-chem-phys.org/acp/2/147/
Atmospheric
Chemistry
and Physics
Using
14
C,
13
C,
18
O and
17
O isotopic variations to provide insights
into the high northern latitude surface CO inventory
T. R¨ockmann1,2, P. J¨ockel2, V. Gros2, M. Br¨aunlich2, G. Possnert3, and C. A. M. Brenninkmeijer2
1Max-Planck-Institut f¨ur Kernphysik, Bereich Atmosph¨arenphysik, Heidelberg, Germany 2Max-Planck-Institut f¨ur Chemie, Abteilung Luftchemie, Mainz, Germany
3Uppsala University, Angdtr¨omlaboratoriet, Uppsala, Sweden
Received: 28 January 2002 – Published in Atmos. Chem. Phys. Discuss.: 7 March 2002 Revised: 12 June 2002 – Accepted: 14 June 2002 – Published: 24 June 2002
Abstract. Measurements of the complete isotopic compo-sition of atmospheric CO (13CO,14CO, C17O, C18O) have been carried out at the high northern latitude stations Spits-bergen, Norway, and Alert, Canada. The annual changes of the isotope signatures reflect the seasonally varying contri-butions from the individual CO sources and the OH sink. Short-term variability is small at the remote sampling lo-cations. Nevertheless, the interannual variability is consid-erable, in particular for the summer minimum. The most prominent event was a strong increase in CO in 1998 that persisted for several months. Using the isotope signatures it is possible to clearly identify extraordinarily strong biomass burning during that season as the cause for this large-scale CO anomaly. In 1997, on the other hand, biomass burning emissions were very low, leading to an unusually low sum-mer minimum and corresponding isotope signatures. The re-sults underscore that monitoring of CO and its isotopic com-position at remote high latitude stations is a valuable tool to better understand long-term variations of CO that are repre-sentative for the whole high northern latitude region.
1 Introduction
Carbon monoxide is of considerable importance to the chem-istry of the global atmosphere for several reasons: Foremost, it is the main reaction partner of the hydroxyl radical (OH), which is responsible for the removal of many natural and an-thropogenic contaminants from the troposphere. Because the reaction with CO is responsible for more than half of the total turnover of OH (Crutzen and Zimmermann, 1991), changes in CO can considerably affect mixing ratios of a host of atmo-spheric constituents that are oxidized by OH, including the greenhouse gas methane. In fact, although not being an
ef-Correspondence to: T. R¨ockmann
fective greenhouse gas itself, it has been shown that the emis-sion of five CO molecules is equivalent to the emisemis-sion of one CH4molecule as regards greenhouse warming (Prather,
1996).
In addition to its significance for OH, the reaction CO + OH leads to the formation of HO2 which, depending on
NOx-levels, can lead either to the production (high NOx) or
destruction (low NOx) of ozone. Under high NOxconditions
this pathway is a major contributor to ground level photo-chemical smog.
Through its active role in atmospheric chemistry, CO is also a major player in the global carbon cycle. Most or-ganic compounds – natural or anthropogenic – that are ox-idized in the atmosphere are processed via CO to the stable CO2molecule. This results in a global turnover of about 2 to
3 Pg/y.
A global increase of CO over the past 200 years has been derived from measurements of CO in air bubbles trapped in polar ice (Haan et al., 1996), changes in the so-lar absorption spectra from the 1920s to the 1970s (Rins-land and Levine, 1985) and in situ observations at var-ious atmospheric monitoring stations over the last two decades (Khalil and Rasmussen, 1988, 1990, 1994; Nov-elli et al., 1994a, 1998, 1992). The increase in global CO may have been halted (Khalil and Rasmussen, 1994; Nov-elli et al., 1994a, 1998), and at present the atmospheric CO budget is being examined in considerable detail using various techniques: In situ measurements are carried out on a global scale and impressive observations from satel-lites are becoming available (see e.g. MOPITT home-page athttp://www.atmosp.physics.utoronto. ca/MOPITT/home.html). Computer models are used to refine source scenarios based on the observed CO dis-tribution, using all available information about atmospheric chemistry and physics (Bergamaschi et al., 2000a, 2000b; Granier et al., 1999). An additional method is isotope anal-ysis. The different isotopic signatures provide independent
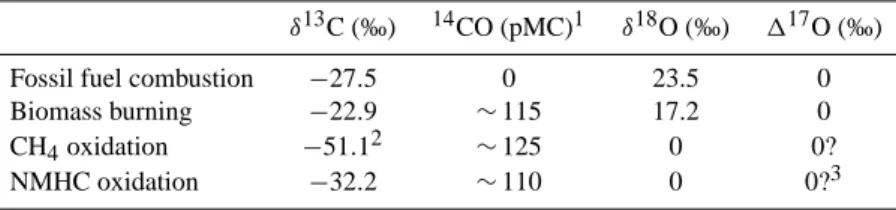
Table 1. The four major sources of atmospheric CO and their isotopic source signatures (see Brenninkmeijer et al., 1999 for references)
δ13C (‰) 14CO (pMC)1 δ18O (‰) 117O (‰)
Fossil fuel combustion −27.5 0 23.5 0
Biomass burning −22.9 ∼115 17.2 0
CH4oxidation −51.12 ∼125 0 0?
NMHC oxidation −32.2 ∼110 0 0?3
1percent Modern Carbon (Stuiver and Polach, 1977)
2updated value taking into account the new determination of the fractionation in CH
4oxidation by OH (Saueressig et al., 2001) 3pathway via ozonolysis of unsaturated hydrocarbons: 25–50‰, see (R¨ockmann et al., 1998a)
variables that can help to resolve the contributions of the in-dividual sources and thus to better understand the global CO budget. The major CO sources and their isotopic source sig-natures are presented in Table 1.
Due to the strong CO sources at the surface and its short chemical lifetime of weeks to months, the mixing ratio and all isotope signatures of tropospheric CO exhibit pronounced temporal and spatial gradients. In this paper, the CO, δ13C, δ18O, 117O and14CO time series from Spitsbergen (79◦N) and Alert (82◦N) are presented, which are our longest CO isotope records for the northern hemisphere. CO mixing ratios are reported in parts per billion (ppb), i.e. 10−9 or nmole/mole. Variations in the stable isotope composition are usually reported in δ- notation as the relative deviation of the ratio of the minor isotope to the abundant isotope, e.g.
13C/12C ≡13R in a sample (SA) from an international
stan-dard (ST) ratio, i.e. δ13C = (13RSA/13RST−1) ∗ 1000‰. In
the case of13C, the standard is Vienna PeeDeeBelemnite (V-PDB), in the case of the oxygen isotopes Vienna Standard Mean Ocean Water (V-SMOW). For17O, it is useful to in-troduce the variable 117O ≡ δ17O −0.52 × δ18O, which is a measure (mathematical approximation) for the excess of
17O above what is expected based on the δ18O value. 14CO
values are reported in molecules per cm3 of air at standard temperature and pressure (Brenninkmeijer, 1993). The activ-ity of the various CO source materials is usually reported in percent Modern Carbon (pMC) (Stuiver and Polach, 1977), and contemporary biomass and organic sources usually have an activity of 120 pMC.
2 Experimental
The air sampling and subsequent CO extraction, conversion and analytical procedures have been extensively described in the literature (Brenninkmeijer, 1993; Brenninkmeijer et al., 2001; Brenninkmeijer and R¨ockmann, 1997, 1998b; Mak and Brenninkmeijer, 1994; R¨ockmann, 1998; Rom et al., 2000). At the sampling stations, 1 m3air samples are com-pressed into 10 L aluminum cylinders (Scott Marrin,
River-side, CA) using modified oil-free three-stage piston compres-sors (RIX industries, Mak and Brenninkmeijer, 1994). The sampling procedure includes low-pressure and high-pressure drying with DrieriteTM to prevent condensation of water in the sample cylinders. Zero tests show that the compressors produce less than 0.6 ppb of CO in the compression pro-cess, and CO levels in the cylinders are stable over months, i.e. change for most cylinders less than 1 ppb. CO is sep-arated from the large air samples using a laboratory extrac-tion system. First, the air is cleaned from condensable com-ponents, in particular CO2, N2O and higher hydrocarbons,
using high-efficiency, high-capacity Russian-Doll cryogenic traps (Brenninkmeijer, 1991). Subsequently, CO in the clean air matrix is oxidized to CO2 on Sch¨utze reagent
(Bren-ninkmeijer and R¨ockmann, 1997; R¨ockmann, 1998; Sch¨utze, 1949; Smiley, 1965) and the CO-derived CO2 is collected
in an all-glass Russian Doll cryogenic trap (Brenninkmeijer and R¨ockmann, 1996). The overall yield is then determined in a calibrated manometer and the CO2sample transferred to
the isotope ratio mass spectrometer (Finnigan MAT 252) for isotope analysis (δ13C and δ18O). After stable isotope deter-mination, the remainder of the sample (> 90%) is recovered for14CO and/or 117O analysis.
This technique is a laborious but absolute method to de-termine the CO mixing ratio in air at ambient levels, i.e. it does not intrinsically require the use of a reference gas (Bren-ninkmeijer et al., 2001). Note that a recent intercomparison exercise has revealed a discrepancy between our absolute CO concentrations measurements and the NOAA/CMDL scale in the low concentration range (< 100 ppb). Thorough tests have established the linearity of our system (Brenninkmeijer et al., 2001), and the NOAA/CMDL scale is presently be-ing examined in detail (P. Novelli, personal communication). Above 100 ppb the scales agree well. The reproducibility of our system is better than 1% routine operation, and the abso-lute precision is better than 2%. The isotopic composition is determined with a standard deviation of ±0.2‰ and ±0.3‰ for δ13C and δ18O, respectively, including sampling, prepa-ration and mass spectrometry.
Accel-6 0 8 0 100 120 140 160 180 200 220
∆∆
17O
δδ
18O
δδ
13C
14CO
CO
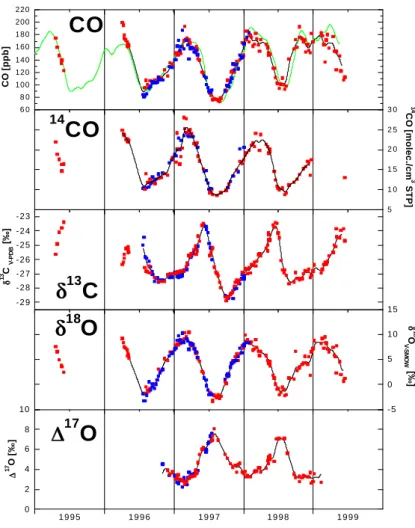
CO [ppb] 5 1 0 1 5 2 0 2 5 3 0 CO [molec./cm14 3 STP] - 2 9 - 2 8 - 2 7 - 2 6 - 2 5 - 2 4 - 2 3 δδ 13 C V-PDB [‰] - 5 0 5 10 15 δδ 18 O V-SMOW [‰] 1 9 9 5 1 9 9 6 1 9 9 7 1 9 9 8 1 9 9 9 0 2 4 6 8 10 ∆∆ 17O [‰]Fig. 1. The complete CO
concentra-tion and isotope record for the two high northern latitude stations Spitsbergen
(Norway, 79◦N) and Alert (Canada,
81◦N). The data have been smoothed
using a low pass Fourier Transform convolution filter excluding variability on a time scale of less than two weeks
(J¨ockel, 2000). In the top panel the
green line is a similar fit applied to data from Spitsbergen determined by the NOAA/CMDL carbon cycle group (P. Novelli, pers. comm.).
erator Mass Spectrometry (AMS) after dilution of the small samples with nearly14C-free CO2and preparation of a target
for AMS from the diluted sample by graphitization (Rom et al., 2000). The overall precision of the experimental proce-dure including sampling, extraction of CO as CO2, dilution,
preparation of a sample for AMS, and AMS measurement amounts to 0.27 molec.cm−3 of air at standard temperature and pressure. An additional error arises due to production of 14CO in the sample cylinders during storage, as recog-nized recently (Lowe and al, 2002). For storage times of the order of months, the neutron capture reaction14N(n,p)14C, followed by oxidation of14C to14CO leads to non-negligible production of14CO in high pressure cylinders even at ground level (Lowe and al, 2002; Mak et al., 1999). The production depends not only on the storage time, but also on altitude, latitude and on the actual storage location. To correct for this effect, the global average14C production rate from (Lin-genfelter, 1963) was normalized to the measured14CO pro-duction rate from a cylinder exposure experiment in Antarc-tica (Mak et al., 1999). The correction amounts to approxi-mately 0.44 molec.cm−3per month of storage at ground level at 80◦N. For our sample cylinders, which are shipped ap-proximately every 2 to 5 months from the sampling stations
and then analyzed within about two weeks when they arrive at the lab, the average correction is 1.1 molec.cm−3.
The17O content of a CO-derived CO2sample cannot be
determined on the CO2molecule directly, because both,13
C-substituted and17O-substituted CO2have molecular mass 45
and cannot be resolved on a conventional isotope ratio mass spectrometer. Therefore, an aliquot of the sample is con-verted to O2using a recently developed two-step conversion
system (Brenninkmeijer and R¨ockmann, 1998a). After con-version, δ17O and δ18O can be determined independently by monitoring the O+2 ions (mass 32, 33 and 34) in the mass spectrometer. Due to a small mass-dependent fractionation during the conversion, the individual δ17O and δ18O values have a reproducibility of only 1 and 2‰, respectively, but as these variations are correlated, 117O can be determined with a standard deviation better than 0.2‰.
3 Data presentation and analysis
The CO concentration and isotope records for the two high northern latitude stations Spitsbergen (Norway, 78.5◦N, 11.5◦W, 475 msl) and Alert (Canada, 81.3◦N, 62.3◦W,
210 msl) are shown in Fig. 1. Sampling at the Zeppelinfjel-let mountain in Ny ˚Alesund, Spitsbergen, started during the spring 1995 and 1996 ARCTOC campaigns (Barrie and Platt, 1997), at that time specifically in search for13CO variations during tropospheric ozone depletion events (R¨ockmann and Brenninkmeijer, 1997; R¨ockmann et al., 1999a) caused by production of extremely depleted CO via the reaction CH4
+ Cl (see Sect. 3.2). From July 1996 to June 1999, weekly samples were taken on a regular basis by the Norwegian Po-lar Institute at the Zeppelinfjellet station. In Alert, sampling started in July 1996 and samples were taken approximately weekly until January 1998.
3.1 Seasonal variation 3.1.1 CO mixing ratio
CO mixing ratios at Spitsbergen and Alert are very simi-lar and exhibit a pronounced seasonal cycle with high val-ues in late winter (≈ 180 ppb) and a minimum in summer (≈ 80 ppb). This strong seasonal cycle is the result of the rel-atively short lifetime of CO of the order of weeks to months. On the one hand this is short enough to produce a strong peak to peak amplitude, on the other hand it is long enough to be only little influenced by short time fluctuations at these remote stations, which results in a rather smooth seasonal-ity. The similarity between the Spitsbergen and Alert record shows that the remote high northern latitudes are well-mixed with respect to CO; several Arctic stations show similar CO mixing ratios throughout the year (Novelli et al., 1994b, 1998). Figure 1a also shows the CO time series from Spits-bergen and Alert from the NOAA/CMDL air-sampling net-work. The data from the two groups show a good agreement. However, the data at the very beginning of our continuous record for Spitsbergen (summer 1996) do not quite capture the seasonal minimum as seen in the record for Alert.
The CO seasonal cycle is to a large degree driven by its main sink, i.e. reaction with OH. When OH levels are low throughout the fall and winter period, CO builds up in the high northern latitude boundary layer, and mixing ratios of about 180 ppb are reached in early spring (Fig. 1a). This CO must originate from the industrial regions at mid-northern latitudes, because there are no in situ CO sources at the high latitudes in winter. Due to reduced convection in the absence of surface heating, mixing with the free troposphere is lim-ited, which results in vertically decreasing CO mixing ratios, as has been established by Conway et al. (1993). Recently, Yurganov et al. (1998) published correlated surface and total column CO mixing ratio measurements revealing that surface values are about 50 ppb higher than average total column val-ues during Arctic winter and spring.
When OH formation starts again after polar sunrise, the main CO sink regains momentum and CO mixing ratios rapidly decline towards the late summer minimum near 80 ppb (Fig. 1a). However, it has already been argued
(R¨ockmann and Brenninkmeijer, 1997) that the in situ de-struction of CO at OH levels below 105molec.cm−3 in
March and April at 80◦N (Spivakovsky et al., 2000) is
in-sufficient to cause this rapid CO destruction. Even in a closed box without any sources, OH levels between 2 and 3 × 10⁵molec.cm−3 would be required to produce the ob-served CO decrease. This confirms that in spring not only chemical destruction causes the fast observed CO decrease. As CO is lower and decreases earlier at lower latitudes, mix-ing with and import of these air masses leads to a dilution of the high northern latitude CO inventory. Thus, CO that was temporarily stored at the high northern latitudes over winter is transported in spring to lower latitudes again where it is eventually removed. Also mixing with the free troposphere leads to a reduction of the wintertime vertical CO gradient over the Arctic, and by the end of May this gradient has dis-appeared and the troposphere is vertically well mixed again as regards CO levels (Yurganov et al., 1998).
During spring and summer, not only the dominant CO sink process gains importance, but also CO emissions from natu-ral sources both direct (e.g. biomass burning) and indirect, via oxidation of hydrocarbons and CH4, increase. The
sea-sonality of these natural CO sources also affects the level of the CO seasonal minimum, which is determined by the com-petition between the CO + OH sink process and the combined contributions from all sources.
3.1.2 14CO
As with the CO record, the14CO time series from Alert and Spitsbergen agree fairly well (Fig. 1b).14CO values peak at about 25 molec./cm3 in late winter and bottom out in sum-mer at values around 9 molec./cm3. The seasonal variations of14CO and CO generally follow a very similar pattern, as OH is their primary sink. However, the similarity of the two seasonal cycles cannot be assumed a priori, because both molecules have a very different source distribution, and it is useful to recall the principle factors that influence14CO abundance before examining the data in detail.
14CO is primarily produced from cosmic radiation in the
lower stratosphere and upper troposphere. This14CO pro-duction has no seasonal component, but it is modulated by the 11-year solar cycle, because the solar wind reduces the ability of galactic cosmic ray particles to penetrate the Earth’s magnetic field. Consequently the production of14CO is high during a solar minimum and low during a solar max-imum. This inverse modulation of14CO production by vari-able solar activity amounts to ± 15% (J¨ockel, 2000). On short time scales, however, primary 14CO production can be regarded as constant and seasonal variations in cosmo-genic14CO at ground level can only result from variations in transport or OH levels. An additional14CO source in the troposphere is biogenic CO, which chiefly stems from oxida-tion of biogenic CH4and VOCs, and from biomass burning.
and the terrestrial and marine biosphere as part of the global carbon cycle, and can therefore be regarded as “recycled”
14C. When assigning a modern14C content of 120 pMC to
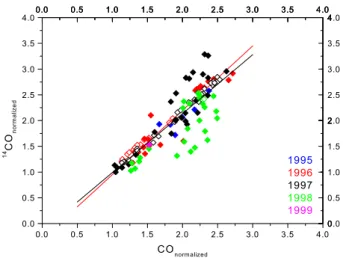
these biogenic sources, 10 ppb of recycled CO corresponds to 0.38 molec./cm3 14CO (Brenninkmeijer, 1993). Note that CO has a higher specific activity than all other atmospheric carbonaceous trace compounds; the14C level ranges from 400 to 1000 pMC. Therefore, an addition of biogenic, i.e. re-cycled CO to the atmospheric CO content primarily increases CO mixing ratios, whereas the effect on14CO is much less. Finally, CO from fossil fuel combustion processes contains no14CO, and thus contamination of a given CO reservoir with CO from that source can significantly change CO levels without direct effect on the14CO concentration, as has been shown repeatedly (Brenninkmeijer, 1993; Gros et al., 2001). To examine relative differences between CO and14CO in the records, we have normalized the14CO and CO values by dividing each measured value by the lowest measured14CO and CO value, respectively, in the record. These normalized data are shown in Fig. 2. Apart from the generally good cor-relation, clear deviations are discernible. In particular the extraordinarily high CO values in the second half of 1998 (see Sect. 3.3.1) show up below the linear fit line. To elimi-nate the influence of the strong 1998 CO anomaly as well as several high14CO values that occurred in 1997, a separate fit has been applied to the 1996 data only, which show relatively little variability. The linear fit through all data has a slope of 1.14 ± 0.05, the slope of the 1996 fit is 1.25 ± 0.10, i.e. the relative annual variation of14CO is significantly larger (15 to 25%) than that of CO itself. Both molecules share the same sink, therefore the difference must be due to dif-ferences in the sources. In summer, the important biogenic CO sources (CH4and VOC oxidation) have a much smaller
effect on14CO than on CO. This addition of biogenic CO occurs during the annual minimum of CO and14CO, and consequently it diminishes the range of annual variation of CO relative to that of14CO, which can result in the observed slope > 1. Thus, the relationship between14CO and CO con-tains interesting information about these difficult to quantify sources, but 3D modeling is needed to investigate this issue in detail.
3.1.3 δ13C
Due to the kinetic isotope effect in the reaction CO + OH, the OH sink induces a variation in δ13C: OH preferentially removes12CO over 13CO, and the remaining CO becomes enriched in13C. The kinetic fractionation is strongly pres-sure dependent and has an average strength of 4 to 5‰ in the lower troposphere (R¨ockmann et al., 1998b; Smit et al., 1982; Stevens et al., 1980). Consequently in spring, when CO levels decrease after the seasonal maximum, δ13C rapidly rises from values of around −27‰ up to −23‰ within three months (Fig. 1c). In contrast to all other signals, however, the springtime trend does not persist throughout the summer
0.0 0.5 1.0 1.5 2.0 2.5 3.0 3.5 4.0 0.0 0.5 1.0 1.5 2.0 2.5 3.0 3.5 4.0 Figure 2 1995 1996 1997 1998 1999 14 CO nor m a liz ed COnormalized 0.0 0.5 1.0 1.5 2.0 2.5 3.0 3.5 4.0 0.0 0.5 1.0 1.5 2.0 2.5 3.0 3.5 4.0 0.0 0.5 1.0 1.5 2.0 2.5 3.0 3.5 4.0 0 2 4 0.0 0.5 1.0 1.5 2.0 2.5 3.0 3.5 4.0 0 2 4 0 2 4
Fig. 2. Normalized14CO values vs. normalized CO. The original
data have been normalized by dividing through the14CO and CO
minimum values. Linear fits are applied to the 1996 data (red line) and to all data (black line).
but reverses already in early June. This reversal of the trend for δ13C must be a due to a source effect. Clearly, this source must be strongly depleted in13C relative to ambient CO so that it can effectively counteract the kinetic fractionation, and it must gain relative importance in summer.
Table 1 shows that CO formed in the oxidation of CH4
via CH4+OH → . . . → CO + products has a source value
of about −52‰, a very low value compared the other major CO sources with δ13C signatures near −27‰, the typical13C value of biomass. With atmospheric CH4levels being nearly
constant at about 1700 ppb, the source strength of CO from CH4oxidation depends on OH levels, i.e. at high northern
latitudes it is negligible in winter and peaks in summer. As explained above, the same applies to the sink of CO. Thus, although much more CO is formed from CH4 oxidation in
summer than in winter, in summer this amount is also quickly removed again. Assuming an atmosphere in which CH4
ox-idation is the only CO source, the CO cycle can be simply described in a box model by
CH4
kCH4+OH
−→ COkCO+OH−→ CO2 (R1)
and the CO mixing ratio is then given as [CO]
[CH4]
=kCH4+OH kCO+OH
(1) Regarding [CH4] as constant, the equilibrium CO
mix-ing ratio is determined by the ratio of the rate constants and is not a function of OH levels. The rate constant kCO+OH = 1.5 × 10−13×(1 + 0.6patm)cm3molec.−1s−1
(DeMore et al., 1997) is dependent on pressure, but shows almost no temperature dependence at atmospheric pressure (Fulle et al., 1996). Therefore, kCO+OH cannot cause
Table 2. kCH4+OHand the equilibrium CO mixing ratio from
oxi-dation of CH4calculated from Eq. (1) assuming 80% CO yield and
disregarding transport. The temperatures selected are typical sum-mer and winter values for Spitsbergen (S. Debatin, pers. comm.)
T(K) kCH4+OH(10
−15cm3molec.−1s−1) [CO]
eq(ppb)
278 (summer) 4.1 23.4
258 (winter) 2.5 14.3
is strongly temperature dependent (kCH4+OH = 2.45 ×
10−12 ×exp(−1775/T) cm3molec.−1s−1, DeMore et al., 1997). Thus the seasonal atmospheric temperature variations do result in lower equilibrium CO mixing ratios in winter than in summer. As CO contributions from different sources can be treated as independent, Eq. (1) still applies to the CH4
derived CO fraction in the natural atmosphere. Thus, the ab-solute amount of CO from in situ CH4oxidation in the
tropo-sphere depends on temperature, as indicated in Table 2, and is higher in summer than in winter at high latitudes.
The degree to which this CH4derived CO affects the
iso-topic composition of the ambient CO inventory, however, is determined by the relative, not the absolute contribution of CH4 derived CO. Given the strong CO seasonality at
high northern latitudes, the relative contribution of CH4
de-rived CO increases considerably from about 8% in winter (14.3 ppb in a total of ≈ 180 ppb CO at the low winter tem-peratures, Table 2) to about 29% in summer (23.4 ppb in a total of ≈ 80 ppb CO at moderate summer temperatures, Ta-ble 2). CH4-derived CO is about 25‰ depleted in δ13C
rel-ative to the ambient CO, and the additional 21% of this CO will deplete the atmospheric CO pool by ≈ 5‰. This deple-tion counteracts the kinetic isotope effect in the reacdeple-tion CO + OH, which itself should lead to an enrichment of ≈ 5‰ for CO decreasing from winter maximum to summer minimum values (ratio of mixing ratios approximately 1/e). Thus, in early summer the increasing fraction of strongly depleted CO from CH4oxidation eventually outweighs the δ13C increase
due to the kinetic isotope effect in the reaction CO + OH, and considerably drives down ambient δ13C values. Apparently
the extent of the depletion due to the CH4oxidation source
is slightly larger than the enrichment due to the kinetic iso-tope effect, as in late summer the overall effect is a moderate depletion of δ13C relative to the late winter values.
In fall and winter, the OH based sink loses importance. Hence, changes in the CO isotopic composition are increas-ingly less influenced by the kinetic fractionation, but rather reflect the input from the sources. During that time, CO sources shift more and more from natural sources towards combustion sources, as witnessed by the δ18O variations (see below). For δ13C, ambient values in fall are close to the ex-pected source signature from combustion sources of −27‰, except for the very clean year 1997 (see Sect. 3.3.2).
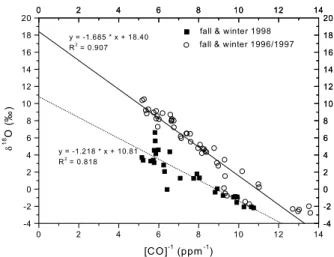
Con-0 2 4 6 8 10 12 14 -4 -2 0 2 4 6 8 10 12 14 16 18 20 y = -1.218 * x + 10.81 R2 = 0.818 y = -1.685 * x + 18.40 R2 = 0.907 Figure 3 δ 18 O ( ‰ ) [CO]-1 (ppm-1)
fall & winter 1996/1997
0 2 4 6 8 10 12 14 -4 -2 0 2 4 6 8 10 12 14 16 18 20 fall & winter 1998
0 2 4 6 8 10 12 14 -4 -2 0 2 4 6 8 10 12 14 16 18 20
Fig. 3. The correlation plot of fall and winter δ18O data versus in-verse CO mixing ratio showing a clear difference between the “nor-mal” years 1996 and 1997, and 1998 with the CO anomaly. The low
y-axis intercept has been found to be indicative of CO from biomass burning in boreal forest regions in several recent studies.
sequently, the δ13C value is relatively constant for the rest of the year until spring, when CO levels decrease again. 3.1.4 δ18O
Even more than δ13C, δ18O is strongly affected by the kinetic isotope fractionation in CO + OH. This reaction involves an inverse isotope effect of about −10‰ for18O, i.e. here C18O is removed 10‰ faster by OH than C16O (R¨ockmann et al., 1998b; Stevens et al., 1980). Accordingly, after the seasonal maximum near 11‰ in early spring, δ18O declines quickly concomitant with the strong CO decline (Fig. 1d). In contrast to δ13C, this trend persists until the end of July. Here the in-creasing CH4-based source has virtually no effect, because
the δ18O value of CH4 derived CO is close to the ambient
summer level. Note, however, that the δ18O values of the CH4and NMHC oxidation sources are not well known yet.
Our first attempt to determine this source signature (Bren-ninkmeijer and R¨ockmann, 1997) is based on an estimate us-ing southern hemisphere isotope data, from which it is clear that δ18O(CO) from CH4oxidation must be low (around 0‰,
cf. Table 1), and a 3-D inverse modeling study (Bergamaschi et al., 2000a) yielded even lower values.
The δ18O seasonal minimum is reached in July/August at values around −3‰. In fall and winter, two processes contribute to the increasing δ18O trend. First, the kinetic fractionation in CO destruction loses importance as OH lev-els decrease. Second, CO sources shift from isotopically light natural sources towards isotopically heavy combustion sources. δ18O is plotted vs. the inverse CO mixing ratios in Figure 3. In a simple two-component system where a back-ground reservoir with δ-value δbg and mixing ratio χbg is
mix-ing ratio χs, the observed delta value is the weighted mean
of the two δ-values
(χbg+χs) ∗ δobs =χbg∗δbg+χs∗δs. (2)
Thus, when δobsis plotted versus (χbg+χs)−1the value of
the y-axis intercept (infinite contamination, i.e. (χbg+χs) →
∞) corresponds to the isotopic signature of the contaminat-ing source δs. Note that kinetic fractionation in the sinks has
been neglected in this calculation, although it is clear that also the contaminating CO will be fractionated in its reac-tion with OH. As the kinetic fracreac-tionareac-tion is negative for
18O, the intercept will actually be a lower limit for the actual
source signature. The linear fit to the fall and winter data from 1996 and 1997 has an intercept at 18.4 ± 0.7‰, only slightly lower than the source signature for high temperature combustion processes (Table 1). Thus the admixture is with fairly unmodified CO from combustion origin. The anoma-lous behavior in 1998 will be discussed in Sect. 3.3.1. In the atmosphere, the strong winter δ18O increase parallels the in-crease in CO mixing ratios. The fundamental difference to the δ13C variations is that in the case of δ18O, the isotopic fractionation caused by the dominant source signature (fos-sil fuel combustion) and the kinetic isotope effect in CO de-struction are in phase, whereas for δ13C they counteract each other.
3.1.5 117O
It has been discovered recently (Hodder et al., 1994; Huff and Thiemens, 1996, 1998; R¨ockmann et al., 1998a, b) that atmospheric CO possesses a significant 17O excess above what is expected based on its18O content. This anomalous fractionation pattern is often referred to as mass-independent fractionation because it deviates from the general mass de-pendent relationship approximated by δ18O = 0.52 × δ17O, which is expected from the established theories for common isotope fractionation. In the case of several atmospheric trace gases, among them CO, a deviation from this relationship has been observed, and the17O excess is quantified in terms of 117O ≡ δ18O −0.52 × δ17O. Figure 1e shows the extent of the17O excess of atmospheric CO at high northern latitudes. The strong seasonal signal is clearly anticorrelated to the CO mixing ratio, and 117O values vary between 2‰ during the winter minimum and 8‰ during the summer maximum.
It has been shown that the mass independent fractionation in atmospheric CO originates from two processes. One is the production of CO from ozonolysis of unsaturated hydrocar-bons (e.g. isoprene) in the atmosphere. The oxygen in the CO product is derived from the ozone precursor, and pos-sesses the strong17O excess (R¨ockmann et al., 1998a) that is also found in O3(Krankowsky et al., 1995). The dominating
effect is however that the fractionation in the CO sink reac-tion with OH is mass independent (R¨ockmann et al., 1998b). As mentioned above, the rate constant for reaction with OH
is 10‰ faster for C18O than C16O. For a strictly mass de-pendent fractionation, the rate constant for C17O should then be about 5‰ faster, but in fact it is only about 1‰ faster, i.e. very close to C16O. Thus, in the reaction with OH the remaining CO accumulates excess 17O with a pseudo-fractionation constant for 117O of 4–5‰ (R¨ockmann et al., 1998b), which is of the right magnitude to explain the atmo-spheric observations (Fig. 1e). Also the shape of the 117O seasonal cycle supports the thesis that the mass independent fractionation in the OH sink is the dominant factor causing the mass independent anomaly. When CO levels decrease in spring, the remaining CO gets progressively enriched in17O and reaches a seasonal maximum when CO mixing ratios are lowest in summer. The total decrease of CO from the win-ter maximum at 180 ppb to the summer minimum at 80 ppb corresponds to a reduction of CO to about 40%, i.e. leaving a fraction of close to 1/e. The concurrent observed isotopic enrichment of about 5‰ is of the right magnitude.
In fall and winter, the reaction with OH loses importance and the atmospheric CO reservoir is topped up with CO pri-marily from combustion sources, which is mass dependently fractionated. This causes the observed decrease in 117O val-ues. Indeed the correlation of 117O versus inverse CO mix-ing ratio reveals that durmix-ing fall and winter the data follow a dilution line that passes through zero, indicative of a dilution by CO with 117O = 0‰ (R¨ockmann et al., 1998a). This is in agreement with our finding that the δ18O value of the winter CO source is close to 23‰, i.e. CO reaching the observatory in winter is isotopically fairly unmodified, and must originate to a large degree from fossil fuel combustion at mid to high latitudes.
3.2 Short term variability
As mentioned above, short term variability is generally small for the two remote sampling locations, but occasionally the data exhibit some short-term deviation from the general sea-sonal cycle. Five day 3D-back-trajectories have been calcu-lated by the Atmospheric Environment Service, Canada, for the 1997 data. Using these, one can relate some CO and iso-topic excursions to air mass origin, and two clear examples will be presented here. The Alert air sample from 20 March 1997 exhibits an extraordinarily low CO mixing ratio. For this data point back trajectory analysis indicates advection of clean northern Atlantic air from lower latitudes (Fig. 4a). Due to the latitudinal CO gradient in winter and spring, ad-vection of air masses from low latitudes should indeed lead to the observed low CO mixing ratio. Furthermore, a concomi-tant slightly low δ18O value, also typical for lower latitudes, is observed.
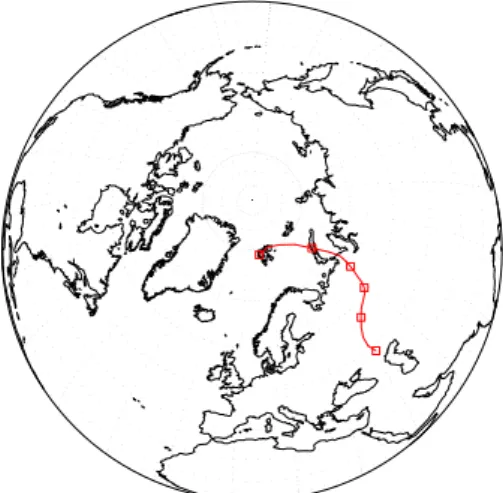
A significant short-term CO increase in the Spitsbergen record occurred on 26 February 1997. The five day back trajectory shows that this air parcel was advected over ma-jor industrialized areas of western Russia (near the Caspian sea) 5 days prior to its arrival at Spitsbergen (Fig. 4b). This
154 T. R¨ockmann et al.: Isotope variations of high northern latitude surface CO
1
Figure 4a
Figure 4b
Fig. 4a. A 5-day back trajectory for the air sampled 20 March 1997
in Alert. Clean air is advected from lower latitudes over the North Atlantic.
Figure 4a
Figure 4b
Fig. 4b. A 5-day back trajectory for the air sampled 26 February
1997 in Spitsbergen. Air is transported over the industrial part of
Russia within few days, and the high CO and δ18O values imply
anthropogenic contamination.
makes anthropogenic contamination a plausible cause of the high CO mixing ratio, and also the δ18O value shows a si-multaneous small elevation in δ18O, indicating contamina-tion from combuscontamina-tion processes. There are several other in-stances of simultaneous CO and δ18O elevations, for which the origin of the excursion is not as readily identifiable. The Alert samples from 17 January, 24 January and 13 February 1997, for example, show small18O elevations. Here, the air parcels passed 5 days before over or near the sparsely pop-ulated north eastern part of continental Russia. A similar trajectory was also derived for other samples that show no obvious contamination (e.g. on 13 February, 22 February or 5 March 1997 for Spitsbergen). Thus, the CO mixing ratio and isotopic composition can be a much more reliable indica-tor for anthropogenic contamination than the trajecindica-tory
cal-culations. Clearly, strong CO contaminations can persist for more than five days in an air mass, and furthermore anthro-pogenic CO sources are often spatially confined to regions that cannot be resolved with trajectory analysis.
On the other hand, the short time variability of the signa-ture that is usually most susceptible to contamination, δ18O, is relatively low in Spitsbergen and Alert for most of the record, apart from the minor deviations as mentioned above. This is in sharp contrast to other sampling stations at lower latitudes (see e.g. Gros et al., 2001), where the18O com-position is often a clear indicator for air mass origin. The absence of strong short time δ18O fluctuations just confirms once more that the high northern latitude stations are remote from major anthropogenic sources. In most cases, the ob-served signatures are not sensitive to the air mass origin. Thus, the data obtained in this study are representative for the entire high northern latitude region.
The short time variability in the14CO record at Spitsber-gen and Alert is particularly strong in winter and early spring. Here, back trajectory analysis is not very conclusive. We speculate that in particular the two very high values in 1997 may have been caused by stratospheric intrusions (Gros et al., 2001) during that time, because in winter the high north-ern latitude14CO background level is already the highest ob-served near the surface, and even higher values can only orig-inate from higher altitudes.
Generally, δ13C values rarely exhibit large scatter because CH4 oxidation, the source with the most prominent δ13C
source signature, shows a very smooth seasonal evolution due to the long CH4 lifetime. The isotopic source values
of the other major sources are close to that of ambient CO, and even large emissions from these sources cannot pro-duce strong δ13C signals, as witnessed during the 1998 CO anomaly (see Sect. 3.3.1). Furthermore, the δ13C latitudinal gradient is not very strong in the northern hemisphere, and consequently large scale advection also has little impact on δ13C.
Nevertheless, there is one interesting class of short term δ13C variations that occurs during polar spring at the Arctic locations. The particular effect has been discussed in detail in R¨ockmann et al. (1999a), and here it is summarized only. We detected characteristic small13C depletions at Spitsber-gen during tropospheric ozone depletion episodes in Arctic spring. During these episodes, surface ozone levels quickly decline from normal levels of about 40 ppb to values below the detection limit for several hours to days (Barrie and Platt, 1997). Concomitant to these O3 depletions, the δ13C
val-ues of CO decrease by several tenths of a permil, and return back to background levels when ozone recovers (see Fig. 2 in R¨ockmann et al., 1999a). These excursions in δ13C are the result of small quantities of CO being formed according to the reaction CH4+Cl → . . . → CO + products during
ozone depletion events, which are associated with elevated halogen radical levels (mostly Br, but also Cl). In addition to CH4being already depleted in13C relative to CO, the large
isotope effect of 70‰ in the reaction CH4 + Cl
(Saueres-sig et al., 1995) leads to formation of CO with a δ13C value that is almost 100‰ below that of ambient CO. Thus, even a small addition of about 1 ppb CO from this source can significantly alter the13C content of the ambient CO con-tent. This effect has not only been shown qualitatively, but the degree of the 13C depletion has been used to estimate the integrated amount of Cl that the air mass must have en-countered. The results imply that Cl levels must have been 3 − 7 × 10⁴molec./cm3over the typical duration of the halo-gen elevations of about three days (R¨ockmann et al., 1999a). Thus, the δ13C excursions are a sensitive measure for Cl lev-els that cannot be measured directly, and the results are in agreement with indirect estimates based on hydrocarbon de-struction patterns (Ramacher et al., 1999).
3.3 Interannual variation 3.3.1 Summer-fall 1998
Superimposed on the typical seasonal cycle, interannual vari-ability is evident in the CO data, especially for the summer minimum, as shown in detail in Fig. 5. The most prominent interannual feature is the elevated and surprisingly narrow CO minimum in 1998. From the beginning of July, CO lev-els do not fall further, and the common minimum values in August are never reached during that summer. Rather, CO already starts increasing rapidly in August 1998, one to two months earlier than in the other years, and then shows an el-evation of 20 to 50 ppb for several months. Recalling that the atmosphere at high northern latitudes is well mixed in summer, such a persistent CO excess cannot be a local phe-nomenon but rather reflects a large-scale CO anomaly in the entire high northern latitude region. Five-day back trajec-tories calculated for the samples during this period do not show a common air mass origin, which further indicates that the observed CO elevation was a large-scale phenomenon. On the other hand, no similar elevations have been detected at our mid-latitude sampling station Mount Sonnblick in the Austrian Alps (Gros et al., 2001); thus the effect appears to be confined to the high northern latitudes.
Interestingly, the strong CO elevation in summer 1998 even leads to a double shoulder during the 1998/1999 sea-sonal maximum. This feature is indicative of an additional strong CO source that is out of phase with the CO seasonal cycle, and it is clearly discernible both in our data and the NOAA/CMDL data. After the quick rise in August, mixing ratios actually decrease again in November, when CO usually increases due to low OH levels. The decrease must be due to dynamics, i.e. dilution of the CO excess by mixing with air from lower latitudes. The double shoulder in the observa-tions confines the duration of the additional CO source to a period between July and November 1998, slightly delayed to the typical biomass burning season between May and Octo-ber. During the spring 1999 maximum, values have
recov-Jan Apr Jul Okt
60 80 100 120 140 160 180 200 220 1995 1996 1997 1998 1999 C O ( p pb) sampling date
Jan Apr Jul Okt
60 80 100 120 140 160 180 200 220 60 80 100 120 140 160 180 200 220 Figure 5 60 80 100 120 140 160 180 200 220
Fig. 5. Seasonal cycles of the CO mixing ratio for each individual
year of the study. The anomaly in 1998 is prominent.
ered almost entirely and are only slightly above the maxi-mum in 1998.
Among the major CO sources, large scale biomass burn-ing is the only one that can be expected to produce such vast quantities of CO for extended periods of time. Indeed, 1998 was an extreme fire year throughout the high north-ern latitude boreal forest region and the extent of biomass burning even reached catastrophic dimensions in some parts. With a total of 4.7 million hectares burnt in Canada, 1998 is among the five worst years regarding forest fires, whereas only 625 000 and 1.9 million hectares were burnt by wildfires in 1997 and 1996, respectively, the two other burning seasons covered by our study (Johnston, 1999). For Russia, only 2.65 million hectares of burnt forest have been officially reported in 1998, but recent satellite imagery has exposed that the ac-tual area burnt in Russia in 1998 may have been as high as 10 million hectares (Kasishke et al., 1999). In the three major regions (Khabarovsk, Amur, Sakhalin Island), 4% of the en-tire land area burned. Furthermore, the satellite observations revealed that most of these fires were crown fires, which have recently been shown to emit particularly high amounts of CO (Cofer III et al., 1998). In 1998, boreal forest fire emis-sions were detected even in the stratosphere: A substantial increase in aerosols stemming from boreal forest fires was detected in the stratosphere during the biomass burning sea-son between May and October at latitudes between 55◦N and 70◦N (Fromm et al., 2000). It has been shown that CO from
biomass burning can significantly influence atmospheric CO mixing ratios in Russia on large scales (Bergamaschi et al., 1998; Crutzen et al., 1996; R¨ockmann et al., 1999b), that CO from Canadian forest fires can affect concentrations even in the southern United States (Wotawa and Trainer, 2000) and in the free troposphere above northwestern Europe (Forster et al., 2001; Waibel et al., 1999), and that forest fires can increase the entire CO column over Russia (Yurganov et al., 1997). Thus, fire activity in the boreal forests of North
Amer-ica and Asia has far-reaching effects on tropospheric CO lev-els in the whole high northern latitude region, and a recent evaluation of the NOAA/CMDL data shows a clear correla-tion of summer CO minima and biomass burning (Wotawa et al., 2001). Both the NOAA/CMDL data and our data show that these high CO levels can persist for several months in the entire northern part of the globe.
The 18O isotope data clearly confirm that the 1998 CO elevation observed in Spitsbergen was due to a particularly strong CO biomass burning contamination. At first sight, relatively little interannual variability is observed in the δ18O data (Fig. 1d). The strong CO anomaly of 1998 is accompa-nied by only a minor increase in δ18O. However, the corre-lation of δ18O vs. 1/[CO] for 1998 yields a source signature of 10.8 ± 0.9‰ (Fig. 3) much lower than in the other years. As discussed above, the intercept is actually a lower limit on the source signature, as the kinetic isotope fractionation in the OH based sink has been disregarded in Eq. (2), but the value clearly points to biomass burning. The intercept near 11‰ compares well with results from Siberia derived for both strong (Bergamaschi et al., 1998) and lesser contamina-tion (R¨ockmann et al., 1999b) with CO from biomass burn-ing. Recent laboratory experiments (Kato et al., 1999) have shown that the δ18O value of CO emitted during biomass burning depends on the fire conditions, and is lower during the smoldering phase when CO emissions are highest, than the burning phase. Our data can also be compared to results from a recent inverse modeling exercise (Bergamaschi et al., 2000a) where source signatures for biomass burning were generally found to be around 10‰. However, this study pre-dicted even lower values for biomass burning north of 30◦N,
in some scenarios even around 0‰, which is not supported by our data.
Note that in Fig. 3 a few of the δ18O data points from the 1996/1997 seasons fall on the line that is defined by the 1998 data. Figure 5 shows that during August and Septem-ber 1996, CO summer values are higher than the 1997 data. Actually, it is exactly these data which fall on the “biomass burning-influenced” linear regression line of the 1998 data in Fig. 3. Although the effect is much smaller than in 1998, this indicates that also the slightly elevated CO values in 1996 were caused by biomass burning in the northern boreal for-est. Thus, biomass burning has a critical influence on sum-mer minimum CO values at high northern latitudes, as has been shown by (Wotawa et al., 2001). δ18O is a good indi-cator to detect year-to-year variability of CO emissions from boreal forest burning at high latitudes.
From the two complete seasonal cycles now available we can for the first time examine the interannual variability of 117O. As explained above, the seasonal cycles of CO and 117O are anticorrelated, because the major sink of CO (reac-tion with OH) is the major source for 117O. This behaviour is now even evident in the interannual pattern. The 1998 summer 117O maximum is both much lower and more nar-row than in 1997, the opposite behavior than observed for
the CO mixing ratio (Fig. 1). Furthermore, as soon as the strong anomalous increase of CO starts in 1998, the 117O values show a concurrent strong decrease, and the entire win-ter 1998/1999 minimum is slightly lower than in 1997/1998. This again confirms that the large CO elevation observed in the second half of 1998 is caused by mass dependently frac-tionated CO, in agreement with the above explanation that this CO originates from biomass burning.
3.3.2 Summer 1997
The second most significant interannual phenomenon is the exceptionally low and wide summer CO minimum in 1997, reaching values of merely 75 ppb. This feature also persisted for several months, indicating that these levels were char-acteristic for the entire high northern latitudes in summer 1997. The most likely cause of the low summer minimum is that 1997 was indeed an exceptionally clean year regarding CO source emissions, which is supported by official statistics showing that biomass burning was low throughout the Rus-sian and North American boreal forest in 1997 (Johnston, 1999; Kasishke et al., 1999; Wotawa et al., 2001). The 1997 CO anomaly has a large effect on the δ13C signature dur-ing summer 1997, when δ13C values reach almost −29‰. As shown above, the δ13C minimum is primarily determined by the relative fraction of CH4 derived CO in the total CO
reservoir. Due to the exceptional source signature (Table 1), small deviations in this fraction can lead to significant iso-topic shifts. The absolute amount of CH4derived CO,
how-ever, should not exhibit large interannual variation as it only depends on temperature (see above). In 1997, concomitant to δ13C also CO mixing ratios were low (Fig. 5), Thus, the ab-solute amount of CO from sources other than CH4oxidation
must have been lower in 1997 than in the other years, and the relative fraction of CH4derived CO was consequently higher,
causing the observed low δ13C minimum. More quantita-tively, the seasonal CO minimum was about 85 ppb in 1996 and 75 ppb in 1997. Keeping the absolute amount of the CH4
derived CO constant at 23.4 ppb (Table 2), the relative con-tribution from this strongly depleted source was about 27.5% in 1996 and 31.2% in 1997, a change of ≈ 4%. As the source signature of the CH4derived CO is about 25‰ lower than
ambient values, this is of the right magnitude to explain the δ13C depletion of 1–1.5‰ during the 1997 minimum.
For δ18O, the additional isotopic depletion that occurs for δ13C in summer 1997 is hardly recognizable. This does not come as a surprise, because the δ18O value of CH4derived
CO is close to ambient summer levels. For δ18O the main ef-fect is not the different relative amount of CO from CH4
oxi-dation, but the fact that CO has been broken down to slightly lower levels in 1997. However, the difference barely dis-cernible above the experimental error. As regards14CO, the summer minimum in 1997 is low, as observed for the CO data. Although the signal is too small to be evaluated quanti-tatively, this qualitatively supports the above interpretation
that the excess CO observed in other years was produced from biogenic sources.
The 1997 summer 117O maximum was very high with values reaching up to 8‰ when CO mixing ratios were ex-traordinary low. This is in line with the finding that the OH based sink is largely responsible for the seasonality in 117O, i.e. in 1997 the CO reservoir was reduced by OH to lower values than in 1998, and thus the remaining CO obtained a higher17O anomaly.
4 Conclusions
The time series of CO mixing ratio and isotopic composi-tion from Spitsbergen and Alert are virtually indistinguish-able, showing that the high northern latitudes are a well-mixed reservoir as regards CO. This is confirmed by the relatively smooth seasonality of all signatures with only few occurrences of significant short time variability. Mixing of air between the mid and high northern latitudes plays an im-portant role for the high northern latitude CO seasonal cycle. In winter, large amounts of CO from combustion processes are transported north from the industrial regions. In spring, the observed rapid decline of CO cannot be due to in situ chemical destruction alone, but is also affected by transport down to lower latitudes again and/or vertical exchange with the free troposphere.
A particularly strong, persistent CO elevation of 20 to 50 ppb occurred from July to November 1998. The δ18O iso-tope signature clearly identifies biomass burning as source of the massive source. This independent isotope evidence is in agreement with the reports about unusually strong forest fire activity throughout the boreal forest region in 1998, and it underscores the crucial role of biomass burning for the CO summer minimum at high latitudes (Wotawa et al., 2001). The additional CO from the forest burning leads to strongly elevated CO mixing ratios in the entire high northern latitude region for several months.
Summer 1997, on the other had, was extremely clean as re-gards CO mixing ratios, which also shows up in the isotope signatures. Again, the δ18O data indicate that the difference in the CO seasonal minimum between 1996 and 1997 was also due to biomass burning. Thus, biomass burning has a critical effect on summer minimum CO values at high north-ern latitudes, and it can be detected using the δ18O signature. The data presented here show that monitoring of the isotopic composition of CO at Alert and Spitsbergen provides inde-pendent information on the causes of interannual variability of CO in the northern hemisphere.
Acknowledgements. This work would not have been possible with-out the help of many people at the sampling stations in Spitsbergen and Alert, and we thank Torr Ivan Karlsen, Jan H. Wasseng, Chris R. Lunder and Jan-Ivar Tangen from the Norwegian Institute of Air Research and Kim Holmen from the University of Stockholm, and Korb Whale, Jacinta McNairn, Geoff Jones, Steve Mercer, Peter
Ayranto and Christian Piller from the Alert station. Ingeborg Levin from the University of Heidelberg was very helpful in setting up the air sampling in Alert. We also thank Doug Worthy and Vic-toria Hudec from the Atmospheric Environment Service, Toronto, Canada, for calculation of the back-trajectories. We are grateful to Paul Novelli for providing the records of CO mixing ratios from Alert and Spitsbergen from the NOAA/CMDL network.
Temper-ature data from Ny ˚Alesund were kindly provided by Siegrid
De-batin from the Alfred Wegner Institute in Potsdam, Germany. The European Commission supported the CO-OH-Europe project under grant ENV4-CT96-0318 and the Marie Curie Fellowship of V. Gros under grant EVK2-CT-1999-50003.
References
Barrie, L. A. and Platt, U.: Arctic tropospheric chemistry: An overview, Tellus, 49B, 450–454, 1997.
Bergamaschi, P., Brenninkmeijer, C. A. M., Hahn, M., R¨ockmann, T., Scharffe, D. H., and Crutzen, P. J.: Isotope analysis based source identification for atmospheric CH4and CO across Russia
using the Trans-Siberian railroad, J. Geophys. Res., 103, 8227– 8235, 1998.
Bergamaschi, P., Hein, R., Brenninkmeijer, C. A. M., and Crutzen, P. J.: Inverse modeling of the global CO cycle: 2. Inversion of13C/12C and18O/16O isotope ratios, J. Geophys. Res., 105, 1909–1927, 2000a.
Bergamaschi, P., Hein, R., Heimann, M., and Crutzen, P. J.: Inverse modeling of the global CO cycle: 1. Inversion of CO mixing ratios, J. Geophys. Res., 105, 14 531–14 546, 2000b.
Brenninkmeijer, C. A. M.: Robust, high efficiency, high-capacity cryogenic trap, Anal. Chem., 63, 1182–1184, 1991.
Brenninkmeijer, C. A. M.: Measurement of the abundance of14CO
in the atmosphere and the13C/12C and18O/16O ratio of atmo-spheric CO, with application in New-Zealand and Antarctica, J. Geophys. Res., 98, 10 595–10 614, 1993.
Brenninkmeijer, C. A. M., K¨oppel, C., R¨ockmann, T., Scharffe, D. S., Br¨aunlich, M., and Gros, V.: Absolute measurement of the abundance of atmospheric carbon monoxide, J. Geophys. Res., 106, 10 003–10 010, 2001.
Brenninkmeijer, C. A. M. and R¨ockmann, T.: Russian doll type cryogenic traps: Improved design and isotope separation effects, Anal. Chem., 68, 3050–3053, 1996.
Brenninkmeijer, C. A. M. and R¨ockmann, T.: Principal factors de-termining the18O/16O ratio of atmospheric CO as derived from observations in the southern hemispheric troposphere and lower-most stratosphere, J. Geophys. Res., 102, 25,477–25 485, 1997. Brenninkmeijer, C. A. M. and R¨ockmann, T.: A rapid method for
the preparation of O2from CO2for mass spectrometric analysis of17O/16O ratios, Rap. Commun. Mass Spectrom., 12, 479–483, 1998a.
Brenninkmeijer, C. A. M. and R¨ockmann, T.: Using isotope anal-ysis to improve atmospheric CO budget calculations, in: Inter-national Symposium on Isotope Techniques in the Study of Past and Current Environmental Changes in the Hydrosphere and the Atmosphere, (Ed) Murphy, P., 69–77, International Atomic En-ergy Agency, Vienna, Austria, 1998b.
Brenninkmeijer, C. A. M., R¨ockmann, T., Br¨aunlich, M., J¨ockel, P., and Bergamaschi, P.: Review of Progress in Isotope Studies of
Atmospheric Carbon Monoxide, Chemosphere: Global Change Science, 1, 33–52, 1999.
Cofer III, W. R., Winstead, E. L., Stocks, B. J., Goldammer, J. G., and Cahoon, D. R.: Crown fire emissions of CO2, CO, H2, CH4,
and TNMHC from a dense jack pine boreal forest fire, Geophys. Res. Lett., 25, 3919–3922, 1998.
Conway, T. J., Steele, L. P., and Novelli, P. C.: Correlations among
atmospheric CO2, CH4and CO in the Arctic, March 1989,
At-mos. Environ., 27, 2881–2894, 1993.
Crutzen, P. J., Golitsin, G. S., Elansky, N. F., Brenninkmeijer, C. A. M., Scharffe, D., Belikov, I. B., and Elokhov, A. S.: Observations of minor impurities in the atmosphere over the Russian territory with application of a railroad laboratory car, Dok. Russ. Acad. Sciences, 351, 1289–1293, 1996.
Crutzen, P. J. and Zimmermann, P. H.: The changing photochem-istry in the troposphere, Tellus, 43, 136–151, 1991.
DeMore, W. B., Sander, S. P., Golden, D. M., Hampson, R. F., Kurylo, M. L., Howard, C. J., Ravishankara, A. R., Kolb, C. E., and Molina, M. J.: Chemical kinetics and photochemical data for use in stratospheric modeling, JPL Publication, 12, 1997. Forster, C., Wandinger, U., Wotawa, G., James, P., Mattis, I.,
Althausen, D., Simmonds, P., O’Doherty, S., Jennings, S. G., Kleefeld, C., Schneider, J., Trickl, T., Kreipl, S., Jager, H., and Stohl, A.: Transport of boreal forest fire emissions from Canada to Europe, J. Geophys. Res., 106, 22 887–22 906, 2001. Fromm, M., Alfred, J., Hoppel, K., Hornstein, J., Bevilacqua, R.,
Shettle, E., Servranckx, R., Li, Z., and Stocks, B.: Observa-tions of boreal forest fire smoke in the stratosphere by POAM III, SAGE II, and lidar in 1998, Geophys. Res. Lett., 27, 1407– 1410, 2000.
Fulle, D., Hamann, H. F., Hippler, H., and Troe, J.: High-pressure range of addition reactions of HO. II. Temperature and pressure
dependence of the reaction HO + CO ↔ HOCO → CO2, J.
Chem. Phys., 105, 983–1000, 1996.
Granier, C., M¨uller, J. F., P´etron, G., and Barsseur, G.: A three-dimensional study of the global CO budget, Global Change Sci-ence, 1, 255–261, 1999.
Gros, V., Br¨aunlich, M., R¨ockmann, T., J¨ockel, P., Bergamaschi, P., Brenninkmeijer, C. A. M., Rom, W., Kutschera, W., Kaiser, A., Scheel, H. E., Mandl, M., v. d. Plicht, J., and Possner, G.: Detailed analysis of the isotopic composition of CO and charac-terization of the air masses arriving at Mt. Sonnblick (Austrian Alps), J. Geophys. Res., 106, 3179–3193, 2001.
Haan, D., Martinerie, P., and Raynaud, D.: Ice core data of atmo-spheric carbon monoxide over Antarctica and Greenland during the last 200 years, Geophys. Res. Lett., 23, No. 17, 2235–2238, 1996.
Hodder, P. S., Brenninkmeijer, C. A. M., and Thiemens, M. H.: Mass independent fractionation in tropospheric carbon monox-ide, ICOG proceedings, US Geological Circulair 1107, 1994. Huff, A. K. and Thiemens, M. H.: Multiple stable isotope analysis
of atmospheric carbon monoxide: Continuing source identifica-tion using a mass independent anomaly, in Eos Trans. AGU, Fall Meet. Suppl. Abstracts, pp. F124, San Francisco, 1996. Huff, A. K. and Thiemens, M. H.: 17O/16O and18O/16O isotope
measurements of atmospheric carbon monoxide and its sources, Geophys. Res. Lett., 25, 3509–3512, 1998.
J¨ockel, P.: Cosmogenic14CO as tracer for atmospheric chemistry and transport, Ph.D. thesis, Universit¨at Heidelberg, thesis
electronically available at
http://www.ub.uni-heidelberg.de/archiv/
1426, Heidelberg, 2000.
Johnston, T.: Canada Report, International Forest Fire News, 20, 1999.
Kasishke, E. S., Bergen, K., Fennimore, R., Sotelo, F., Stephens, G., Janetos, A., and Shugart, H. H.: Satellite imagery gives clear picture of Russia’s boreal forest fires, EOS Transactions of the American Geophysical Union, 80, 141–147, 1999.
Kato, S., Akimoto, H., R¨ockmann, T., Br¨aunlich, M., and Bren-ninkmeijer, C. A. M.: Stable isotopic compositions of carbon monoxide from biomass burning experiments, Atmosph. Envi-ronm., 33, 4357–4362, 1999.
Khalil, M. A. K. and Rasmussen, R. A.: Carbon monoxide in the earth’s atmosphere: indications of a global increase, Nature, 332, 242–245, 1988.
Khalil, M. A. K. and Rasmussen, R. A.: Atmospheric Carbon Monoxide: Latitudinal Distribution of Sources, Geophys. Res. Lett., 17, 1913–1916, 1990.
Khalil, M. A. K. and Rasmussen, R. A.: Global decrease in atmo-spheric carbon monoxide concentration, Nature, 370, 639–641, 1994.
Krankowsky, D., Bartecki, F., Klees, G. G., Mauersberger, K., Schellenbach, K., and Stehr, J.: Measurement of heavy iso-tope enrichment in tropospheric ozone, Geophys. Res. Lett., 22, 1713–1716, 1995.
Lingenfelter, R. E.: Production of carbon 14 by cosmic-ray neu-trons, Rev. Geophys., 1, 35–55, 1963.
Lowe, D. C., Levchenko, V. A., Moss, R. C., Allan, W., Brailsford, G. W., and Smith, A. M.: Assessment of storage correction re-quired for in situ14CO production in air sample cylinders, Geo-phys. Res. Lett., 29, 10, 1029, 2002.
Mak, J. E. and Brenninkmeijer, C. A. M.: Compressed air sample technology for isotopic analysis of atmospheric carbon monox-ide, J. Atmos. Oceanic Technol., 11, 425–431, 1994.
Mak, J. E., Brenninkmeijer, C. A. M., and Southon, J. R.: Direct measurement of the production rate of14C near the Earth’s sur-face, Geophys. Res. Lett, 26, 3381–3384, 1999.
Novelli, P., Masarie, K. A., Tans, P. P., and Lang, P. M.: Recent changes in atmospheric carbon monoxide, Science, 263, 1587– 1589, 1994a.
Novelli, P. C., Collins, Jr., J. E., Myers, R. C., Sachse, G. W., and Scheel, H. E.: Re-evaluation of the NOAA/CMDL carbon monoxide reference scale and comparisons with CO reference gases at NASA-Langley and the Fraunhofer Institut, J. Geophys. Res., 99, 12 833–12 839, 1994b.
Novelli, P. C., Masarie, K. A., and Lang, P. M.: Distribution and recent trends in carbon monoxide in the lower troposphere, J. Geophys. Res., 103, 19 015–19 033, 1998.
Novelli, P. C., Steele, L. P., and Tans, P. P.: Mixing ratios of car-bon monoxide in the troposphere, J. Geophys. Res., 97, 20 731– 20 750, 1992.
Prather, M. J.: Time scales in atmospheric chemistry: Theory,
GWPs for CH4and CO, and runaway growth, Geophys. Res.
Lett., 23, 2597–2600, 1996.
Ramacher, B., Rudolph, J., and Koppmann, R.: Hydrocarbon mea-surements during tropospheric ozone depletion events: Evidence for halogen atom chemistry, J. Geophys. Res., 104, 3633–3653, 1999.
Rinsland, C. P. and Levine, J. S.: Free tropospheric carbon monox-ide concentrations in 1950 and 1951 deduced from infrared total column amount measurements, Nature, 318, 250–254, 1985. R¨ockmann, T.: Measurement and interpretation of13C,14C,17O
and18O variations in atmospheric carbon monoxide, Ph.D. the-sis, University of Heidelberg, Heidelberg, 1998.
R¨ockmann, T. and Brenninkmeijer, C. A. M.: CO and CO2
iso-topic composition in Spitsbergen during the 1995 ARCTOC campaign, Tellus, 49B, 455–465, 1997.
R¨ockmann, T., Brenninkmeijer, C. A. M., Crutzen, P. J., and Platt, U.: Short term variations in the13C/12C ratio of CO as a measure of Cl activation during tropospheric ozone depletion events in the Arctic, J. Geophys. Res., 104, 1691–1697, 1999a.
R¨ockmann, T., Brenninkmeijer, C. A. M., Hahn, M., and Elanksy, N. F.: CO mixing and isotope ratios across Russia; Trans-Siberian Railroad Expedition TROIKA 3, April 1997, Chemo-sphere, 1, 219–231, 1999b.
R¨ockmann, T., Brenninkmeijer, C. A. M., Neeb, P., and Crutzen, P. J.: Ozonolysis of nonmethane hydrocarbons as a source of the observed mass independent oxygen isotope enrichment in tropo-spheric CO, J. Geophys. Res., 103, 1463–1470, 1998a.
R¨ockmann, T., Brenninkmeijer, C. A. M., Saueressig, G., Berga-maschi, P., Crowley, J., Fischer, H., and Crutzen, P. J.: Mass independent fractionation of oxygen isotopes in atmospheric CO due to the reaction CO + OH, Science, 281, 544–546, 1998b. Rom, W., Brenninkmeijer, C. A. M., Ramsey, C. B., Kutschera, W.,
Priller, A., Puchegger, S., R¨ockmann, T., and Steier, P.: Method-ological aspects of CO-C-14 measurements with AMS, Nucl. In-str. Meth. Phys. Res. B, 172, 530–536, 2000.
Saueressig, G., Bergamaschi, P., Crowley, J. N., Fischer, H., and Harris, G. W.: Carbon kinetic isotope effect in the reaction of CH4with Cl atoms, Geophys. Res. Lett., 22, 1225–1228, 1995.
Saueressig, G., Crowley, J. N., Bergamaschi, P., Br¨uhl, C., Bren-ninkmeijer, C. A. M., and Fischer, H.: Carbon 13 and D kinetic isotope effects in the reactions of CH4with O(1D) and OH: New laboratory measurements and their implications for the isotopic composition of stratospheric methane, J. Geophys. Res., 106, 23 127–23 138, 2001.
Sch¨utze, M.: 1949, Ein neues Oxidationsmittel f¨ur die quantitative ¨
Uberf¨uhrung von Kohlenmonoxyd in Kohlendioxyd. Ein Beitrag zur Chemie des Jodpentoxids, Ber. Dtsch. Chem. Ges, 77b, 484– 487, 1949.
Smiley, W. G.: Note on a reagent for oxidation of carbon monoxide, Nucl. Sci. Abstr, 3, 391, 1965.
Smit, H. G. J., Volz, A., Ehhalt, D. H., and Knappe, H.: The iso-topic fractionation during the oxidation of carbon monoxide by hydroxyl radicals and its implications for the atmospheric CO-cycle, in: Stable Isotopes, (Eds) Schmidt, H.-L., F¨orstel, H., and Heinzinger, K., pp. 147–152, Elsevier Scientific Publishing Company, Amsterdam, 1982.
Spivakovsky, C. M., Logan, J. A., Montzka, S. A., Balkanski, Y. J., Foreman-Fowler, M., Jones, D. B. A., Horowitz, L. W., Fusco, A. C., Brenninkmeijer, C. A. M., Prather, M. J., Wofsy, S. C., and McElroy, M. B.: Three-dimensional climatological distri-bution of tropospheric OH: update and evaluation, J. Geophys. Res.,105, 8931–8980, 2000.
Stevens, C. M., Kaplan, L., Gorse, R., Durkee, S., Compton, M., Cohen, S., and Bielling, K.: The kinetic isotope effect for carbon and oxygen in the reaction CO + OH, Int. J. Chem. Kinet., 12, 935–948, 1980.
Stuiver, M. and Polach, H. A.: Reporting of14C data, Radiocarbon, 19, 355–363, 1977.
Waibel, A. E., Fischer, H., Wienhold, F. G., Siegmind, P. C., Lee, B., Str¨om, J., Lelieveld, J., and Crutzen, P. J.: Highly ele-vated carbon monoxide concentrations in the upper troposphere and lowermost stratosphere at northern midlatitudes during the STREAM II summer campaign in 1994, Glob. Change Sci., 1, 233–248, 1999.
Wotawa, G., Novelli, P. C., Trainer, M., and Granier, C.: Inter-annual variability of summertime CO concentrations in the Northern Hemisphere explained by boreal forest fires in North America and Russia, Geophys. Res. Lett., 28, 4575–4578, 2001. Wotawa, G. and Trainer, M.: The influence of Canadian forest fires on pollutant concentrations in the United States, Science, 288, 324–328, 2000.
Yurganov, L. N., Grechko, E.I., and Dzhola, A. V.: Variations of carbon monoxide density in the total atmospheric column over Russia between 1970 and 1995: upward trend and disturbances, attributed to the influence of volcanic aerosols and forest fires, Geophys. Res. Lett., 24, 1231–1234, 1997.
Yurganov, L. N., Jaffe, D. A., Pullman, E., and Novelli, P. C.: Total column and surface densities of atmospheric carbon monoxide in Alaska, 1995, J. Geophys. Res., 103, 19 337–19 347, 1998.