HAL Id: hal-00304951
https://hal.archives-ouvertes.fr/hal-00304951
Submitted on 1 Jan 2004HAL is a multi-disciplinary open access archive for the deposit and dissemination of sci-entific research documents, whether they are pub-lished or not. The documents may come from teaching and research institutions in France or abroad, or from public or private research centers.
L’archive ouverte pluridisciplinaire HAL, est destinée au dépôt et à la diffusion de documents scientifiques de niveau recherche, publiés ou non, émanant des établissements d’enseignement et de recherche français ou étrangers, des laboratoires publics ou privés.
agriculture in the Nordic and Baltic regions
N. Vagstad, P. Stålnacke, H.-E. Andersen, J. Deelstra, V. Jansons, K.
Kyllmar, E. Loigu, S. Rekolainen, R. Tumas
To cite this version:
N. Vagstad, P. Stålnacke, H.-E. Andersen, J. Deelstra, V. Jansons, et al.. Regional variations in diffuse nitrogen losses from agriculture in the Nordic and Baltic regions. Hydrology and Earth System Sciences Discussions, European Geosciences Union, 2004, 8 (4), pp.651-662. �hal-00304951�
Regional variations in diffuse nitrogen losses from agriculture in
the Nordic and Baltic regions
N. Vagstad
1, P. Stålnacke
2, H.-E. Andersen
3, J. Deelstra
1, V. Jansons
4, K. Kyllmar
5, E. Loigu
6,
S. Rekolainen
7and R. Tumas
81Jordforsk Norwegian Centre for Soil and Environmental Research, Frederik A Dahlsv 20, N-1432 Aas, Norway
2NIVA Norwegian Institute for Water Research, P.O Box 173, Kjelsaas, N-0411 Oslo, Norway
3National Environmental Research Institute, Vejlsøvej 25, Dk-8600 Silkeborg, Denmark
4Latvia University of Agriculture, Dep of Environmental Engineering and Management, 19 Akademijas street, LV-3001 Jelgava, Latvia
5Swedish University of Agricultural Sciences, Department of Soil Sciences, P.O Box 7072, SE-75007 Uppsala, Sweden
6Tallinn University of Technology, Ehitajate tee 5, EE-0026 Tallinn, Estonia
7Finnish Environment Institute, P.O. Box 140, FIN-00251 Helsinki, Finland
8Lithuania University of Agriculture, Water Management Department, 4324 Kaunas-Akademija, Lithuania
E-mail for corresponding author: [email protected]
Abstract
This paper describes nitrogen losses from, and the characteristics of, 35 selected catchments (12 to 2000 ha) in the Nordic and Baltic countries. Average annual losses of N in 19941997 ranged from 5 to 75 kg ha1. Generally, the lowest losses were observed in the Baltic
countries and the highest in Norway. The N losses were also characterised by significant within-country and interannual variations, particularly in the Norwegian catchments. An important finding of the study is that the average nutrient losses varied greatly among the catchments studied. The main explanations for this variability were water runoff, fertiliser use (especially the amount of manure), soil type and erosion (including stream bank erosion). However, there were several exceptions, and it was difficult to find general relationships between the individual factors. For example, there was poor correlation between nitrogen losses and surpluses. Therefore, the results suggest that the observed variability in N losses cannot have been due solely to differences in farm management practices, although the studied catchments do include a wide range of nutrient application levels, animal densities and other relevant elements. There is considerable spatial variation in the physical properties (soil, climate, hydrology, and topography) and the agricultural management of the basins, and the interaction between and relative effects of these factors has an important impact on erosion and nutrient losses. In particular, hydrological processes may have a marked effect on N losses measured in the catchment stream water. The results indicate that significant differences in hydrological pathways (e.g. the relationship between fast- and slow-flow processes) lead to major regional differences in N inputs to surface waters and therefore also in the response to changes in field management practices. Agricultural practices such as crop rotation systems, nutrient inputs and soil conservation measures obviously play a significant role in the site-specific effects, although they cannot explain the large regional differences observed in this study. The interactions between agricultural practices and basic catchment characteristics, including hydrological processes, determine the final losses of nitrogen to surface waters, hence it is necessary to understand these interactions to manage diffuse losses of agricultural nutrients efficiently.
Keywords: agriculture, catchments, diffuse sources, nitrogen, losses, Baltic, Nordic
Introduction
Nutrient losses from agriculture are considered to be responsible for the major input of nutrients to surface waters and maritime areas in almost all the Nordic and Baltic countries (Stålnacke, 1996; Lääne et al., 2002). Although both the predominant nutrient transformation processes in
agricultural soils and the main transport processes for nutrient losses are well documented, it is hard to predict the level of nutrient losses from agricultural landscapes and how different measures may influence these losses. The large spatial and temporal variability in nutrient losses, water discharge, weather conditions and farming practices
also make it very difficult to distinguish between differences due to natural causes and those from agricultural activities. National programmes for monitoring nutrient losses from agricultural soils have a relatively short history in the Nordic-Baltic region (Øygarden and Botterweg, 1998). For example, such programmes were established in 1988 in Sweden (Gustfason, 1988), in 1989 in Denmark (Andersen
et al., 1999), and as late as 1992 in Norway (Bechmann et al., 1999). Finland has the longest tradition of monitoring
agricultural losses, which was begun in 1962 in four agricultural streams.
The results of these programmes have been presented mainly in national reports, and there has been no coordination or more formal cooperation on the regional level, nor any common recounting or analysis of monitoring data. Accordingly, Nordic-Baltic collaboration is clearly needed with regard to monitoring and reporting agricultural soil and nutrient losses. Here, possible explanations for differences in nitrogen losses between the catchments studied and countries are discussed, as well as environmental effects related to soils, climate, hydrology and management practices.
Database and methods
To limit the volume of the data, an appropriate number of representative catchments (maximum of 10) was selected for each country, based on the following criteria:
l they were to represent the major crops and soil types; l they were to represent the main variability in climate; l data were to be available on soil types, land use, yield
statistics and fertiliser use.
Preference was also given to catchments with long time series of monitoring data. Furthermore, it was decided that catchments should not be too small (e.g. homogeneous fields) or too large (maximum 25 km2).
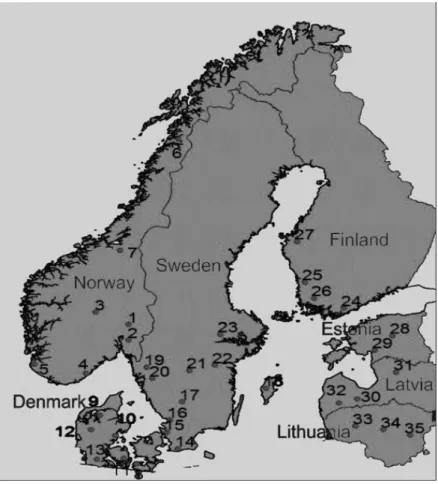
In all, 35 catchments were selected: seven in Norway, six in Denmark, ten in Sweden, four in Finland, three each in Latvia and Lithuania, and two in Estonia (Fig. 1). The selected catchments range in size from 12 to 2000 ha (Table 1), and the proportion of agricultural land is typically around 6080%. Annual precipitation varies between the catchments, from 500600 mm in the Baltic countries, SE Sweden and Finland, up to more than 1000 mm in the
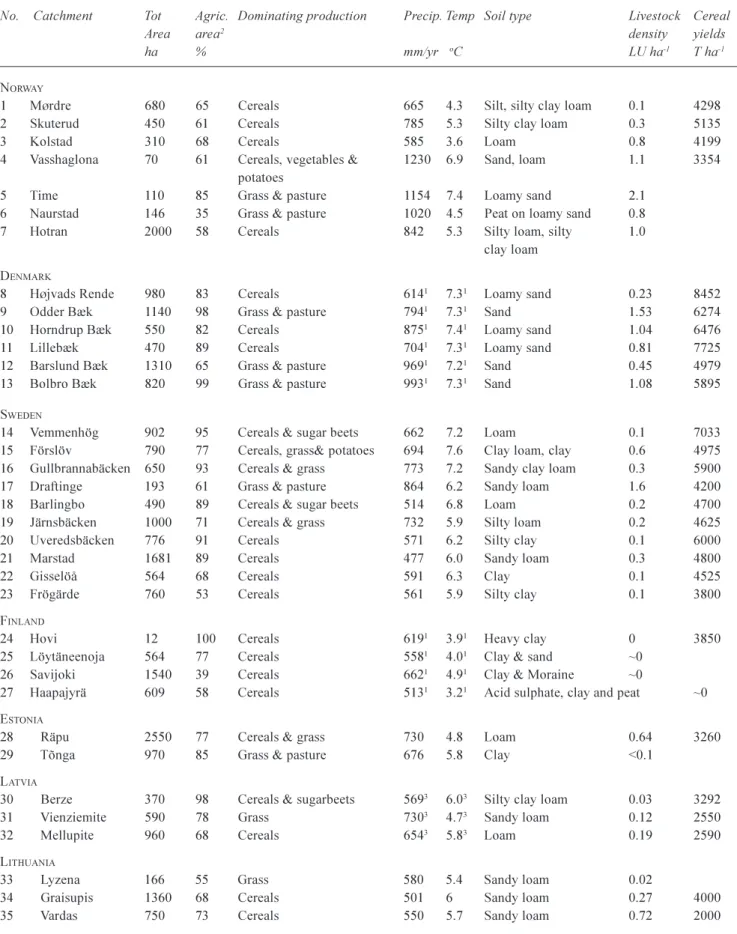
Table 1. General physiographic characteristics, livestock density, and cereal yields in the catchments studied. The numbers to the left refer to the sampling locations marked on the map in Fig. 1. Soil type according to USDA classification.
No. Catchment Tot Agric. Dominating production Precip. Temp Soil type Livestock Cereal
Area area2 density yields
ha %mm/yr oC LU ha-1 T ha-1
NORWAY
1 Mørdre 680 65 Cereals 665 4.3 Silt, silty clay loam 0.1 4298 2 Skuterud 450 61 Cereals 785 5.3 Silty clay loam 0.3 5135 3 Kolstad 310 68 Cereals 585 3.6 Loam 0.8 4199 4 Vasshaglona 70 61 Cereals, vegetables & 1230 6.9 Sand, loam 1.1 3354
potatoes
5 Time 110 85 Grass & pasture 1154 7.4 Loamy sand 2.1 6 Naurstad 146 35 Grass & pasture 1020 4.5 Peat on loamy sand 0.8 7 Hotran 2000 58 Cereals 842 5.3 Silty loam, silty 1.0
clay loam DENMARK
8 Højvads Rende 980 83 Cereals 6141 7.31 Loamy sand 0.23 8452
9 Odder Bæk 1140 98 Grass & pasture 7941 7.31 Sand 1.53 6274
10 Horndrup Bæk 550 82 Cereals 8751 7.41 Loamy sand 1.04 6476
11 Lillebæk 470 89 Cereals 7041 7.31 Loamy sand 0.81 7725
12 Barslund Bæk 1310 65 Grass & pasture 9691 7.21 Sand 0.45 4979
13 Bolbro Bæk 820 99 Grass & pasture 9931 7.31 Sand 1.08 5895
SWEDEN
14 Vemmenhög 902 95 Cereals & sugar beets 662 7.2 Loam 0.1 7033 15 Förslöv 790 77 Cereals, grass& potatoes 694 7.6 Clay loam, clay 0.6 4975 16 Gullbrannabäcken 650 93 Cereals & grass 773 7.2 Sandy clay loam 0.3 5900 17 Draftinge 193 61 Grass & pasture 864 6.2 Sandy loam 1.6 4200 18 Barlingbo 490 89 Cereals & sugar beets 514 6.8 Loam 0.2 4700 19 Järnsbäcken 1000 71 Cereals & grass 732 5.9 Silty loam 0.2 4625 20 Uveredsbäcken 776 91 Cereals 571 6.2 Silty clay 0.1 6000 21 Marstad 1681 89 Cereals 477 6.0 Sandy loam 0.3 4800 22 Gisselöå 564 68 Cereals 591 6.3 Clay 0.1 4525 23 Frögärde 760 53 Cereals 561 5.9 Silty clay 0.1 3800 FINLAND
24 Hovi 12 100 Cereals 6191 3.91 Heavy clay 0 3850
25 Löytäneenoja 564 77 Cereals 5581 4.01 Clay & sand ~0
26 Savijoki 1540 39 Cereals 6621 4.91 Clay & Moraine ~0
27 Haapajyrä 609 58 Cereals 5131 3.21 Acid sulphate, clay and peat ~0
ESTONIA
28 Räpu 2550 77 Cereals & grass 730 4.8 Loam 0.64 3260 29 Tõnga 970 85 Grass & pasture 676 5.8 Clay <0.1
LATVIA
30 Berze 370 98 Cereals & sugarbeets 5693 6.03 Silty clay loam 0.03 3292
31 Vienziemite 590 78 Grass 7303 4.73 Sandy loam 0.12 2550
32 Mellupite 960 68 Cereals 6543 5.83 Loam 0.19 2590
LITHUANIA
33 Lyzena 166 55 Grass 580 5.4 Sandy loam 0.02
34 Graisupis 1360 68 Cereals 501 6 Sandy loam 0.27 4000 35 Vardas 750 73 Cereals 550 5.7 Sandy loam 0.72 2000
catchments in south-west and northern Norway. Cereal crops dominate in 25 of the 35 catchments, whereas grassland or pasture is predominant in nine of the catchments (three in Denmark, two in Estonia, and one each in Norway, Sweden, Latvia and Lithuania). Vasshaglona in Norway was the only catchment with a high percentage of potatoes and vegetables (5060% of the total area) combined with cereals.
The values representing losses are given in kg ha1
agricultural land. They are based on the measured nutrient loads at the outlets of catchments (primary surface water recipients) but were corrected for the contribution from non-agricultural land by using standard loss coefficients for these land categories. The presented data on losses should therefore not be interpreted as the gross losses from agricultural soils (i.e. root zone losses). The time period covered was 19931997.
The relationship between nutrient inputs and outputs in agriculture reflects the efficiency of nutrient utilisation and is therefore often looked upon as an important environmental indicator for the agricultural sector. A soil surface balance was calculated for the catchments studied, based on differences in nutrient (mineral and organic fertiliser) application on farmland, atmospheric deposition and fixation of nitrogen, and the amount of nutrients removed with crops and crop residues (if not incorporated into the soil). This was done using the following formula:
nutrient balances = mineral fertilisers + nutrients in manure applied + atmospheric deposition + nitrogen fixation nutrients removed in crop
This soil surface nutrient balance reflects the sum of the losses to water and air and the net changes in soil nutrient pools. The values used here were based mainly on reporting of fertiliser use and crop yields (and standard values for the N content of the yield) by the farmers themselves. Nutrient balances were calculated only for catchments in which crop yields could be registered rather accurately (i.e. catchments dominated by cereal crops), and for the primarily grass and pasture land catchments for which reliable yield estimates were available.
Results and discussion
VARIATIONS IN THE MAGNITUDE OF MEAN ANNUAL NITROGEN LOSSES
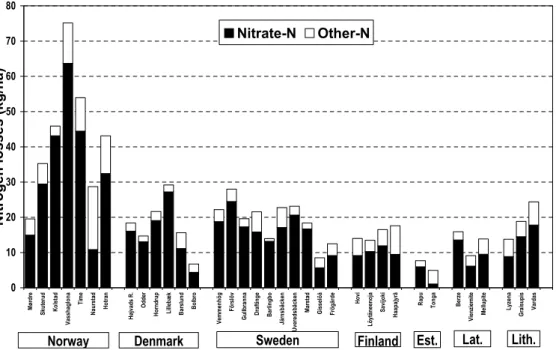
Large variations were observed in the mean annual losses of N during the period 19931997. The overall range in N losses was 575 kg ha1 (Fig. 2) but 24 out of 35 catchments
showed annual losses ranging from 10 to 30 kg ha1.
Generally, the largest losses of N were observed in the Norwegian catchments.
The largest average N losses, 75 kg ha1yr1, occurred in
the Norwegian catchment Vasshaglona, which is characterised by intensive arable crops (e.g. vegetables) on sandy soils, high precipitation and relatively high livestock density. In general, the lowest N losses, 59 kg ha1, were
observed in the catchments in Estonia, which mainly represent pasture land with very low fertiliser application and low water runoff.
Fig. 2. Mean annual losses of nitrogen from 35 agricultural catchments in the Nordic and Baltic countries. 0 10 20 30 40 50 60 70 80 M ø rd re Skuter ud K o ls ta d Vass haglona T im e N a ur stad Ho tran H ø jv a d s R . O d d e r H o rndr up L ill e b æ k B a rs lu n d Bolbr o Vemmenhög För slöv Gull br a n na D ra fti n g e Ba rl ingbo Jär ns bäck en Uv er eds bäck en Mar s tad G iss elöå Fr ögä rd e Hovi Löy tä ne enoja S a vij oki Ha a p aj yr ä Ra p u Tonga Berz e Vi e n zi em it e Me llu p it e Lyz ena Gr aisupis Va rd a s Nit roge n los ses (kg/ha) Nitrate-N Other-N
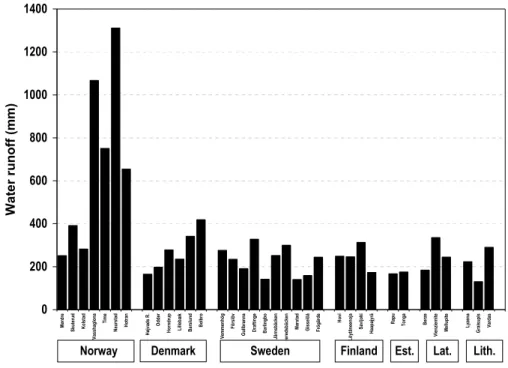
The observed losses of N vary substantially between the catchments within each country (Fig. 1). In general, such within-country variations are apparently largest for Norway and smallest for Finland. A probable reason for the high variability in the Norwegian catchments is the wide range of climatic and hydrometeorological conditions in those areas, as illustrated by a specific runoff ranging from less than 200 mm to more than 1200 mm (Fig. 3).
INTERANNUAL AND SEASONAL VARIABILITY IN NITROGEN LOSSES
There was also large interannual variability in nitrogen losses within each catchment, particularly in some of the catchments in Norway (Fig. 4). The lowest interannual variability in the catchments occured in the Baltic countries and Finland, and there was hardly any variation in nitrogen losses from the stream Mørdrebekken in Norway during the five-year period studied (average 17 kg ha1yr1). This
was due to the large amount of water available in the silty soil in the catchment, which promotes relatively high and stable yields with little interannual variability, despite considerable interannual variation in precipitation and temperature during the growing season. Yield failures, e.g. due to lack of plant available water, may cause exceptionally high N losses during the subsequent autumn and winter season (Vagstad et al., 1997).
Average seasonal variations in water runoff are shown in Fig. 5. The seasons are designated winter/early spring
(JanuaryMarch), spring/early growing season (April June), growing season (JulySeptember) and autumn/early winter (OctoberDecember). Water runoff (and nutrient losses, not shown) tended to be highest during the winter and early spring. Furthermore, the catchments in the Baltic countries and Finland, as well as some of those in Norway, showed relatively high runoff and nutrient losses (usually 40%) during the period AprilJune, most likely due to the rather late spring flow in those areas compared to the other catchments. Notably, the runoff and nutrient losses were extremely high (> 60%) in AprilJune in one of the Estonian catchments. In all catchments, the runoff and nutrient losses were relatively low (520% of the total annual rates) in July September.
FERTILISER APPLICATION AND NITROGEN BALANCES
There was a wide range of nutrient application levels in the selected catchments during the period studied, with average amounts varying from 8 to 290 kg N ha1 and from 1.5 to 38
kg P ha1 agricultural land in mineral fertilisers and manure
(Table 2). The lowest levels were observed in the Baltic catchments, where nutrient inputs have generally been very low since the dissolution of the Soviet Union. On the whole, catchments with high livestock densities received more total nitrogen than those with less livestock (Tables 1 and 2), although large differences in fertiliser applications were observed in catchments with high animal density and otherwise similar characteristics. For example, 258 kg N Fig. 3. Mean annual water runoff in 35 agricultural catchments in the Nordic and Baltic countries.
0 200 400 600 800 1000 1200 1400 M ø rdre S kut er ud K o lst ad V assh ag lo n a T im e N au rst ad H o tr an H ø jva d s R . O dde r H o rn d ru p L illeb æ k B arslu n d B o lb ro Vemmen h ö g F ö rs lö v G u llb ran n a D raf ti n g e B ar lin g b o Jär n sb äcken U ver ed sb äcken Ma rs ta d G isselö å Fr ö g är de Ho vi Löy tä ne en o ja S avijo ki H aap ajyrä Rapu Tong a Be rz e Vien zi emite M el lupi te Ly ze n a G raisu p is Var d as Wa te r runoff (mm)
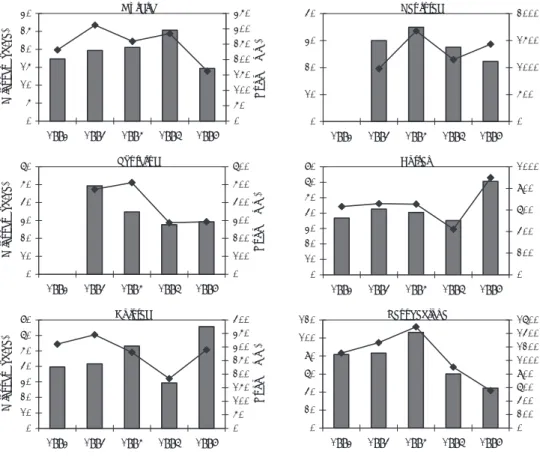
0 5 10 15 20 25 30 1993 1994 1995 1996 1997 N losses (kg/ha) 0 50 100 150 200 250 300 350 Runoff (m m ) Mørdre 0 10 20 30 40 50 60 1993 1994 1995 1996 1997 N losses (kg/ha) 0 100 200 300 400 500 600 Runoff (m m ) Skuterud 0 10 20 30 40 50 60 70 1993 1994 1995 1996 1997 N losses (kg/ha) 0 50 100 150 200 250 300 350 400 Runoff (m m ) Kolstad 0 10 20 30 40 1993 1994 1995 1996 1997 0 500 1000 1500 2000 Naurstad 0 10 20 30 40 50 60 70 1993 1994 1995 1996 1997 0 200 400 600 800 1000 Hotran 0 20 40 60 80 100 120 1993 1994 1995 1996 1997 0 200 400 600 800 1000 1200 1400 1600 Vasshaglona
Fig. 4. Annual runoff (line) and losses of total-N (bars) for six Norwegian catchments
0 % 20 % 40 % 60 % 80 % 100 % M ø rd re S kut er u d K o ls ta d V a sshagl ona Ti m e N aur st ad H o tra n Hø jv a d s R . O dder H o rndr up L ill eb æ k Ba rs lu n d B o lb ro V e m m enhög F ö rs lö v G u llb ranna D raf tinge B ar lingbo Jä rn sbäcken U ver ed sbäcken Ma rs ta d G is se lö å F rögär de Ho vi Löyt ä neenoj a S a vi jo ki H aapaj yr ä R apu Tonga Berz e V ienzi e m ite M e llupit e Lyzena Gra is u pi s V ar das
Jan-Mar Apr-Jun Jul-Sep Oct-Dec
Sweden Finland
Norway Denmark Est. Lat. Lith.
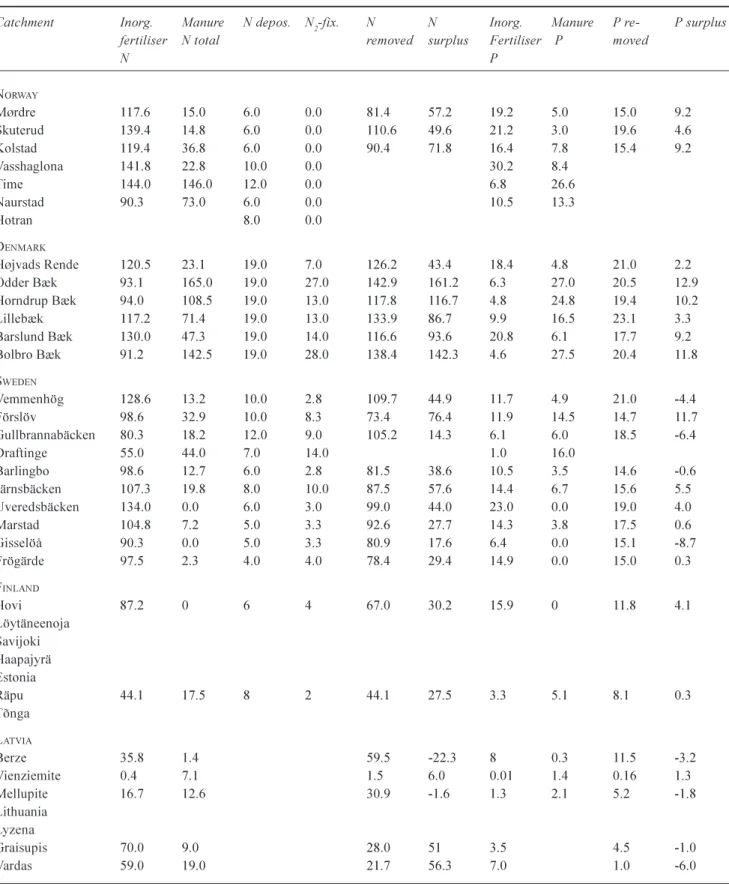
Table 2. Nutrient budgets for the catchments studied (kg ha1yr1)
Catchment Inorg. Manure N depos. N2-fix. N N Inorg. Manure P re- P surplus
fertiliser N total removed surplus Fertiliser P moved
N P NORWAY Mørdre 117.6 15.0 6.0 0.0 81.4 57.2 19.2 5.0 15.0 9.2 Skuterud 139.4 14.8 6.0 0.0 110.6 49.6 21.2 3.0 19.6 4.6 Kolstad 119.4 36.8 6.0 0.0 90.4 71.8 16.4 7.8 15.4 9.2 Vasshaglona 141.8 22.8 10.0 0.0 30.2 8.4 Time 144.0 146.0 12.0 0.0 6.8 26.6 Naurstad 90.3 73.0 6.0 0.0 10.5 13.3 Hotran 8.0 0.0 DENMARK Højvads Rende 120.5 23.1 19.0 7.0 126.2 43.4 18.4 4.8 21.0 2.2 Odder Bæk 93.1 165.0 19.0 27.0 142.9 161.2 6.3 27.0 20.5 12.9 Horndrup Bæk 94.0 108.5 19.0 13.0 117.8 116.7 4.8 24.8 19.4 10.2 Lillebæk 117.2 71.4 19.0 13.0 133.9 86.7 9.9 16.5 23.1 3.3 Barslund Bæk 130.0 47.3 19.0 14.0 116.6 93.6 20.8 6.1 17.7 9.2 Bolbro Bæk 91.2 142.5 19.0 28.0 138.4 142.3 4.6 27.5 20.4 11.8 SWEDEN Vemmenhög 128.6 13.2 10.0 2.8 109.7 44.9 11.7 4.9 21.0 -4.4 Förslöv 98.6 32.9 10.0 8.3 73.4 76.4 11.9 14.5 14.7 11.7 Gullbrannabäcken 80.3 18.2 12.0 9.0 105.2 14.3 6.1 6.0 18.5 -6.4 Draftinge 55.0 44.0 7.0 14.0 1.0 16.0 Barlingbo 98.6 12.7 6.0 2.8 81.5 38.6 10.5 3.5 14.6 -0.6 Järnsbäcken 107.3 19.8 8.0 10.0 87.5 57.6 14.4 6.7 15.6 5.5 Uveredsbäcken 134.0 0.0 6.0 3.0 99.0 44.0 23.0 0.0 19.0 4.0 Marstad 104.8 7.2 5.0 3.3 92.6 27.7 14.3 3.8 17.5 0.6 Gisselöå 90.3 0.0 5.0 3.3 80.9 17.6 6.4 0.0 15.1 -8.7 Frögärde 97.5 2.3 4.0 4.0 78.4 29.4 14.9 0.0 15.0 0.3 FINLAND Hovi 87.2 0 6 4 67.0 30.2 15.9 0 11.8 4.1 Löytäneenoja Savijoki Haapajyrä Estonia Räpu 44.1 17.5 8 2 44.1 27.5 3.3 5.1 8.1 0.3 Tõnga LATVIA Berze 35.8 1.4 59.5 -22.3 8 0.3 11.5 -3.2 Vienziemite 0.4 7.1 1.5 6.0 0.01 1.4 0.16 1.3 Mellupite 16.7 12.6 30.9 -1.6 1.3 2.1 5.2 -1.8 Lithuania Lyzena Graisupis 70.0 9.0 28.0 51 3.5 4.5 -1.0 Vardas 59.0 19.0 21.7 56.3 7.0 1.0 -6.0
ha1 was used in the Odder Bæk catchment in Denmark,
whereas only 100 kg N ha1 was applied in Draftinge in
Sweden (Table 2), which is similar to the Odder Bæk area in regard to livestock density (1.5-1.6 LU ha1 agricultural
land), crop distribution (i.e. cereals), and precipitation (800 860 mm). Differences in fertiliser application were also substantial in catchments with low animal density and otherwise similar characteristics. For instance, the Kolstad catchment in Norway and the Vardas in Lithuania were similar with respect to livestock density (0.70.8 LU), crop distribution (cereals), and precipitation (550600 mm), but 156 kg N ha1 was applied in the former area and only 78 kg
N ha1 in the latter (Table 2).
During the entire measurement period, there was great variability in average N and P soil surface balances, ranging from deficits in some of the Baltic (N and P) and Swedish (P) catchments to large surpluses of 50160 kg N ha1 and
913 kg P ha1 in most of the Danish and some Norwegian
catchments. The nitrogen surplus was largest (range 140 165 kg ha1) in the catchments with the greatest livestock
density (> 1.5 LU ha1) and substantially lower (usually
< 50 kg ha1) in catchments with livestock density less than
0.5 LU ha1. The phosphorus surplus was also largest in the
catchments with the most livestock. This suggests that large nutrient surpluses are mainly associated with livestock production.
FACTORS AFFECTING VARIABILITY IN THE MAGNITUDE OF NITROGEN LOSSES BETWEEN CATCHMENTS
There was great variability in nitrogen losses, despite similarities in soils, climatic conditions, and farming systems. In general, N losses were low in all of the Baltic and some of the Danish and Swedish catchments, but high in the Norwegian catchments.
The results call for a discussion of the various factors that might explain the variability in nitrogen losses. The following issues are presented here:
l nitrogen losses vs. water runoff;
l nitrogen losses vs. nitrogen fertilisers and surpluses; l hydrological pathways of nitrogen losses.
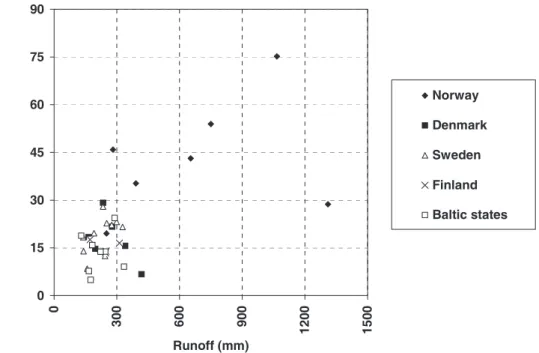
In general, losses of nitrogen correspond with variations in runoff (Stålnacke and Grimvall, 1999). However, no such straightforward correlations were found when all catchments were included in the analysis, although a slight positive relationship between nitrogen losses and runoff was observed (Fig. 6). Nevertheless, the nitrogen losses varied considerably between the catchments exhibiting moderate runoff (250350 mm). Substantial variation in nitrogen losses occurred for the two catchments with the highest runoff (> 1000 mm yr1), Naurstad and Vasshaglona in
Norway, but that was probably due the fact that these two areas have different types of soils and crops.
0 15 30 45 60 75 90 0 30 0 60 0 90 0 120 0 150 0 Runoff (mm) Nit rog en lo sses (k g( ha) Norway Denmark Sweden Finland Baltic states
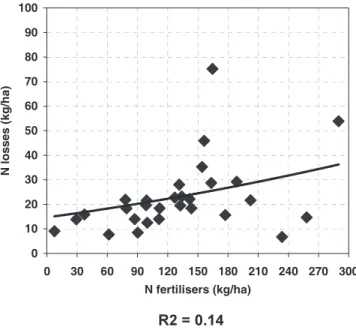
Large losses of nutrients from agricultural soils are often caused by intensive use of fertilisers, especially in situations when fertiliser use exceeds the nutrient requirements of the crops. This has been clearly demonstrated in plot experiments (e.g. Brink, 1983; Andersson, 1986; Neill, 1989; Liang et al., 1991), and catchment studies (Dillon and Kirchner, 1975; Hill, 1981; Rekolainen, 1989; Zakova
et al., 1993). A slight positive correlation was observed
between nitrogen losses and application of nitrogen in manure and mineral fertilisers (R2=0.14; Fig. 7). However,
this relationship might be somewhat misleading, because all the lowest N losses occurred in the Baltic countries, where the application of N was exceptionally low. Considering only the catchments with more standard application rates, the correlation was much weaker, and there were large differences in N losses at same application rates. Accordingly, a better explanation for N losses in this context might be the nutrient surpluses that arise when more substantial amounts of N fertilisers are applied to increase yields.
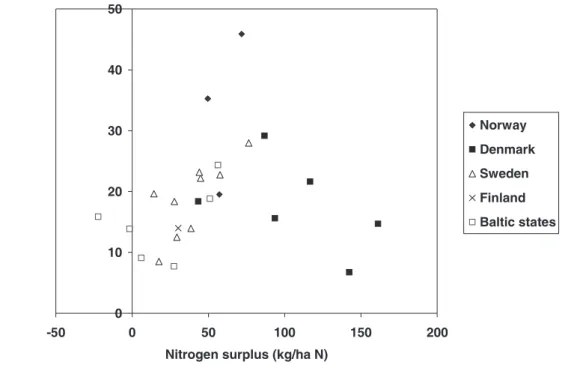
The nutrient surplus values given in Table 2 represent soil surface balances that were calculated by subtracting the nutrient outputs from the inputs; the outputs being crop yields, and the inputs fertilisers, manure, and atmospheric deposition and fixation. Leaching, runoff and gaseous losses were not included in the outputs, but were instead considered to be eventual residuals (surpluses or deficits). Nutrient surpluses are often used as environmental indicators, for instance, when determining the risk of water pollution. Bechmann et al. (1998) studied Norwegian agricultural
catchments and found a rather weak correlation between nutrient surpluses and nutrient losses in individual years.
These investigators also discovered that the level of annual nutrient losses was influenced primarily by variations in weather conditions, and that annual nutrient surpluses were strongly affected by variations in yield which, in turn, were largely the result of the weather conditions during the growing season. These results are supported by findings that, on average for the entire monitoring period, showed a poor correlation between nutrient losses and surpluses (Fig. 8). The relationship between N losses and surpluses was slightly positive in the Swedish catchments but negative in the Danish catchments. The weak correlations between surpluses and losses may have been due to the fact that the former were measured in the soil surface and the latter in the primary surface-water recipient. In other words, since processes such as mineralisation, immobilisation and denitrification affect the nutrient transportation from the root zone to surface water, it is not likely that there will be a strong correlation between surpluses and losses (see the following section). In addition, the soil has a large capacity to adsorb P, and a high soil P status may reflect a long history of surpluses. Thus, if all surpluses are long-term in nature, only long-term measurements are likely to reveal these correlations.
The nutrient loss values presented here were based on measurements made at the catchment outlets (in primary surface-water recipients). In many cases, the losses of nutrients from agricultural land via the root zone may be significantly higher than the load analysed at a catchment outlet (Andersen et al., 1999). Depending on the hydrological pathways along which nutrients are transported, retention processes may reduce the concentrations of these substances significantly before they reach the surface-water recipient. That definitely applies to N (nitrate) when groundwater flow is a major pathway, as illustrated by the results of Grant et al. (1997) showing that, in Denmark, N losses from the root zone in sandy soils were 124 kg ha1, whereas the losses at the catchment outlet were
only 12 kg ha1. In the same study, the losses of N from
loamy soil were estimated to 68 kg ha1, but the losses at
the catchment outlet were only 25 kg ha-1, which is,
nonetheless, a higher level than released from the sandy catchments. This variation in losses between sandy and loamy soils is related to the hydrological pathways along which the nutrients are transported. In Denmark, loamy soils are less permeable and are therefore usually artificially drained, hence a relatively larger proportion of excess precipitation quickly reaches streams in the form of overland flow or interflow (i.e. flow from drain pipes and from upper groundwater). By comparison, streams in sandy Danish
0 10 20 30 40 50 60 70 80 90 100 0 30 60 90 120 150 180 210 240 270 300 N fertilisers (kg/ha) N lo sses ( kg /h a)
Fig. 7. Scatter charts of mean annual losses vs. mean annual
application of N in mineral fertilisers and livestock manure for agricultural catchments in the Nordic and Baltic countries.
0 10 20 30 40 50 -50 0 50 100 150 200
Nitrogen surplus (kg/ha N)
Nitr ogen losses ( kg/ha N) Norway Denmark Sweden Finland Baltic states 0 10 20 30 40 50 60 0 20 40 60 80 100 BFI (%) N it ro g en lo ad ( kg /h a) Denmark Norway Sweden Finland Baltic states
Fig. 8. Scatter charts of mean annual losses vs. mean annual surpluses of N (upper) and P (lower) for agricultural catchments in the Nordic and Baltic countries.
catchments are fed mainly with groundwater, and they have a large denitrification potential due to oxidation of organic matter or pyrite (FeS2) that occurs during transport of the
groundwater.
The amount of quick flow can be ascertained by separating the flow components (e.g. quick flow and base flow) of the stream water hydrograph. The Base Flow Index (BFI) is a calculation of the base flow in relation to total flow. More precisely, it estimates the portion of water transported by slow-flow processes, which in many cases may represent groundwater discharge: the higher the BFI, the more
dominant the groundwater pathway. The BFI-calculations performed here were essentially as proposed by the Institute of Hydrology (1993).
Considering the results for Denmark, the BFI values were high for the sandy catchments (7795%) and lower for the loamy catchments (5860%), which clearly demonstrates the involvement of different hydrological pathways. However, a different picture was obtained when the observed N losses were plotted against the calculated BFIs for catchments in the other countries (Fig. 9): for Denmark, the lowest N loads were observed at the highest BFI values,
whereas the opposite was noted for Norway, and the correlation between BFI and observed losses was very weak for the other countries. Presumably, the method used to calculate BFI gave values that were not precise and accurate enough to differentiate or define similar hydrological pathways in the various catchments. For example, considering the Danish catchments, the index appeared to separate groundwater flow from the relatively faster flow processes (surface runoff and percolation through soil matrix to drainage systems). By comparison, the conditions in the Norwegian catchments are rather different, and groundwater usually makes only a marginal contribution to the water discharge. Under such circumstances, it is more likely that the BFI values will discriminate between very fast flow processes (surface runoff and preferential flow) and the relatively slower flow processes (e.g. percolation via soil matrix to drainage systems). This is most likely also the reason why the regression analyses gave opposite results for the Norwegian and Danish catchments. Nevertheless, the findings clearly show that examination of the hydrological pathways provides important information about the magnitude of nitrogen losses. It may also provide useful information for the asessement of measures to reduce these losses and expected impacts on receiving water bodies.
Concluding remarks
One of the most remarkable findings is that the average losses of nitrogen varied substantially in the catchments studied (Fig. 2), despite similarities in soils, climate and farming practices. Notwithstanding the complex nature of this variability, differences in the hydrological processes seem to have played an important role, particularly for the discerned N losses.
The load of nitrogen that is discharged from the root zone can be considered to represent the gross losses from agriculture, if it is assumed that little denitrification and ammonia volatilisation occur in the root zone. The amount of nitrogen that actually reaches the surface water is determined by the transport pathways from the soil profile and root zone to the surface-water recipient. If a soil-water system is characterised by fast-flow processes (as for most Norwegian catchments), a relatively large portion of the gross nutrient losses will be delivered to the surface water. Thus, the net losses measured in stream water will be nearly equivalent to the gross losses from the root zone which, of course, means that the net losses will be high if there are substantial gross losses of nutrient loads. In such a system, a reduction in gross losses from the root zone will probably have a relatively rapid effect on the losses of nutrients to surface water. Conversely, if a system is characterised by
slow-flow processes, smaller loads will be detected in the receiving surface waters (due to increased losses through denitrification in groundwater), which may result in measured net losses in stream water that are much smaller than gross losses from the root zone (e.g. as seen in some of the Danish catchments). However, in this case, even significant reductions in root-zone losses may be eliminated by the time the water reaches the outlet stream of the catchment. It may be difficult to quantify the effect of such gross reductions, particularly if there is considerable inertia or a time delay in the system.
Understanding the effects of hydrological processes on nutrient losses is an important new dimension in nutrient management strategies. Clearly, agricultural practices such as crop rotation systems, nutrient inputs and soil conservation measures had a significant impact on the site-specific effects observed in this study, although they cannot explain the large regional differences. It is the interaction between agricultural practices and basic catchment characteristics, including the hydrological processes, that determines the final losses of nutrients to surface waters.
In addition, mineralisation during winter is important, especially in the litter pool. For example, Gustafson (1988) showed a strong correlation between the amount of nitrate in the soil profile at the end of the growing season and the litter mineralisation, and the amount of nitrate leached during the winter period (R2=0.99). Catch-crops and winter crops
has also shown to be of importance for nutrient losses. However, the effects from mineralisation, catch-crops and nutrient status in soils were outside the scope of this study but should be considered in a follow-up study.
Diffuse nutrient losses represent a particular challenge for the pressure and impact analysis and the river basin management plan linked to the Water Framework Directive. The key issue of the directive is to maintain or improve the status of surface and ground waters by controlling or reducing the pressures on the water bodies. Targeted measures to reduce nutrient losses from diffuse sources are therefore essential to optimise the cost-efficiency of the river basin management plan. This requires understanding of the spatial and temporal patterns of the diffuse nutrient losses and the related cause-effect relationships. In particular, the hydrological processes are important for the linkage between field-scale activities and water quality impacts.
Acknowledgment
The study was financed by the Nordic Council of Ministers. The authors are grateful to Patricia Ödman for revising the language.
References
Andersen, H.E., Kronvang, B. and Larsen, S.E., 1999. Agricultural practices and diffuse nitrogen pollution in Denmark. Water Sci.
Technol., 39, 257264.
Andersson, R., 1986. Losses of nitrogen and phosphorus from
arable land in Swedenmagnitude, regulating factors and measured proposed. PhD Thesis. Institute for Soil Sciences,
Swedish University of Agricultural Sciences, Uppsala, Sweden. 215pp.
Bechmann, M., Eggestad, H. and Vagstad, N., 1998. Nitrogen balances and leaching in four agricultural catchments in southeastern Norway. Environ. Pollut., 102, 493499. Bechmann, M., Eggestad, H.O., Våje, P.I., Stålnacke, P. and
Vagstad, N., 1999. The Agricultural Environmental Monitoring Program in Norway. Erosion and nutrient runoff - Results including 1998/99. Jordforsk Report no. 103/99, 34pp. (in Norwegian)
Brink, N., 1983. Gödselanvändningens miljöproblem. Ekohydrologi, 14, 3149. (in Swedish).
Deelstra, J., Vagstad, N., Loigu, E., Vasiyev, A. and Jansons, V., 1998. Interactions between hydrology and nitrogen runoff in small agricultural catchments: a comparative study of Estonian, Latvian and Norwegian catchments. In: XX Nordic Hydrological
Conference, J. Kajander (Ed.), Nordic Association for
Hydrology, Helsinki, 10-13 August 1998. Nordic Hydrological Programme. NHP Report No. 44, 120128.
Dillon, P.J. and Kirchner, W.B., 1975. The effects of geology and land use on the export of phosphorus from watersheds. Water
Res., 9, 135148.
Grant, R., Blicher-Mathiesen, G., Andersen, H.E., Lauble, A.R., Jensen, P.G. and Rasmussen, P., 1997. The Agricultural Watershed Monitoring Programme, 1997. National
Environmental Research Institute Report No. 210, 141pp. (in
Danish)
Grant, R., Paulsen, I., Andersen, H. E., Laubel, A. R., Jørgensen, J. O., Jensen, P. G., Pedersen, M. and Rasmussen, P., 1999. The Agricultural Watershed Monitoring Programme 1998. National
Environmental Research Institute Report No. 293, 152pp. (in
Danish)
Gustafson, A., 1988. Simulation of nitrate leaching from arable land in southern Sweden. Acta Agric. Scand., 38, 1323. Hill, A.R., 1981. Stream phosphorus exports from watersheds with
contrasting land uses in Southern Ontario. Water Resour.Bull.,
17, 627634.
Institute of Hydrology, 1993. Low flow estimation in the United Kingdom. IH Report 108, Institute of Hydrology, Wallingford, UK.
Lääne, A., Pitkänen, H., Arheimer, B., Behrendt, H., Jarosinski, W., Lucane, S., Pachel, K., Ræike, A., Shekhovtsov, A., Svendsen, L. and Valotka, S., 2002. Evaluation of the implementation of the 1988 Ministerial Declaration regarding nutrient load reductions in the Baltic Sea catchment area, Finnish
Environment 524, Finnish Environment Institute, Helsinki,
Finland. 195pp.
Liang, B.C., Remillard, M. and MacKenzie, A.F.,1991. Influence of fertilizer, irrigation, and non-growing season precipitation on soil nitrate-nitrogen under corn. J. Environ. Qual., 20, 123 128.
Löfgren, S., Gustafsson, A., Steineck, S. and Stålnacke, P., 1999. Agricultural development and nutrient flows in the Baltic States and Sweden after 1988. Ambio, 28, 320327.
Loigu, E. and Iital, A., 2000. Nutrient losses from two small agricultural catchments in Estonia. XXI Nordic Hydrological Conference. NHP Report No. 46, Uppsala, Sweden. 139145. Neill, M., 1989. Nitrate concentrations in river waters in the
South-East of Ireland and their relationships with agricultural practice.Water Res., 23, 13391355.
Øygarden. L and Botterweg, P., (Eds.), 1998. Measuring runoff and nutrient losses from agricultural land in Nordic countries.
TemaNord 1998:575, 93pp.
Rekolainen, S., 1989. Phosphorus and nitrogen load from forest and agricultural areas in Finland. Aqua Fennica, 19, 95107 Stålnacke, P., 1996. Nutrient loads to the Baltic Sea. Ph.D.Thesis.
Linköping Studies in Arts and Science, 146, 78pp.
Stålnacke, P. and Grimvall, A., 2000. Hydrological normalization of nutrient deliveries from agricultural catchments. Reviewed
Proceedings from Eleventh Annual Confernence on Applied Statistics in Agriculture, Kansas State University, USA. 145
155.
Statistics Denmark, 1999. Agricultural Statistics 1998, 298pp. Statistics Latvia, Various years 19611997.
Vagstad, N., Eggestad, H.O. and Høyås, T.R., 1997. Mineral nitrogen in agricultural soils and nitrogen losses: Relation to soil properties, weather conditions, and farm practices. AMBIO,
26, 266272.
Zakova, Z., Brankova, D., Kockova, E. and Kr1z, P., 1993. Influence of diffuse pollution on the eutrophication and water quality of reservoirs in the Morava river basin. Water Sci.