Publisher’s version / Version de l'éditeur:
BMC Biotechnology, 15, 1, 2015-05-16
READ THESE TERMS AND CONDITIONS CAREFULLY BEFORE USING THIS WEBSITE.
https://nrc-publications.canada.ca/eng/copyright
Vous avez des questions? Nous pouvons vous aider. Pour communiquer directement avec un auteur, consultez la
première page de la revue dans laquelle son article a été publié afin de trouver ses coordonnées. Si vous n’arrivez pas à les repérer, communiquez avec nous à PublicationsArchive-ArchivesPublications@nrc-cnrc.gc.ca.
Questions? Contact the NRC Publications Archive team at
PublicationsArchive-ArchivesPublications@nrc-cnrc.gc.ca. If you wish to email the authors directly, please see the first page of the publication for their contact information.
NRC Publications Archive
Archives des publications du CNRC
This publication could be one of several versions: author’s original, accepted manuscript or the publisher’s version. / La version de cette publication peut être l’une des suivantes : la version prépublication de l’auteur, la version acceptée du manuscrit ou la version de l’éditeur.
For the publisher’s version, please access the DOI link below./ Pour consulter la version de l’éditeur, utilisez le lien DOI ci-dessous.
https://doi.org/10.1186/s12896-015-0152-x
Access and use of this website and the material on it are subject to the Terms and Conditions set forth at Critical assessment of influenza VLP production in Sf9 and HEK293 expression systems
Thompson, Christine M.; Petiot, Emma; Mullick, Alaka; Aucoin, Marc G.; Henry, Olivier; Kamen, Amine A.
https://publications-cnrc.canada.ca/fra/droits
L’accès à ce site Web et l’utilisation de son contenu sont assujettis aux conditions présentées dans le site LISEZ CES CONDITIONS ATTENTIVEMENT AVANT D’UTILISER CE SITE WEB.
NRC Publications Record / Notice d'Archives des publications de CNRC:
https://nrc-publications.canada.ca/eng/view/object/?id=3e62c5eb-5603-435e-8d5f-c7eaaa5359e4 https://publications-cnrc.canada.ca/fra/voir/objet/?id=3e62c5eb-5603-435e-8d5f-c7eaaa5359e4
Ac
c
e
p
te
d
P
r
e
p
r
in
t
Bioprocess Engineering and Supporting Technologies Biotechnology and Bioengineering DOI 10.1002/bit.25600
Temporal Characterization of Protein Production Levels from Baculovirus
Vectors Coding for GFP and RFP Genes Under Non-Conventional Promoter
Control
†Steve George1, Altamash M Jauhar1, Jennifer Mackenzie1, Sascha Kieβlich1,2
, and Marc G Aucoin1,*
1
Waterloo Institute for Nanotechnology, Department of Chemical Engineering, University of Waterloo,
Waterloo, Ontario, Canada, N2L3G1 2
Technical University of Braunschweig, Braunschweig, Germany
*corresponding author: Marc G. Aucoin Department of Chemical Engineering University of Waterloo
Waterloo, ON
CANADA N2L 3G1
Tel: 1-519-888-4567 x36084 Fax:1-519-888-4347
E-mail address: maucoin@uwaterloo.ca
†This article has been accepted for publication and undergone full peer review but has not
been through the copyediting, typesetting, pagination and proofreading process, which may lead to differences between this version and the Version of Record. Please cite this article as doi: [10.1002/bit.25600]
Additional Supporting Information may be found in the online version of this article.
This article is protected by copyright. All rights reserved
Ac
c
e
p
te
d
P
r
e
p
r
in
t
Abstract
The ease of use and versatility of the Baculovirus Expression Vector System (BEVS) has made it one of the most widely used systems for recombinant protein production However, co-expression systems currently in use mainly make use of the very strong very late p10 and polyhedron (polh) promoters to drive expression of foreign genes, which does not provide much scope for tailoring expression ratios within the cell. This work demonstrates the use of different Autographa californica multicapsid nucleopolyhedrovirus (AcMNPV) promoters to control the timing and expression of two easily traceable fluorescent proteins, the enhanced green fluorescent protein (eGFP), and a red fluorescent protein (DsRed2) in a BEV co-expression system. Our results show that gene expression levels can easily be controlled using this strategy, and also that modulating the expression level of one protein can influence the level of expression of the other protein within the system, thus confirming the concept of genes “competing” for limited cellular resources. Plots of “expression ratios” of the two model genes over time were obtained, and may be used in future work to tightly control timing and levels of foreign gene expression in an insect cell co-expression system. This article is protected by copyright. All rights reserved
Keywords: co-expression, baculovirus expression vector system BEVS, insect cell, promoter control, reporter protein, infection
Ac
c
e
p
te
d
P
r
e
p
r
in
t
Introduction
The baculovirus expression vector – insect cell system is not only versatile for expressing significant quantities of proteins requiring post-translational modifications quickly; it is gaining significant traction as a production platform for complex biologics. Both the ability of the insect cells to receive multiple baculoviruses carrying different transgenes and/or the ability of the baculovirus vectors to carry multiple transgenes have made the system a darling of those studying and producing virus-like particles or products requiring the expression of ‘helper’ proteins (Sokolenko, et al. 2012). No matter the product requiring multiple proteins, it is unlikely that each protein needs to be expressed at the same level. Tailoring gene expression ratios is important in cases where the levels of proteins affect the composition of the final product (Tsao, et al. 1996), or when the expression of certain proteins has a detrimental on the cells (Urabe, et al. 2002). Furthermore, it can be argued that producing an excess of certain proteins is just a waste of cellular resources that could be otherwise channelled into useful product.
While there exists a number of studies describing polycistronic baculovirus vectors (Fitzgerald, et al. 2006; Fitzgerald, et al. 2007; Kanai, et al. 2013), controlled gene expression ratios have most predominantly been achieved by co-infection. While co-infection offers the flexibility of manipulating gene expression ratios by varying the multiplicity of infection (MOI) of individual baculovirus populations, the probabilistic nature of infection (Licari and Bailey 1992) means that not all cells will receive the same proportion of the transgenes in each cell. Co-expression systems generally make use of the very strong very late p10 and polyhedron (polh) promoters to drive expression of foreign genes. However, this does not provide much scope for tailoring gene product ratios within the cell. Given what is already known about baculovirus promoters and associated genetic elements system from studies on: the ie1 promoter (Jarvis, et al. 1996); the basic promoter (Bonning, et al. 1994; Chazenbalk and Rapoport 1995; Higgins, et al. 2003); the gp64 promoter (Grabherr, et al. 1997); the Pcappolh, a hybrid of the vp39 capsid and polh promoters (Thiem and Miller 1990); tandem ie1 promoters (Kojima, et al. 2001); synthetic early promoters (Blissard, et al. 1992), truncated p10 and ie1 promoters (Urabe, et al. 2002; Urabe, et al. 2006) and constitutive insect promoters like the Hsp70
Ac
c
e
p
te
d
P
r
e
p
r
in
t
promoter (Lu, et al. 1996; Prikhod'ko, et al. 1998); there is a dearth in the characterization of expression when these promoters are used in conjunction with the expression of a second gene under the control of a different promoter. At best, there are a few studies such as one by Urabe et al. (Urabe, et al. 2002) for the production of AAV2 vectors, and the subsequent work on that system (Aucoin, et al. 2006; Kohlbrenner, et al. 2005; Meghrous, et al. 2005). In addition two patents have been filed on the use of weaker baculovirus promoters to drive the expression of non-structural components for the production of virus-like particles (Hu and Lin 2013; Oker-Blom and Summers 1992), and there has been some work on an early baculovirus detection system utilizing an early promoter (Dalal, et al. 2005).
Beyond tailoring expression levels, there is also the ability to control the temporal nature of the expression with these promoters. Most characterization of the promoters, when used in conjunction with another promoter-gene element, simply look at the resulting production levels and do not acknowledge that the ‘sequence’ of events may also play a role in the overall product formation. It is also possible that by taking advantage of sequential gene expression, there is an advantage over trying to express all of the different elements at once. While there is some evidence that suggests that there is no resource limitation when expressing multiple proteins at once (Berger, et al. 2004), there is other evidence which suggests that competition may be a real effect. It has been shown that the deletion of the very-late p10 gene causes improved production from genes under the control of the very-late polh promoter (Chaabihi, et al. 1993; Hitchman, et al. 2010). Further evidence of competition comes from studies where co-expressing more than one chaperone protein actually caused a decrease in yield of the target protein of interest (Kato, et al. 2005; Tate, et al. 1999).
This work aims to demonstrate the use of different promoters in a polycistronic baculovirus to control the timing and expression of two easily traceable fluorescent proteins, the enhanced Green Fluorescent Protein (eGFP herein referred to simply as GFP) and a red fluorescent protein (DsRed2 herein referred to simply as RFP). The RFP gene is placed under the control of the very-late polh promoter, while the GFP gene was placed under the control of early (ie1), late (basic, gp64 and vcath) and very-late (p10) promoters.
Ac
c
e
p
te
d
P
r
e
p
r
in
t
Materials and Methods
Cell culture and baculovirus production
Spodoptera frugiperda clonal isolate 9 (Sf-9) cells (GIBCO, Carlsbad, CA, USA) were maintained in capped glass Erlenmeyer flasks in Sf-900III media (GIBCO, Carlsbad, CA, USA) at a temperature of 27 °C on an orbital shaker rotating at 130 rpm. Maintenance cell cultures were kept at a density between 0.5 and 4 ×10⁶ cells/ml.
Baculovirus construct generation
Five baculovirus constructs co-expressing GFP and RFP fluorescent proteins were generated for this work (Table 1). The GFP and RFP genes were isolated from plasmids pcDNA3-GFP and pCALNL-DsRed obtained from Addgene (Cambridge, MA, USA) using primers GFPF, GFPR, RFPF and RFPR (Table S1) using a Phusion® High-Fidelity polymerase (Thermo Scientific, Waltham, MA, USA). These genes were cloned into baculovirus transfer vector pAcUW51 (BD Pharmingen, San Diego, CA, USA) using overlap extension PCR as described in other works (Bryksin and Matsumura 2010). The resulting plasmid contained the GFP gene under control of a baculovirus p10 promoter and the RFP gene under the control of a baculovirus polyhedrin promoter. The p10 promoter was then replaced by four other AcMNPV promoters (ie1, basic, gp64 and vcath), using overlap extension PCR to create the vectors used in this work. The viruses were generated from these vectors using the BD BaculoGold™ Transfection Kit (BD Pharmingen, San Diego, CA, USA). The primers used to isolate the promoters, and allow for the insertion of these promoters into p10-GFP-RFP are given in Table S1. Two additional monocistronic viruses were created expressing either GFP or RFP. The genes were isolated as before using primers listed in Table S1, and then inserted into the plasmid pFastBac1 (Life Technologies Inc, Burlington, ON, Canada) using the EcoRI and BamHI sites in the MCS. The primers used for these constructs are also listed in Table S1. Viruses were generated from these constructs using the Bac-to-Bac® Baculovirus Expression System (Life Technologies Inc, Burlington, ON, Canada).
Ac
c
e
p
te
d
P
r
e
p
r
in
t
Cultures were seeded at 0.5 ×10⁶ cells/ml, allowed to grow to ~3x10⁶ cells/ml to reach a mid-exponential phase, diluted to 1x10⁶ cells/ml in fresh media and infected with various viruses. The cultures were allowed to proceed until the viability dropped to 70–80%, after which the culture medium was harvested and centrifuged at 1000 × g for 10 min in order to spin down cells and cell debris. The supernatant was removed and used as baculovirus stock for experiments.
Baculovirus Quantification
Virus samples were quantified by four different methods: end point dilution assay (Reed and Muench 1938, King and Possee 1992), real time PCR (George et al, 2012), flow cytometry (Shen, et al. 2002), and a growth cessation assay (see Supplementary information for more detail) . The titres obtained from the end point dilution assay were used to determine the quantity of virus to add to the cultures.
Co-expression experimental design
35 ml cell cultures at a density of 1 x 10⁶ cells/ml were infected with P2 stocks of the various viruses at MOIs of 5 or 25, in triplicate. Sampling was conducted at 0, 4, 8, 12, 16, 24, 36, 48, 72 and 96 hours post-infection (hpi), to capture both early and late events in the course of infection. Cell counts were conducted at each of these time points using a hemacytometer to determine cell density and viability. Samples were centrifuged at 300g for 7 minutes, after which the cell pellets were resuspended in a 2% solution of formaldehyde (Thermo Scientific, Rockford, IL, USA) in PBS and kept at 4ºC for one hour before analysis by flow cytometry. Controls included uninfected cultures, and cultures infected with monocistronic baculovirus vectors containing either GFP or RFP under the control of the polh promoter.
Flow cytometry analysis
Flow cytometry was conducted on a BD FACS Calibur (BD Biosciences, San Jose, CA, USA). The results were analyzed using FlowJo (Tree Star, Ashland, OR, USA).The threshold was based on FSC and was set at a value of 52, and served to remove small low scatter events. Green fluorescence was detected by the FL1 detector (emission 530, bandpass 30nm) and red fluorescence by the FL3 detector (emission 670 nm, longpass). All samples were analysed using a high flow rate (60 + 3 µl/min). Compensation was conducted to remove signal overflow from GFP fluorescence into the FL3 channel
Ac
c
e
p
te
d
P
r
e
p
r
in
t
and was set at 11.5% of the FL2 signal based on the level of fluorescence detected when cells were infected with a monocistronic vector containing the GFP gene.
Results
Virus stocks, progression of infection and effect on cells
Infection of the cultures with an MOI of 5 (and 25) resulted in synchronous infections as seen by growth cessation (Figure 1A and 1B). The rate of decrease of viability in different cultures between 24 and 96 hours post infection (hpi) was different for the different baculovirus vectors tested. Polycistronic vectors that led to the production of high levels of RFP were achieved (Figure 5) had higher rates of viability decrease (Figure 1C) compared to those where the production of RFP was compromised (ie1 and basic vectors). In the case of the basic vector, the appearance of RFP production also occurred later than for infection with the other vectors (Table III). It is possible that the viability of the cells may be, in part, affected by the accumulation of RFP within the cell.
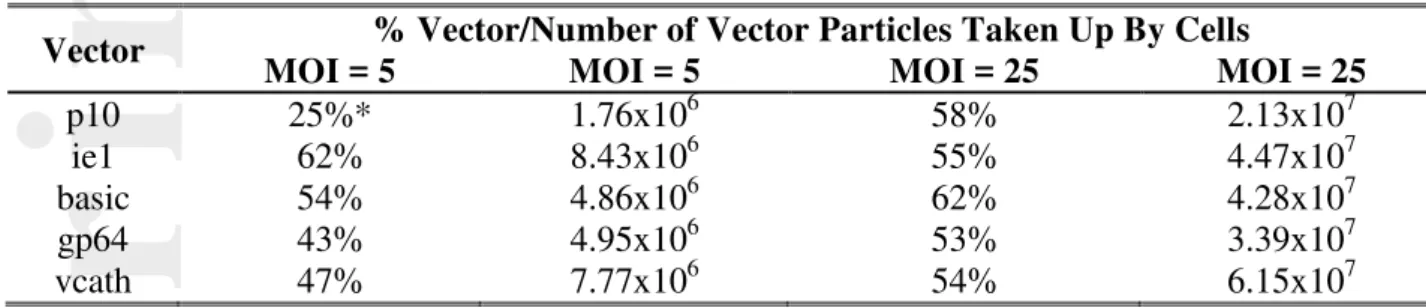
To probe this further to ensure that the vectors were not compromised by using the alternative promoters to drive GFP, we followed the progression of the virus infection (MOI of 5 and 25) by monitoring the levels of baculovirus in the supernatant using real time PCR (Figure 2). No significant differences were observed in the replication of different constructs at MOI 5 or 25 (Figure 2A and 2B). In addition, no differences in replication-capable progeny were observed by the end-point dilution assay (Figure 2C). Taken together, these results are reassuring for two reasons: 1) the amount of virus taken up did indeed allow for synchronous infection in all cases based on the immediate cessation in growth; and, 2) ~ five times as much virus was taken up for a five-fold increase in MOI (Table II).
GFP/RFP Production
The main objective of this work was to observe the expression patterns resulting from infection with baculoviruses having foreign genes controlled by non-conventional promoters. While the cells seemed to be mostly in a single population for the first 36–48 hours of infection, the formation of a secondary population can be seen starting at 48, becoming more apparent at 72 and increasing further
Ac
c
e
p
te
d
P
r
e
p
r
in
t
at 96 hours post-infection (two examples of which are seen in Figure 3). The number of events in the higher fluorescence population was found to correlate well with the overall viability of the culture (supplementary information). In addition, when the cultures were imaged by an ImageStreamX Mark II imaging flow cytometer (Amnis Corporation, Seattle, WA, USA ), the lower fluorescence population was found to be misshapen cells that seemed to be dying or dead (data not shown). The fluorescence of the high fluorescence population was used for subsequent analysis.
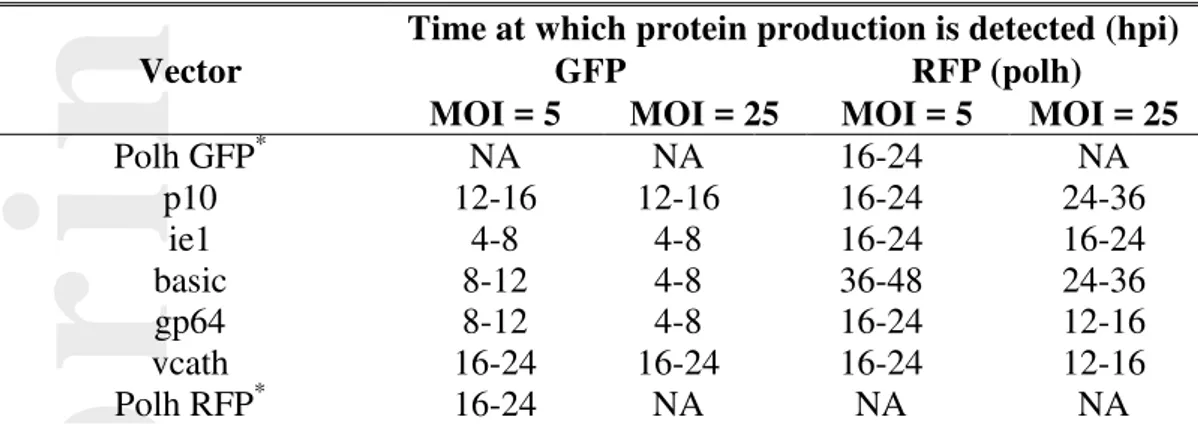
Figure 4 shows the relative overall levels of green and red fluorescence observed for MOI 5 and 25 infected cells over time. The start of GFP production varied depending on the promoter in front of the gene, with the earliest signals at an MOI of 5 emerging after 4 hours under ie1; 8-12 hours under basic, and gp64 control; 12-16 hours for p10; and 16-24 hours for vcath (Table III). Increasing the MOI to 25 caused the GFP signals from the basic and gp64 constructs to emerge at 4 hours, while the time of emergence in the other constructs was not affected. Of the constructs, the highest levels of GFP, as well as the fastest increase in GFP expression level was seen when the gene was placed under the control of the basic promoter. The heavily delayed emergence of any fluorescence signal when using the vcath vector could be due to the very weak strength of the vcath promoter, and not necessarily an indication of the start of vcath expression. GFP expression in the GFP single construct emerged only at 16–24 hours post infection.
The choice of the promoter in front of the GFP gene also influenced the appearance of the signal from RFP, which was under the control of the polh promoter. At MOI 5, most constructs, including the RFP single construct showed an RFP signal starting at 16-24 hours post-infection. However, the signal in the low GFP expressing vcath construct appeared much earlier (12–16 hours), while the high GFP expressing basic construct only showed an RFP signal at 36 hours post-infection, which could be due to the very high levels of GFP that were produced in this system early in the infection. Increasing the MOI to 25 had an almost universal effect of causing RFP signals to emerge earlier except for the p10 vector where RFP was detected later. The earlier emergence of signals with higher MOI was likely due to the increased number of viruses providing increased numbers of
Ac
c
e
p
te
d
P
r
e
p
r
in
t
templates for protein production. Alternatively, the increased numbers of viruses may have caused increase early gene expression, thereby accelerating the progression of viral infection. The delay in RFP for the p10 construct may be the direct result of overexpression of the GFP gene.
GFP production showed minimal increases after 48 hpi in most cases, while RFP production generally increased till 96 hpi. It should be noted that at 36 hours, for many of the systems tested, there is a decrease in the GFP fluorescence – a dip of sorts – that may be indicative of a dual regulation of protein production or may be related to the onset of RFP production. Differences in RFP production from the different vectors were evident with the low GFP producing systems producing much higher levels of RFP (Figure 5), except for the ie1 construct. High levels of GFP production earlier in the infection cycle (basic construct) caused a significant reduction in the amount of RFP produced. Single constructs, with GFP or RFP under the control of the polh promoter, produced the highest levels of fluorescence in all cases.
Ultimately, this study has allowed the creation of protein production ratio profiles (Figure 6). The figure shows that GFP and RFP production ratios vary widely between constructs. In general, GFP was always produced at a lower level than RFP, except in cells infected with the basic promoter, where GFP was present at a level greater than that of RFP till 36 hours post infection, following which GFP was present at roughly half the level of RFP. The vcath and gp64 constructs produced far more
RFP than GFP.
Discussion
Vector Alteration: Changing Promoter Sequences and Effect on Vectors
For over twenty years researchers have alluded to the benefits of offsetting expression levels through promoter control (Tate, et al. 1999), yet nobody has gone ahead and done a study to show how this should be done. Our belief is also that promoters can help stage an appropriate sequence of events that can lead to the efficient production of complex multi-protein molecules such as VLPs. This is in part based on evidence from natural systems such as influenza virus replication, where the rates of synthesis of different proteins differ over the course of the infection, with the Matrix (M) protein being
Ac
c
e
p
te
d
P
r
e
p
r
in
t
produced at the highest levels after the other genes have reached their peak production (Meier-Ewert and Compans, 1974). This could be due to the fact that the M protein which forms the inner layer of the influenza particle shell is only needed at later times during the virus replication cycle. The baculovirus system has an even more complex temporally separated protein production scheme with various transcription initiators being produced first, followed by structural proteins, with the outer protective proteinacious coats being produced only at the end (Rohrmann 2011).
This work aimed to demonstrate the utility of promoter control in a very simple two protein co-expression system where the proteins are not secreted and not believed to interact. The enhanced Green Fluorescent Protein (GFP) and DsRed 2 Red Fluorescent Protein (RFP) were further chosen because of their green and red fluorescence emissions, which enabled easy and accurate tracking of their production levels in infected cell cultures. Five different co-expressing virus constructs were generated for this experiment. In each of these, the RFP gene was placed under the control of a polh promoter, which activates at high levels during the very late phase of infection, at about 27 hpi (Bonning, et al. 1994). The promoter controlling expression of the GFP gene is varied between the five constructs: the p10 promoter, which activates during the very late phase of infection, at about 19 hpi (Bonning, et al. 1994); the basic promoter, which is active from about 13 hpi (Bonning, et al. 1994; Hill-Perkins and Possee 1990); the gp64 promoter, which activates in both the early phase (from 6 hpi) at low levels and during the late phase at much higher levels (from before 24 hpi) (Garrity, et al. 1997); and the vcath promoter, which activates during the late phase at around 22 hpi (Hodgson, et al. 2007; Hom, et al. 2002; Slack, et al. 1995). Our results agree with these findings for the most part, however, GFP was observed earlier when controlled with the p10 and basic promoters, likely due to the sensitivity detection used in this study.
It is known that MOI can play a role in overall gene expression levels as well as onset of protein expression and so, extreme care was taken to have ‘equivalent’ MOIs for experiments comparing different baculovirus constructs at MOIs of 5 and 25. Although titers via the different methods differed as expected (Figure S1), together the methods were a good indication of: the composition of the stocks; and the minimal interference to baculovirus replication that may have been
Ac
c
e
p
te
d
P
r
e
p
r
in
t
caused by using promoters that also drive essential genes. Given the fluctuations in seeding (Figure 2) it is expected that an MOI of 5 actually ranged from 4.3 to 8.8 and an MOI of 25 actually ranged from 27 to 50.
The effects of ‘re-using’ promoters that control the expression of native genes is not extensively documented. Virus replication is an important aspect of BEVS that could be affected by changing native expression patterns with the ‘re-use’ of native promoters. To examine this, baculovirus concentration in the media were measured by real-time PCR over the course of infections (Figure 2A and 2B). A further experiment was also conducted analysing replicative baculovirus titres at 48 hours post infection (Figure 2C). Both methods revealed that baculovirus replication did not vary between constructs. It still remains to be seen if any of the constructs are more prone to the production of defective interfering particles upon repeated passaging.
Effect of Promoters and MOI on the Detection of Green and Red Fluorescent Protein
It was hoped and expected that GFP levels would vary given that its expression is being driven by different promoters. However, it was also found that the emergence of RFP also varied between constructs. For the most part, the times of RFP emergence was around 16 – 24 hours post infection, including for the single construct. However, the basic construct, which showed high levels of early GFP expression, showed an RFP signal very late post infection (36 hours). The late emergence of the RFP signal is thought to be directly related to the amount of resources committed by the cell to producing GFP. The increase in MOI from 5 to 25 caused earlier emergence of RFP production, with production in the cultures infected with the basic, vcath and gp64 constructs showing signals up to 12 hours earlier. Of interest is the RFP fluorescence emanating from the vcath and gp64 virus infecting cultures, which can be seen at low levels as early as 12 hours post-infection. This further reinforces work by others, including Hu and Bentley (2001), which accounted for how increasing MOI can significantly accelerate the progression of infection in their models.
Effect of Promoter on GFP and RFP levels: Competing for Resources
Although there was no evidence of interference in terms of baculovirus replication, the idea that we might be creating or alleviating ‘competitive’ environments with the use of these different
Ac
c
e
p
te
d
P
r
e
p
r
in
t
promoters remained. The vcath and gp64 viruses produced the least amount of GFP, and the highest levels of RFP, while the basic construct, which expressed GFP at very high levels early during infection, produced far lower amounts of RFP than the p10 construct. These conclusions are further supported by data from the single constructs producing only GFP or RFP, which show greater levels of gene expression than any of the dual constructs (Figure 6A and C). In addition, co-infecting the two single constructs (overall MOI of 10) decreased the production of fluorescence molecules compared to cells infected with only the single foreign gene vectors, or cells infected with the p10 construct. The ie1 construct was an exception to the above observations, as it drove low levels of both GFP and RFP. It is thought that this may be related to some type of interference with the production of early transcriptional factors. Otherwise, this could be because of some form of regulation of the polh promoter by the spatially close ie1 promoter within the construct.
Effect of MOI on GFP and RFP levels: Competing for Resources
Many examples of ‘production saturation’ exist in literature. Excessive multiplicity of infections (MOI) have indeed lowered of the amount of recombinant protein produced in some systems as far back as a study done on the production of β-galactosidase where infection of a culture at an MOI of 50 resulted in a poorer performance compared with infections at MOIs of 0.05, 0.5 and 5 (Bedard, et al. 1994). In our system, it was thought that the increase in MOI from 5 to 25 would increase the competition phenomenon, especially for those constructs with promoters driving late gene expression. For most of the constructs, there was very little improvement in the levels of GFP and RFP observed when increasing the MOI; however, despite the minimal increase in protein production, the results showed that there is a form of competition that arises from the expression of a secondary foreign protein. This was seen from the differing levels of RFP produced, despite always being under the control of the polh promoter. In the cases where there was infection with the vcath and gp64 constructs, significant increases in RFP levels with infection at the higher MOIs were observed, giving rise to the notion that the cell has a total protein capacity that can be utilized in many different ways depending on the promoter combinations used to drive gene expression and protein production.
Ac
c
e
p
te
d
P
r
e
p
r
in
t
This research also has implications for new high capacity multiprotein production systems such as the MultiBac system (Fitzgerald, et al. 2006; Fitzgerald, et al. 2007), where nutrient limitations may be important when producing proteins at high levels. In these systems, multiple genes are expressed at very high levels under the control of very strong promoters, thereby competing for limited resources. The utility of these systems lies in their ability to express complex protein structures such as virus-like particles with several virus components, and enzyme complexes to perform complex reactions. However, overexpression of some components could lead to sub-optimal protein ratios in the final product, and cause reduced expression of correctly assembled product containing appropriate ratios of component proteins. In addition, high expression of genes that are not needed in large quantities can lead to a “waste” of cellular resources that could be used for the production of other proteins. It is possible that in some cases, inappropriate protein ratios and wasted cell resources make it impossible to use this system for the production of complex proteins. This paper demonstrates the use of different promoters to control the timing and expression of genes within BEVS, which we believe is the next step in improving the system for the production of complex proteins. In addition to the large number of promoters available within the baculovirus genome, foreign protein production can be further modulated by the use of baculoviral and other regulatory elements such as homologous regions (HRs) (Guarino, et al. 1986; Ishiyama and Ikeda 2010), as well as non-baculoviral, and truncated (Urabe, et al. 2002; Urabe, et al. 2006), hybrid (Thiem and Miller 1990) or tandem (Kojima, et al. 2001) promoters that extend the duration of protein production, or change expression levels of native promoters. Artificial promoters (Blissard, et al. 1992; Rankin, et al. 1988) may also be used for modulating expression levels.
Conclusions
A detailed profile of expression levels over the entirety of the infection period by different vectors has been created and lends itself to serving as a template for “designing” expression systems in which the timing and expression level of different proteins can help in the optimization of product formation. Furthermore, this work shows that the expression of a gene under the control of one
Ac
c
e
p
te
d
P
r
e
p
r
in
t
promoter can influence the production of protein whose gene was controlled by another. Only one construct did not adhere to this theory: the ie1 construct. The latter resulted in low levels of both GFP and RFP, a result attributed in part by the fact that the ie1 promoter is recognized by a different polymerase, namely DNA polymerase II. In addition, this work should serve to stimulate further research into the use of other baculovirus promoters, enhancer regions, and non-native promoters and other control elements within the baculovirus insect cell system, which can be characterized to enhance the ability to rationally design the ‘expression’ system.
Acknowledgments
This work was supported by an NSERC Discovery and NSERC Strategic Network (MabNet) to MGA. The authors would like to thank Prof. Maud Gorbet of the Department of Systems Design Engineering for access to her lab, and Dr. Eric Jervis of Stem Cell Technologies (formerly of the Department of Chemical Engineering at the University of Waterloo).
References
Aucoin MG, Perrier M, Kamen AA. 2006. Production of adeno-associated viral vectors in insect cells using triple infection: optimization of baculovirus concentration ratios. Biotechnol Bioeng 95:1081-1092.
Bedard C, Kamen A, Tom R, Massie B. 1994. Maximization of recombinant protein yield in the insect cell/baculovirus system by one-time addition of nutrients to high-density batch cultures. Cytotechnology 15:129-138.
Berger I, Fitzgerald DJ, Richmond TJ. 2004. Baculovirus expression system for heterologous multiprotein complexes. Nat Biotech 22:1583-1587.
Blissard GW, Kogan PH, Wei R, Rohrmann GF. 1992. A synthetic early promoter from a baculovirus: Roles of the TATA box and conserved start site CAGT sequence in basal levels of transcription. Virology 190:783-793.
Ac
c
e
p
te
d
P
r
e
p
r
in
t
Bonning BC, Roelvink PW, Vlak JM, Possee RD, Hammock BD. 1994. Superior expression of juvenile hormone esterase and beta-galactosidase from the basic protein promoter of Autographa californica nuclear polyhedrosis virus compared to the p10 protein and polyhedrin promoters. J Gen Virol 75 ( Pt 7):1551-1556.
Bryksin AV, Matsumura I. 2010. Overlap extension PCR cloning: a simple and reliable way to create recombinant plasmids. BioTechniques 48:463-465.
Chaabihi H, Ogliastro MH, Martin M, Giraud C, Devauchelle G, Cerutti M. 1993. Competition between baculovirus polyhedrin and p10 gene expression during infection of insect cells. J. Virol. 67:2664-2671.
Chazenbalk GD, Rapoport B. 1995. Expression of the Extracellular Domain of the Thyrotropin Receptor in the Baculovirus System Using a Promoter Active Earlier than the Polyhedrin Promoter. J. Biol. Chem. 270:1543-1549.
Dalal NG, Bentley WE, Cha HJ. 2005. Facile monitoring of baculovirus infection for foreign gene expression under very late polyedrin promoter using green fluorescent protein reporter under early-to-late promoter. Biochem Eng J 24:27-30.
Fitzgerald DJ, Berger P, Schaffitzel C, Yamada K, Richmond TJ, Berger I. 2006. Protein complex expression by using multigene baculoviral vectors. Nat Meth 3:1021-1032.
Fitzgerald DJ, Schaffitzel C, Berger P, Wellinger R, Bieniossek C, Richmond T, Berger I. 2007. Multigene expression Strategy for Structural Biology of Eukaryotic Complexes. Structure 15:275-279.
Garrity DB, Chang M, Blissard GW. 1997. Late Promoter Selection in the Baculovirusgp64 Envelope Fusion ProteinGene. Virology 231:167-181.
George S, Sokolenko S, Aucoin MG. 2012. Rapid and cost-effective baculovirus sample preparation method as a viable alternative to conventional preparation for quantitative real-time PCR. J Virol Methods 182:27-36.
Grabherr R, Ernst W, Doblhoff-Dier O, Sara M, Katinger H. 1997. Expression of foreign proteins on the surface of Autographa californica nuclear polyhedrosis virus. BioTechniques 22:730-735.
Ac
c
e
p
te
d
P
r
e
p
r
in
t
Guarino LA, Gonzalez MA, Summers MD. 1986. Complete Sequence and Enhancer Function of the Homologous DNA Regions of Autographa californica Nuclear Polyhedrosis Virus. J. Virol. 60:224-229.
Higgins MK, Demir M, Tate CG. 2003. Calnexin co-expression and the use of weaker promoters increase the expression of correctly assembled Shaker potassium channel in insect cells. Biochimica et Biophysica Acta (BBA) - Biomembranes 1610:124-132.
Hill-Perkins MS, Possee RD. 1990. A baculovirus expression vector derived from the basic protein promoter of Autographa californica nuclear polyhedrosis virus. J Gen Virol 71 ( Pt 4):971-976. Hitchman RB, Possee RD, Crombie AT, Chambers A, Ho K, Siaterli E, Lissina O, Sternard H, Novy
R, Loomis K, Bird LE, Owens RJ, King LA. 2010. Genetic modification of a baculovirus vector for increased expression in insect cells. Cell Biol Toxicol 26:57-68.
Hitchman RB, Siaterli EA, Nixon CP, King LA. 2007. Quantitative Real-Time PCR for Rapid and Accurate Titration of Recombinant Baculovirus Particles. Biotechnol. Bioeng. 96:810-814
Hodgson JJ, Arif BM, Krell PJ. 2007. Reprogramming the chiA expression profile of Autographa californica multiple nucleopolyhedrovirus. J Gen Virol 88:2479-2487.
Hom LG, Ohkawa T, Trudeau D, Volkman LE. 2002. Autographa californica M Nucleopolyhedrovirus ProV-CATH is Activated during Infected Cell Death. Virology 296:212-218.
Hu YC, Bentley WE. 2001. Effect of MOI ratio on the composition and yield of chimeric infectious bursal disease virus-like particles by baculovirus co-infection: deterministic predictions and experimental results. Biotechnol Bioeng 75:104-19.
Ishiyama S, Ikeda M. 2010. High-level expression and improved folding of proteins by using the vp39 late promoter enhanced with homologous DNA regions. Biotechnol Lett 32:599-614.
Jarvis DL, Weinkauf C, Guarino LA. 1996. Immediate-early baculovirus vectors for foreign gene expression in transformed or infected insect cells. Protein Expr Purif 8:191-203.
Ac
c
e
p
te
d
P
r
e
p
r
in
t
Kanai Y, Athmaram TN, Stewart M, Roy P. 2013. Multiple large foreign gene expression by a single recombinant baculovirus: A system for production of multivalent vaccines. Protein Expr Purif 91:77-84.
Kato T, Murata T, Usui T, Park EY. 2005. Improvement of the production of GFPuv- β1,3-N-acetylglucosaminyltransferase 2 fusion protein using a molecular chaperone-assisted insect-cell-based expression system. Biotechnol Bioeng 89:424-433.
King LA, Possee RD. 1992. The Baculovirus Expression System. A Laboratory Guide. London:Chapman & Hall.
Kohlbrenner E, Aslanidi G, Nash K, Shklyaev S, Campbell-Thompson M, Byrne BJ, Snyder RO, Muzyczka N, Warrington KH,Jr, Zolotukhin S. 2005. Successful production of pseudotyped rAAV vectors using a modified baculovirus expression system. Mol Ther 12:1217-1225.
Kojima K, Hayakawa T, Asano S, Bando H. 2001. Tandem repetition of baculovirus ie1 promoter results in upregulation of transcription. Arch Virol 146:1407-1414.
Licari P, Bailey JE. 1992. Modeling the population of baculovirus-infected insect cells: optimizing infection strategies for enhanced recombinant protein yields. Biotechnol Bioeng 39:432-441. Lo H, Chao Y. 2004. Rapid Titer Determination of Baculovirus by Quantitative Real-Time
Polymerase Chain Reaction. Biotechnol Prog 20:354-360.
Lu A, Seshagiri S, Miller LK. 1996. Signal Sequence and Promoter Effects on the Efficacy of Toxin-Expressing Baculoviruses as Biopesticides. Biol Control 7:320-332.
Meghrous J, Aucoin MG, Jacob D, Chahal PS, Arcand N, Kamen A. 2005. Production of Recombinant Adeno-Associated Viral Vectors Using a Baculovirus/Insect Cell Suspension Culture System: From Shake Flasks to a 20-L Bioreactor. Biotechnol. Prog. 21(1):154-160
Meier-Ewert H, Compans RW. 1974. Time Course of Synthesis and Assembly of Influenza Virus Proteins. J. Virol. 14:1083-1091.
Prikhod'ko GG, Popham HJR, Felcetto TJ, Ostlind DA, Warren VA, Smith MM, Garsky VM, Warmke JW, Cohen CJ, Miller LK. 1998. Effects of Simultaneous Expression of Two Sodium
Ac
c
e
p
te
d
P
r
e
p
r
in
t
Channel Toxin Genes on the Properties of Baculoviruses as Biopesticides. Biological Control 12:66-78.
Rankin C, Ooi BG, Miller LK. 1988. Eight base pairs encompassing the transcriptional start point are the major determinant for baculovirus polyhedrin gene expression. Gene 70:39-49.
Reed LJ, Muench H. 1938. A simple method of estimating fifty percent endpoints. Am J Hyg 27:493-497.
Rohrmann GF. 2011. Baculovirus Molecular Biology: Second Edition [Internet]. Bethesda (MD):National Center for Biotechnology Information (US).
Shen CF, Meghrous J, Kamen A. 2002. Quantitation of baculovirus particles by flow cytometry. J Virol Methods 105:321-330.
Slack JM, Kuzio J, Faulkner P. 1995. Characterization of v-cath, a cathepsin L-like proteinase expressed by the baculovirus Autographa californica multiple nuclear polyhedrosis virus. J. Gen. Virol. 76:1091-1098.
Sokolenko S, George S, Wagner A, Tuladhar A, Andrich JMS, Aucoin MG. 2012. Co-expression vs. co-infection using baculovirus expression vectors in insect cell culture: Benefits and drawbacks. Biotechnol Adv 30:766-781.
Tate CG, Whiteley E, Betenbaugh MJ. 1999. Molecular Chaperones Stimulate the Functional Expression of the Cocaine-sensitive Serotonin Transporter. J. Biol. Chem. 274:17551-17558. Thiem SM, Miller LK. 1990. Differential gene expression mediated by late, very late and hybrid
baculovirus promoters. Gene 91:87-94.
Tsao EI, Mason MR, Cacciuttolo MA, Bowen SH, FolenaWasserman G. 1996. Production of Parvovirus B19 Vaccine in Insect Cells Co-Infected with Double Baculoviruses. Biotechnol Bioeng 49:130-138.
Urabe M, Ding CT, Kotin RM. 2002. Insect cells as a factory to produce adeno-associated virus type 2 vectors. Hum Gene Ther 13:1935-1943.
Ac
c
e
p
te
d
P
r
e
p
r
in
t
Urabe M, Nakakura T, Xin KQ, Obara Y, Mizukami H, Kume A, Kotin RM, Ozawa K. 2006. Scalable generation of high-titer recombinant adeno-associated virus type 5 in insect cells. J Virol 80:1874-1885.
Urabe M, Ding C, Kotin RM. 2002. Insect Cells as a Factory to Produce Adeno-Associated Virus Type 2 Vectors. Hum Gene Ther 13:1935-1943.
Urabe M, Nakakura T, Xin K, Obara YaM,Hiroaki, Kume A, Kotin RM, Ozawa K. 2006. Scalable Generation of High-Titer Recombinant Adeno-Associated Virus Type 5 in Insect Cells. J Virol 80:1874-1885.
Ac
c
e
p
te
d
P
r
e
p
r
in
t
Figure Captions
Figure 1: Cell density of cultures infected at MOIs of A) 5 and B) 25 obtained from hemacytometer counts. 35 ml cultures were either infected with the p10, ie1, basic, gp64 or vcath vectors. Control cultures remained uninfected. C) Rate of viability decrease between 24 and 96 hours post infection in the cultures infected with the p10, ie1, basic, gp64 or vcath vectors. All conditions were done in triplicate. Error bars represent 1 standard deviation above and below means.
Figure 2: Virus counts in cell culture supernatant as determined using real-time PCR to determine genome counts or end point dilution assay for infectious virus. A) Time-course tracking of baculovirus by real-time PCR for cultures infected at MOI 5. B) Time-course tracking of baculovirus by real-time PCR for cultures infected at MOI 25. Inset figures show genome counts at early time points post-infection. C) Titres of replication competent baculovirus at 48 hours post-infection for the various cultures infected at an MOI of 5.
Figure 3: Representative flow cytometer scatterplots showing population distributions in cultures infected with basic and gp64 constructs over time. The plots compare values of red (FL3) and green (FL1) fluorescence over time post infection. Hollow arrows indicate movement of populations as infection progresses.
Figure 4: Relative GFP and RFP fluorescent levels in cells. GFP levels in cells infected at A) MOI of 5; and B) MOI of 25. RFP levels in cells infected at C) MOI of 5, and D) MOI of 25. The plotted values are obtained from triplicate flasks, and represent the geometric means of high fluorescence cell populations in cell cultures. Error bars represent 1 standard deviation above and below the mean.
Figure 5: Maximum levels of A) green and B) red fluorescence in cell cultures infected at MOIs 5 and 25 with the p10, ie1, basic, gp64 or vcath polycistronic vectors, or the polh-GFP and polh-RFP monocistronic constructs. The plotted values are the averages of fluorescence means of cell
Ac
c
e
p
te
d
P
r
e
p
r
in
t
populations, multiplied by the total number of events to give the “culture fluorescence” from triplicate flasks. Error bars represent 1 standard deviation above and below means.
Figure 6: GFP/RFP production ratio profiles over the course of cell culture infection with the p10, ie1, basic, gp64 and vcath vectors at A) MOI of 5, and B) MOI of 25.
Ac
c
e
p
te
d
P
r
e
p
r
in
t
Table I: Baculovirus constructs used in the experiments shown in this paper. All baculoviruses have been generated from pAcUW51. These constructs are referred to in the paper by the names given in the brackets ().
Construct Name Description
Promoter 1 Gene 1 Promoter 2 Gene 2
p10-GFP-RFP (p10) p10 GFP Polh RFP
ie1-GFP-RFP (ie1) ie1 GFP Polh RFP
basic-GFP-RFP (basic) basic GFP Polh RFP gp64-GFP-RFP (gp64) gp64 GFP Polh RFP vcath-GFP-RFP (vcath) polh GFP polh RFP vcath polh polh GFP GFP RFP Polh RFP
Ac
c
e
p
te
d
P
r
e
p
r
in
t
Table II: Average percent of vector taken up in co-expression experiments at MOIs of 5 and 25. Values were calculated by comparing vector genome titers in the supernatant at 0 and 4 hours post infection by real-time PCR (see supplementary information for details on methodology).
Vector % Vector/Number of Vector Particles Taken Up By Cells
MOI = 5 MOI = 5 MOI = 25 MOI = 25
p10 25%* 1.76x10⁶ 58% 2.13x10⁷
ie1 62% 8.43x10⁶ 55% 4.47x10⁷
basic 54% 4.86x10⁶ 62% 4.28x10⁷
gp64 43% 4.95x10⁶ 53% 3.39x10⁷
vcath 47% 7.77x10⁶ 54% 6.15x10⁷
Ac
c
e
p
te
d
P
r
e
p
r
in
t
Table III: Times of detectable fluorescent protein detection.
Vector
Time at which protein production is detected (hpi)
GFP RFP (polh)
MOI = 5 MOI = 25 MOI = 5 MOI = 25
Polh GFP* NA NA 16-24 NA p10 12-16 12-16 16-24 24-36 ie1 4-8 4-8 16-24 16-24 basic 8-12 4-8 36-48 24-36 gp64 8-12 4-8 16-24 12-16 vcath 16-24 16-24 16-24 12-16 Polh RFP* 16-24 NA NA NA