Battery Storage System Sizing Evaluation for Utility Distribution
Asset Investment Deferral
By Sandy Yuan
B.S. Mechanical Engineering Stanford University, 2011
Submitted to the MIT Sloan School of Management and the Mechanical Engineering Department in Partial Fulfillment of the Requirements for the Degrees of
Master of Business Administration and
Master of Science in Mechanical Engineering
In conjunction with the Leaders for Global Operations Program at the Massachusetts Institute of Technology
June 2017
Sandy Yuan. All rights reserved.
The author hereby grants to MIT permission to reproduce and to distribute publicly paper and electronic copies of this thesis document in whole or in part in any medium now known
or hereafter created. Signature of Auth Certified by: Certified by: Certified by: Certified by: Approved by: MASSACHUSETTS I OF TECHNOL
JUN 2
0
2
LIBRARI
Signature redacted
nr:MIT Sloan School of7I n/gement, Department of Mechanical Engineering
Signature redacted
__Georgia Perakis, Thesis Supervisor William F. Pounds Professor of Management Science
________Signature
redacted
_James Kirtley, Thesis Supervisor
-- .Professor of Electrical Engineering
Signature redacted
Konstantin Turitsyn, Thesis Reader _ -- ts-ciate Professor of Mechrnical Engineering
_____ _____
Signature redacted
NMaufa Herson, Director of MBA Program MIT Sloan School of Management
__________
Signature redacted
Rohan Abeyaratne, Professor and SAduate Officer MIT Mechanical Engineering
NSTITUTE )GY 1
017
ES
ARCHIVES
Battery Storage System Sizing Evaluation for Utility Distribution
Asset Investment Deferral
By
Sandy Yuan
Submitted to the MIT Sloan School of Management and the MIT Department of Mechanical Engineering on May 12, 2017 in partial fulfillment of the requirements for the degrees of Master of Business Administration and
Master of Science in Mechanical Engineering Abstract
A need exists for systematic evaluation methods of battery storage sizing
as an electric utility asset investment. Atlantic Electric, like many US utilities, has begun to consider battery energy storage systems for multiple applications, and will likely continue to evaluate potential investments in energy storage in the future.
This thesis developes and evaluates three sizing methodologies for battery energy storage systems for a reliability application at an electric distribution substation. The methods are applied to three substation locations using real historical load data to understand the required supplemental capacity provided by on-site battery storage energy systems in situations of peak demand coinciding with N-1 contingency. The study also includes analysis of business processes for asset planning and recommendations.
The results of the analysis indicate that deterministic conservative sizing methods, when compared to a probabilistic historical risk-based method, yield battery size that is significantly larger. The most conservative battery size, which would cover the most extreme capacity needs, is approximately twice the size of the risk-based battery size, which would cover approximately 80% of capacity need events.
Going forward, the methodologies from this thesis can be developed further for evaluating battery storage systems for reliability applications among diverse conditions and use cases. Furthermore, integrating multiple use cases and potential value streams for battery storage systems in utility operations will involve cross-functional and comprehensive processes for evaluation in the future.
Thesis Supervisor: Georgia Perakis
Title: William F. Pounds Professor of Management Science, MIT Sloan School of Management
Thesis Supervisor: James Kirtley
Title: Professor, Department of Electrical Engineering Thesis Supervisor: Konstantin Turitsyn
Acknowledgements
I would like to thank Atlantic Electric, specifically: Edward Young; Mackay Miller; Ozan Baskan; Jorge Calzada; Mike Donohue; US Strategy, Group Technology, Asset Planning, Advanced Analytics teams; and many others for their help and support throughout my internship.
I'd like to thank my thesis advisors, Jim Kirtley, Georgia Perakis, and Kostya Turitsyn for their support of this work.
I'd like to thank the Leaders for Global Operations program for their guidance throughout my two years on campus.
I'd like to thank my fellow LGO classmates for making this experience
unforgettable. Thank you for being friends, mentors, and oustanding
individuals throughout these incredible two years and beyond.
And last but certainly not least, I'd like to thank my family and friends for
their love and support throughout. This would not have been possible
Table of Contents
1
Introduction ... 91.1 Problem Statem ent...9
1.2 Com pany Background ... 10
1.3 Grid-Scale Energy Storage Today ... 10
1.4 Atlantic Electric Current Asset Planning Process ... 14
1.5 Atlantic Electric Internal Site Evaluation... 16
1.6 Battery Storage M odeling Literature Review ... 17
1.7 Contributions and Outline ... 19
2 Battery Storage Analysis ... 19
2.1 Inputs ... 19
2.2 Forecasting ... 21
2.3 Battery Storage Technology ... 29
3 Battery Storage System Sizing ... 32
3.1 Area A Substation Background... 32
3.2 M ethod 1: Plan to Peak ... 36
3.2.1 Battery Unit Cost Assumptions ... 39
3.3 M ethod 2: Cost Economics... 41
3.3.1 Value of Lost Load ... 45
3.4 M ethod 3: Historical Analysis ... 47
3.4.1 M onte Carlo Sim ulation ... 51
3.5 Application to Other Sites... 53
3.6 Business Process Analysis ... 55
4 Recom mendations and Conclusions ... 56
4.1 Battery Storage Evaluation M ethodology Implications... 56
4.2 Battery Storage Evaluation Business Process Recommendations ... 58
4.3 Conclusions... 59
List of Figures
Figure 1: GTM Research US Annual Energy Storage Deployment Forecasts... 11
Figure 2: US Annual Utility Scale Energy Storage Deployment Forecasts ... 12
Figure 3 Area A Substation Load Profile by Hour of Day ... 22
Figure 4: August Peak Day Load Shape for 2016... 22
Figure 5: Joint Electric Load versus Average Daily Temperature... 24
Figure 6: Joint Electric Load versus Percent Daily Humidity for Higher T em perature D ays ... 24
Figure 7: Joint Electric Load versus Average Daily Wind Speed... 25
Figure 8: Joint Electric Load versus Average Daily Light... 25
Figure 9: Joint Electric Load versus Average Ambient Pressure ... 26
Figure 10: Area A Substation Temperature Above Threshold versus Load... 27
Figure 11: Temperature versus T10 and T20 Cumulative Load by Year... 28
Figure 12: Linear Regression Results Comparison, Temperatures versus Cumulative L oad b y Y ear ... 29
Figure 13: Quarterly Energy Storage Deployment Share by Technology... 30
Figure 14: Comparison of Battery Technologies... 31
Figure 15: Electric Load Distribution by M onth... 33
Figure 16: Method One: Plan to Peak Example Plot of Battery Discharge... 38
Figure 17: Utility-Scale Storage Price Trends ... 40
Figure 18: Cost Economics Method Sensitivity Analysis... 43
Figure 19: Cost Economics Method Overall Cost versus Value of Lost Load ... 44
Figure 20: Distribution of Potential Event Cumulative Capacity ... 48
Figure 21: Reliability versus Required Battery Capacity ... 49
Figure 22: Monte Carlo Simulation Distribution Result... 52
Figure 23: Normalized Reliability Proxy versus Battery Capacity Size ... 54
Figure 24: Current Asset Planning Business Process ... 55
1
Introduction
1.1
Problem Statement
In collaboration with Atlantic Electric, this thesis develops processes and methods to size a battery storage system for transmission and distribution (T&D) deferral in an electric sub-station as an option to consider
during the asset planning process. Specifically, the evaluation focused on
capital cost of battery and a reliability application in N-1 contingency events during peak demand.
Existing studies in industry and academia focus on comprehensive systems analysis, often incorporating other potential revenue generating streams of battery storage. In this thesis, added value streams are excluded to better identify the advantages of a battery storage system in a cost and
reliability driven decision-making process. Thus, cost is isolated as the
driving metric of selection to compare to reliability and coverage in extreme
situations. The site-specific analysis of real data in a sub-station provides
insights into how, in a reliability-only focus, battery storage might become an attractive option for deferral of traditional transmission and distribution asset investment.
The thesis's scope focuses on existing processes, in order to provide realistic recommendations for Atlantic Electric, an organization that would consider incorporating battery storage system evaluation into current standard operating procedures related to capital investments. Organizational dynamics around existing structures, processing, and planning for the future are taken into account in parallel.
1.2 Company Background
Atlantic Electric USA is a gas and electric utility that serves over
30,000 customers in its service territory. Atlantic Electric and regulators set
electric rates for customers periodically, based on in-depth analyses of capital costs, delivery costs, and required margin to continue operations. To ensure affordable and reasonable rates, the company must balance its need for cost recovery with critical infrastructure investments in the network. Regulators review investments and deem them prudent for operations, in order to protect consumers from unjust rate hikes.
Many of the capital costs associated with ongoing operations are determined during the network planning studies that occur periodically. These studies require multidisciplinary collaboration among engineers, regulators, strategy, and others to analyze each aspect of operations within a
given network area. They then come up with required infrastructure
investments and upgrades, and present multiple options with a
recommendation that often favors the least cost option. Traditional types of investmens included purchase or upgrades of existing equipment such as transformers or lines.
1.3 Grid-Scale Energy Storage Today
Up until recent years, utilities have been slow to systematically
expand battery storage installation, in large part due to relatively high unit costs. Interest in grid-scale battery storage has been motivated by several applications: peak load shaving, smoothing of renewable energy, capital deferral, system reliability, and other ancillary services.
According to the US Department of Energy, there will be continued growth in deployments of battery storage, projected to be over 2 GW of annual deployments per year by 20211. Figure 1 shows the forecasted energy
storage deployment in the United States, split by residential, non-residential
(likely commercial), and utility customers. Utilities are forecasted to
continue to be the largest deployers of energy storage.
U S. Annual Energy Storage Deployment Forecast, 2012-2021E (MW) 2,2O 2.000 1,600 L400 L200 00 2012 3 2.119 X512 A655 2014 2015 201W0 6 7 --IM
0 Qesi&etaeI E~ NoCPe etml
7,000 3,000 2.000 G=m 51 W 6 20W 2W1 2W1 0 Resiadulz. 5W0
2016E 2017E 2018E 2019E
- - 1dea 0 Utity
Figure 1: GTM Research US Annual Energy Storage Deployment Forecasts MW and MWh; GTM Research U.S. Energy Storage Monitor Q3 2016)
In August 2016, Southern California Edison (SoCal Edison) and San Diego Gas & Electric's (SDG&E) filed a request for rapid approval of lithium-ion battery storage projects accounting for more than 50 megawatts of storage. This action demonstrated that it is possible for utilities to justify battery storage when there is a demonstrated and urgent need. In the case of SoCal Edison and SDG&E, the shutdown of the Aliso Valley natural-gas storage facility due to safety issues resulted in a decrease in overall system capacity0 11 . The shutdown provided an added risk of service disruptions to a
significant number of customers in the region. There are other examples of
this as well, in large part due to the requirements set under the state of
-.
I
California's broader storage mandate to require the state's utilities to procure
a total of 1.3 GW of energy storage by 2020. California has led the way
with grid-scale storage, and is poised to continue leading battery storage system installations. Texas will also play a large part in the market growth, and the Northeast US is predicted to also be a leading area in terms of utility-scale storage deployment in the future (see Figure 2).
U.S. Quarterly Utility-Scale Energy Storage Deployments (M.
50
20 Q1204 O22OS4 032014 Qt2014
N Hawaii MH=achSettz U New Jersey
Qi 2015
*Ne .York
Q2 2015 Q12015 042015 Q12016 022016
a PJM (Ex. NJ TeKa: All Other
S Ann00a U Lt- te nrgy 1-uage Depcj rnent C.rec st, 4lcLuiL N
IM1 780 600 5" 202 81 2012 MAmm 43 H Cakfamns 5B 20M i E HumO 373 192 2M -2M2 20158 2017f 2015 2015
N kMsinma= WU )&jsay N NMWyU*t U PM4 CE. NI" NT.. E AN Odhr
Figure 2: US Annual Utility Scale Energy Storage Deployment Forecasts
(GTM Research U.S. Energy Storage Monitor
Q3
2016)Combining grid-scale energy storage with intermittent renewables can provide multiple capacity and reliability benefits to the network. For example, Green Mountain Power in Vermont has deployed storage technology in combination with solar energy (2.5-MW solar and 4-MW
ii
EU 45 40 35 30 25 20 15 10 5 0U
Q32013 M Califomis Q1203 QZ mi 0Ariz3naI
e
.5I
lithium ion battery) to shave peak demand load and therefore lower costs for their customers.
In addition to combining storage with renewables, there is interest in understanding the additional benefits of grid-scale battery storage. Pacific Gas & Electric (PG&E) performed a comprehensive pilot study to consider both participation in markets and reliability as a combined use case for battery systems in its network'91. The findings of the multi-year study, published in 2016, were multifold. Among many, one interesting conclusion was a confirmation of past theoretical analysis: participation in wholesale markets is necessary for battery cost-effectiveness. Other benefits for storage include frequency regulation in the grid. There are more than 250 megawatts of energy storage installed for frequency regulation purposes in the Midwest and Mid-Atlantic on the PJM Interconnection Grid2 .
Many types of actors exist as generators and distributors of energy. Atlantic Electric owns transmission and distribution infrastructure in its network. Because the utility purchases and sells electricity using this infrastructure, its customers pay a rate-based fee for the actual electricity used as well as a transmission/distribution fee. Atlantic Electricity does not
generate the power that customers use. Their ability to own 'generation'
assets like solar or to participate in wholesale markets remains unconfirmed, thus motivating a cost-focused scope for this project analysis. Specifically, this analysis is aimed at understanding whether, given current operating norms of no participation in wholesale markets, battery storage could be a viable option when compared to conventional upgrade or investment options.
Recent industry cases have demonstrated that storage projects can be scoped, justified, and proposed in a reasonable timeline if the right processes and organizational sponsorship are in place. They have also demonstrated that a comprehensive process including both cost and revenues may increase the attractiveness of continued incorporation of battery storage.
1.4 Atlantic Electric Current Asset Planning Process
The Atlantic Electric distribution asset planning process is led by the Distribution Planning group. For each area of Atlantic Electric's territory, a designated distribution planner acts as both project manager and principal analyst in a collaborative effort among several groups. The planner works with others to gather required data of historical load data, irregularities in operations, concerns about local developments or customers, and any other relevant information.
Occurring every 10-15 years, these Area Studies can take anywhere from two months to over a year, depending on the complexity and needs of
the network. In some cases, there is no additional action required; areas'
electric load capacity and demand are analyzed and there is relatively stable demand with sufficient excess capacity and few operational issues. In other areas, there are aging infrastructure, concerns about future reliability, and other potential issues that the planner must address before significant problems develop and cause actual service interruption.
The planner uses capacity and load peak data from historical load data for a given electric substation or set of substations, applies forecasted demand for each asset (e.g., transformer, feeder), and determines whether there will be a need for system upgrades. He/she also evaluates any known issues or alerts that have been flagged by the engineering or operations teams, such as common outages or failures. If an upgrade or increase in capacity is needed, the planner begins in-depth analysis to explore the possible options, which may include purchasing new equipment like
transformers or other alternatives. The planner will involve all relevant
parties, coordinate analysis, present options, and recommend a course of
organization who make the final decision for capital investments or other courses of action.
Asset planning requires cross-functional collaboration among groups throughout the company. Analytics teams use industry inputs and internal
data to model forecasted load growth throughout Atlantic Electric's
territory. Regulatory teams must make sure that the proposed asset investments will be approved by regulators in order for the capital investment cost to be considered recoverable in a later rate filing. Once specifications are set, the assets must meet a standard set of requirements for integration in a substation. Substation engineers design configurations to meet the specifications. Managers must balance capital costs across the business and prioritize their investments to maintain reasonable rates for its
customers. As such, each area planning study's recommendation must be
coordinated and balanced with other recommendations from asset planning. There are a few different options for upgrades or expansions depending on need and specific conditions at the site. While conventional options are well-incorporated into the planning process, emerging technology has become increasingly attractive for utilities to invest in. When there are specific statements of interest, the planning study may request analysis from other groups at Atlantic Electric to develop a proposal incorporating other methods for demand reduction such as demand response and battery storage. However, standard processes for new technology evaluation are still at an early stage of development.
Regarding the emerging processes for non-traditional solutions, a group within the Customer department performs analysis as needed for non-wires alternatives, which has been sufficient for the use cases up until today. Non-wires alternatives include targeted demand response and energy efficiency initiatives as ways to decrease peak demand on feeders instead of or in addition to upgrades in equipment. This thesis contributes to advancing
standardized processes for regularly evaluating energy storage as an option during asset planning.
1.5 Atlantic Electric Internal Site Evaluation
Battery storage has not historically been a standard consideration in the asset planning process largely due to the high unit costs. However, there has been growing interest across the organization in battery storage, especially given the possibility of an energy storage mandate that would
follow a similar path as that of California. The September 2016 "State of
Charge: Massachusetts Energy Storage Initiative Study" released by the state
of Massachusetts recommended a "comprehensive suite of policy
recommendations to generate 600 MW of advanced energy storage in the Commonwealth by 2025, thereby capturing $800 million in system benefits to
Massachusetts ratepayers" through cost savings and improved reliability.
These findings are likely to inform and drive procurement goals for storage, following on the example of California and Oregon.
In summer 2016, managers in electric asset planning requested a short list of potential battery storage sites, partially in preparation for a regulatory environment that could favor battery storage procurement. This was tasked to field engineers, who requested specific substation level information from area engineers. Requested information included: challenges with load growth or insufficient capacity, availability of historical load data in the data system, approximate land availability, a lack of established conventional solution. The informal effort over several weeks yielded a short list of nine locations and briefing documents sharing the requested information. The information collection process consisted of emails and requests for the planning engineers to volunteer their sites for evaluation.
Going forward for similar analyses, it could be beneficial to incorporate a formalized element for each area engineer to input ratings quarterly or yearly for the requested information mentioned previously. This could be automatically collated, and at any point managers in Strategy or Asset Planning could then use the regularly-updated database to filter and define the candidate sites for storage. In a situation in which there were a regulatory mandate for installed storage capacity, the planning studies would need to mobilize resources to quickly identify which sites to filter through and continue to analyze. Potentially missing opportunities or pursuing analysis of unqualified sites would waste time and resources. Information should be recorded periodically so that a dedicated storage analyst or evaluator would be able to easily identify the data indicating site attractiveness, without requiring immediate input of operations or field staff.
Aside from the potential for standardization for the future, the criteria are aligned with other research studies of T&D capacity deferral,",1. Moreover, the informal process provided output that was a useful starting point for site-specific storage analysis. Among the nine sites, three were evaluated in this project.
1.6 Battery Storage Modeling Literature Review
Available literature did not indicate a single agreed-upon methodology for sizing a battery for asset deferral and reliability purposes. A SANDIA 2009 studyl5 1 focused on the transmission and distribution deferral benefits outlines an approach of focusing on a peak demand load profile and analyzing forecasted loads to size the required models. This was used as a basis for our initial method of sizing, which is a deterministic and conservative way to reduce the probability of a service disruption.
More broadly, for battery storage system sizing there are industry tools available such as StorageVETI'l from EPRI and GridLab-Di'1, which provide comprehensive platforms for utilities and other entities to perform
systems analyses incorporating battery storage. There are also commercial models for sale through private engagements . Atlantic Electric was interested in developing internal capabilities before contracting the work to outside providers.
There is a wide range of available academic research and publications focusing on the applications, benefits, and approaches to modeling of battery energy storage systems for power and energy applications for utilities. The modeling methods in existing research had several different types of focuses, from comprehensive full stack of battery storage benefits to specific use cases or value streams. Studies of battery storage, system effects, lifecycle, and cost when combined with high-penetration distributed solar photovoltaic systems provide interesting results for peak load shavings and frequency regulation . Simulations of battery storage system integration with wind and other renewables to compare with demand management suggest that centralized battery storage systems are more promising in reducing costs . The approaches included vary in resolution at the physical modeling level to system level optimization over time for load curves at a given location .
Other studies focus on control and management systems to optimize peak load shaving and voltage controi'l". Wholesale markets, specifically PJM, are also an area where storage enables significant benefits through energy arbitrage and energy capacity bidding.
Existing research approaches informed the initial analysis in this thesis work. There exist fewer resources focused on sizing utility-scale battery storage for reliability-only purposes, and the relative variance in potential
outputs for this analysis should be evaluated. The goal of this thesis's
approach was to compare different methodologies to investigate the advantages and disadvantages of using each in the specific use case mentioned for a selected site. Three different methodologies were developed to analyze the potential battery size for Area A substation.
1.7 Contributions and Outline
The contributions of this thesis are:
1) Development of battery storage sizing methods applied to
reliability applications in asset investment deferral evaluation
2) Quantified difference in reliability when varying battery storage
system size in a substation reliability application
3) Use of real historical data to estimate likelihood of risk for N-1
contingency coinciding with peak demand in specific site
4) Provides foundation for realistic integration of new technology
evaluation within existing businesses processes
Chapter 2 will address the current planning processes of Atlantic Electric, the case study selected for this thesis work, as well as the context for technology selection of battery storage. Chapter 3 discusses the results, advantages, and disadvantages of three battery storage sizing methods
developed and applied to the use case for Area A substation. Chapter 4
concludes with recommendations for the sizing methodology and an evaluation of the associated business processes required for the future.
2
Battery Storage Analysis
2.1
Inputs
Specific situations at Atlantic Electric have arisen in the past in which a battery storage system could have provided advantages to an isolated or
remote system. In one instance, an islanded system required substantial
additional capacity for reliability purposes. A battery storage system was
generation and as a way to defer the need for a costly new transmission cable. In this case, additional resources from engineering and the US Strategy group performed high-level analysis to put together a Request for Proposals from battery vendors.
The goal of their analysis was to provide a reasonable order-of-magnitude power and energy requirement for the battery (and approximate cost) to compare to other solutions and justify moving forward with the battery procurement process. Once in conversations with potential partners, the cost estimates were refined with more tailored specifications of a given technology and system set-up.
The inputs to the analysis were an example hourly load profile (a historical peak day was chosen), forecasted load growth over the lifetime of the battery, capacity and thresholds, alternate generation capacity, and assumptions about battery performance (e.g., charge rate, depth of discharge). The model mapped the load over the specified time period. Once the load exceeded the threshold, the alternate generation and battery began to discharge to meet the excess demand, and the model analyzed the extent to which the load was met by the battery storage. Inputs on battery energy and power could be changed to assess a suitable battery duty cycle for the given load cycle.
The results of the analysis provided the basis for a request for proposals from several battery technology vendors to further specify technical details, potential costs, and operational performance metrics for their systems. One of the primary areas for investigation in this work was the set of assumptions underlying the inputs of this existing battery storage estimation model.
2.2 Forecasting
Forecasting is currently performed taking into account several factors, including macroeconomic growth, local population growth, new large construction, and others. The Advanced Data and Analytics Group performs the macroeconomic forecasting for each region, and produces growth rates for the planning group. The planning group then takes the peak hour values of the past year for each element (e.g., transformer), applies the growth rates over multiple years, and checks whether there will be a projected demand load that will exceed emergency capacity of the system.
Analysis was performed to understand the drivers of forecasting, particularly whether there were significant drivers of peak day occurrences that may not have been considered in the current forecasting. Taking into consideration weather factors such as temperature, wind speed, local growth factors for a given site, the significant driver that emerged from a multivariate regression was temperature. Existing research shows consistent results; this can be explained in practical terms by the known electricity usage of air conditioners. Thus, it makes sense that on hotter days, during the hours that most people are home from work, there will be a heightened level of electricity usage.
The Area A substation was chosen as an example case dataset to use for analysis. The data used was the hourly electric load on two transformers that share a load, T10 and T20. Figure 3 shows that the hourly load of Area
A predictably followed this pattern. During an average day, electricity usage
increased as temperatures increased and during the afternoon and evening as people returned home from work.
4 1~ Es .2 S 0 C e
-1
*
-0g. V-I I I I 0 5 10 15 200-How of day (Jan. 2011-Aug. 2016)
Figure 3 Area A Substation Load Profile by Hour of Day
On an example peak summer day, the load followed a roughly sinusoidal curve, peaking in the afternoon when air conditioners were commonly in use.
Peak Day (8/1212016) C 0 -J E 0 0-C) (0 C3 0 5 10 Hour of day 15 20
Figure 4: August Peak Day Load Shape for 2016
To understand the drivers of load, several regressions were run among the joint T10 and T20 load versus different factors.
00 0 0 * 0 *o*0 0 0 00 00 0 0 0 00 00 00 00 0 0 0 0 0 0 0 00
First, a model was built to understand the relationship among various hourly factors (temperature, humidity, wind speed, wind direction, precipitation) and the hourly joint load from January 2011 through July
2016. Successive multi-linear regressions were performed, each time excluding non-statistically significant factors. In the end, temperature was the most statistically significant driver of the load, as we had expected. The model was generated based on temperature using a training data set of about two thirds of the data. Out of sampling testing was then performed. The out of sample test r-square value was lower than that of the model training set, indicating that the model predictive strength was low, or perhaps that the model had been over-fit. This could be developed further by other modifications, such as separating weekends or holidays to remove outlier load
profiles and focus on the 'typical' workday profile. Because our findings were
consistent with the consensus view that temperature is the most important factor driving electric load, we did not pursue further development or refinement of the model. Weather forecast methods themselves are an entire area of continuing research, so basing a battery sizing method on load forecasts also based on temperature forecasts could provide misleading results.
As an additional approach, single linear regressions were also run among the many possible driving factors and the electric load at Area A substation. For the results, see Figures 5-9.
Load vs. Temperatur
I IAM
-20
I I I I I
-10 0 10 20 30
Area A Local Temperature (C)
Figure 5: Joint Electric Load versus Average Daily Temperature
Load vs. Humidity for Temp above 15C
0o 0 0 V3 0 00 00 0 I I I 20 40 60 80 100 Htmidity (%)
Figure 6: Joint Electric Load versus Percent Daily Temperature Days
Humidity for Higher 0 I-0 041 E 0 F-C) V-C3 (D C3 W) C, C) C ) C) CN ! 3
2
0
Joint Load vs. Average Wind Speed
00 00 0 %0 00 1 0 oA> * * 00 * ,I Io I 0 OU *0*4 ** 0o~ 5 10 15 20 25
Average Wind Speed (kph)
Figure 7: Joint Electric Load versus Average Daily Wind Speed
Joint Load vs. Average Ambient Light Level
a
-0
0 0 *
00 0
20 40 00 80
Average Amibiemt LAht Level
Figure 8: Joint Electric Load versus Average Daily Light ~a. U Lfl .2 0 0
p.-A
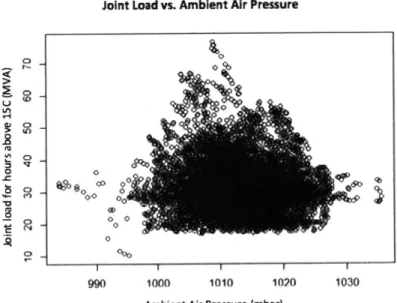
Joint Load vs. Amblent Air Pressure 0 A0b,9t Ai resr (br .00 0 990 1000 1010 1020 1030
Ambient Air Pressure (mbar)
Figure 9: Joint Electric Load versus Average Ambient Pressure Single Factor Linear Regressions with Factors Affecting Electric Load for
T1O and T20 Cumulative Load
As can be seen from Figures 5-9, there was no significant relationship between load and factors such as wind speed, pressure, light, and humidity, whereas there appears to be a clear trend in the load vs. temperature plot. Temperature was once again the most statistically significant individual factor in correlation with joint load for a single-factor linear regression.
It is notable that there is a "hockey stick" shape to the load vs. temperature data plot. This can be interpreted to show that at very low temperatures, electricity usage would increase due to fewer daylight hours
and potentially more time inside using appliances. At moderate
temperatures, people might be relatively comfortable and daylight hours would likely not be especially few. At higher temperatures, people are more likely to use their air conditioners to stay comfortable while they are at home.
This plot may be showing two distributions of data; heat-related
therefore risky situations at the Area A substation have all coincided in the summertime during hot days, we are interested in the temperatures above the inflection point of the data, which is at approximately 15C.
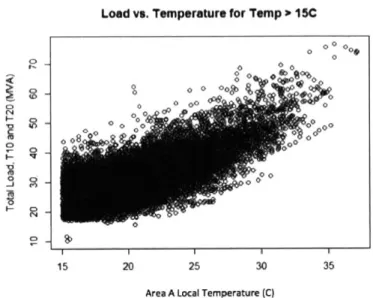
When we select for temperatures above 15C, our results are shown in Figure 10.
Load vs. Temperature for Temp 1 SC
0
00
0 0
00
15 20 25 30 35
Area A Local Temperature (C)
Figure 10: Area A Substation Temperature Above Threshold versus Load Ambient Average Temperature Above Degrees Celsius Versus T1O and T20
Cumulative Load
To disaggregate the data over time, we then plotted the data per year (see Figures 11 and 12). Interestingly, the plots from year to year did not appear significantly different, and some changes in the spread of joint load may have been due to general differences in weather. The linear relationship between joint load and temperature all remained similar over years.
0
C3
0
C
2011 Load vs. Temp above 15C
0. 0o 0 0 0 0 15 20 25 30 35S 0 000 00 0 0000 0 0 0 0 000 00000 0 O000 @0 15~ 2005 3 3 0
~
O 0 0000 15 20 25 30 3 Temperature (C) 0 10 0 C -0 E 0 0 CO, C4 r M 0 ;72012 Load vs. Temp above 15C
00 0 0 0
0 00 0
15 20 5
0 3
Temperature (C)
2014 Load vs. Temp above 15C
1 20 0 .3 0
T p0 (C) 216 Goad WD epabv 5
15 20 25 30 35
Temperature (C)
Figure 11: Temperature versus T1O and T20 Cumulative Load by Year Year temp vs. load Coefficient of Adjusted R-sq . Max Sum Load(T1O+T20)
2011 1.3635 0.5139 76.62939 2012 1.4296 0.5521 66.75748 2013 1.51329 0.5396 67.31439 2014 1.18694 0.4385 49.14844 I-J W) V
2015 1.27784 0.4633 53.02356
2016 1.41001 0.5139 64.32047
Figure 12: Linear Regression Results Comparison, Temperatures versus Cumulative Load by Year
In conclusion, the analysis on weather factors and the joint transformer load demonstrated that temperature was the primary correlated factor associated with the load magnitude. However, because weather temperature predictive models have their own high level of uncertainty, this information does not provide concrete improvement recommendations for the load forecasting at Atlantic Electric. A further investigation into this could
be an evaluation of the econometric models used to determine growth. Those models were not accessible for the purposes of this project.
2.3 Battery Storage Technology
Battery storage has applications in many industries, including technology, transportation and utilities. The feasibility of other grid-scale technologies such as flywheels, flow redox, and zinc-air, among many others is an area of research, with some experimental projects installed. While there is significant research in different types of batteries whose characteristics might be optimized for specific use cases, the prevailing technology that utilities have considered is lithium ion batteries. They offer the advantages of high energy density, high tolerance of discharge cycles, and high efficiency. Because there are commercial applications such as consumer electronics, there is more known about performance of lithium ion batteries, making the technology a more attractive initial technology to evaluate for utilities, as they consider safety in their system.
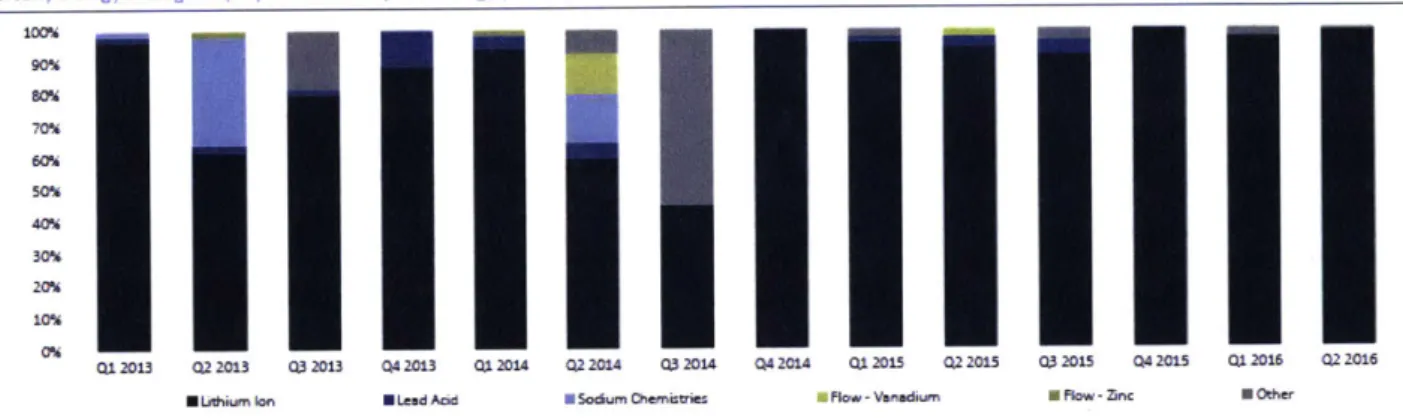
Quarterly Energy Storage Deployment Share by Technology (MW %)
I
I
70%A 60% 404A Q.2013 Q22013 0.32013 Q42013N Utiumi Ion
~
ELead AdC0120 2014 032014 Q42014 .12015 Q22015 032015 04015 012016 022016
0 Sodumn Chernaties N Fkaw - Vandium N Flow -ZicU othff
Figure 13: Quarterly Energy Storage Deployment Share by Technology
(MW%; GTM Research U.S. Energy Storage Monitor Q3 2016)
As can be seen from the GTM Storage Deployment Share analysis in Figure 13, lithium ion has been the preferred technology for the majority of energy storage deployments in the United States, and is the preferred technology for larger-scale deployments.
Other battery technologies considered include compressed air storage, pumped hydro, flywheel, lead-acid, sodium, zinc, and flow batteries.
- While compressed air storage has the advantage of being relatively
well-developed and flexible technology, it provides a low energy density and requires suitable geology. Furthermore, it is exposed to natural gas price changes.
- Similarly, pumped hydro requires suitable sites and provides low energy density.
- Flywheels could be considered, but they tend to provide relatively
low energy capacity and high heat generation despite high power density and scalability.
*
Lead-acid is a mature technology but is not well served for full depth discharge and partial charge operations; it also provides poor environment, healthy, and safety performance." Sodium ion is very high cost and high potential risk for
flammability, making it a non-option for utilities.
- Zinc batteries and other newer technologies are not fully
commercially proven, which makes these types of battery
technologies unlikely candidates for near-term utility-scale
applications.
In comparison, lithium-ion is a relatively mature technology with
multiple chemistries available and efficient power and energy density. In
addition, lack of memory effects, self-monitoring tendencies, and relative environmental safety make lithium ion batteries attractive candidates for bulk utility usage. When comparing lithium-ion to other types of batteries in terms of energy density, cycles of discharge available before degradation to
80% of capacity, and environmental considerations, ion and
lithium-polymer perform most successfully. See Figure 14 for a summary comparison with select other technologies.
TABLE 2.6: Performance of
L-lon
versus Other Technologies.
Energy density Cycles Environment Technology (WhI/) (80% DOD) Health and Safety
Lead acid 40-70 180-200 Poor
NiCd 150-200 800-1000 Poor
NiMH 150-300 500* Good
Li-ion 80-200 1200 Good
Li-polymer 200-300 1500-7000t Good
* NiMH provides no useful power after 50% DOD. t GM is testing with A123 batteries.
Figure 14: Comparison of Battery Technologies
The disadvantages of lithium ion batteries of relatively high cost appear to be lowering over time. This thesis analysis seeks to understand the methods required to size a battery, assuming that lowering unit costs may improve the feasibility["]. Thus, for this project's purposes, lithium ion batteries were used to model a more realistic use case with today's technologies.
3
Battery Storage System Sizing
3.1
Area A Substation Background
Atlantic Electric's electric service territory extends across several states. Their network moves power through high-voltage transmission lines from power generation sources through sub-stations that convert high-voltage to medium and low-voltage currents traveling through sub-transmission and
distribution lines, eventually reaching the customers at low voltages. The
extensive network carries redundancy through multiple paths from a given transmission line to an end customer, making it difficult to analyze any single substation's operations alone.
Area A substation serves over 30,000 customers who are mainly
residential, with some small commercial and industrial customers. At the
time of the research, Area A substation was already being evaluated in a routine area planning study and flagged for a potential asset upgrade requirement. A particular interesting characteristic of Area A substation is its isolation as a network element; the entirety of the area and the follow-on sub-stations and distribution lines are fed through this one station. In the case of an outage at Area A substation there would be a significant number of customers without electricity.
The first step in analysis was to understand the trends in demand and consider potential causes of a need for capacity expansion. Upon evaluation, the load profile of Area A appeared as expected, with the summer months being the highest in demand due to electric usage such as more prevalence of air conditioner usage.
Load by Month, 2011-2016
2-1Juy206
0oto
0
F- I
Forecasted demand growthrem nth cos eatryaroe-er.Hwvr
there is a concern that at present peak levels, if one of the transformers were to go out of service while there was peak electric demand, the current
capacity would be insufficient.
Area A substation converts 115 kV to lower voltage and then passes the power along to other stations. Incoming power must pass through one of four transformers: T1O and T20 are 115-34.5 kV, while Ti and T2 are 115-23 kV transformers. T1O and T20 are in parallel, sharing a total load ("sum
load") that is then distributed through lines leaving the substation. There is a switch between T10 and T20 that allows for load sharing.
In a situation in which one of the transformers were to experience an outage, the remaining transformer could compensate and serve the combined
demand, up to a rated capacity. During the summer, the relevant rated
capacity, the "summer emergency capacity", is the upper limit for the capacity available for electric load. Above this load, the transformer would be overloaded and risk overheating, which could degrade the equipment. In a situation in which both T10 and T20 were to experience an outage, the load could theoretically be switched to other transformers manually, which would
require a service visit. The associated outage duration would be directly
linked to the amount of time it took for Atlantic Electric service crews to
arrive and switch. The maximum number of hours it would take under
normal circumstances is four hours, which was used as a parameter for battery sizing and general reliability analysis in this work.
Each transformer has seasonal normal capacity ratings and emergency
capacity ratings. Normal ratings are continuous loading capability for the
transformer at different ambient temperatures, whereas the emergency
ratings are a higher threshold for higher temperatures. These ratings may
change over time with equipment degradation, and are periodically re-evaluated. For Area A, transformers T1O and T20, while being equivalent technology, have slightly different summer emergency thresholds.
More specifically, if peak electric demand coincided with an outage in one of the transformers, what would be the threshold above which either T10
or T20 would be unable to temporarily serve the peak demand? To be
conservative, the lower of these two thresholds, 49.2 MVA was used as the
threshold for analysis. If electric load were to exceed 49.2 MVA and the
transformer with higher summer emergency threshold were to experience a service interruption or go out of service, at current asset conditions, the
remaining transformer would be unable to safely meet the demand. This could result in a service disruption, which could affect all downstream stations and customers.
The above situation would be an N-1 contingency situation at peak
demand. Given N number of elements in a system, an N-1 contingency
situation occurs when one of those elements is unable to serve the network. Utilities are subject to national reliability standards. These are enforced by financial penalties based on a threshold maximum MWh of unserved load. While the goal is to reduce likelihood of service disruptions, it is impossible to guarantee zero outages or service disruptions across the entire system. The first standard of a transmission system is an N-0 scenario, in which the system is analyzed under normal operation conditions, without any equipment or component failures. N-1 would be the next scenario assessed, in which a single element would fail or provide a disruption, as explained above. While these standards are for transmission with a specific focus on security, in distribution, the utility also strives to maximize reliablity. The system Customer Average Interruption Duration Index (CAIDI), which is the the average outage duration that a given customer would experience, and the System Average Interruption Duration Index (SAIDI) are tracked commonly among electric utilities to compare relative reliability. These system-wide metrics make it difficult to analyze specific areas of the network. Thus, the
N-1 scenario in this substation provides a more realistic situation upon which
to base specific reliability analysis for the Area A Substation distribution network.
A battery storage system could be advantageous in an N-1
contingency situation, because it could provide excess capacity in the case of lost transformer capacity. It would maintain service and improve reliability of the substation in an extreme situation. Thus, adding a battery could be attractive instead of replacing the transformers with new equipment.
To perform an adequate cost comparison, the costs for a battery storage system need to be estimated by establishing the appropriate size for this use case at Substation A. As discussed previously, the method to size battery storage is not standardized in the utility industry given the multiple possible use cases.
3.2 Method 1: Plan to Peak
The first method, "Plan to Peak", uses a chosen peak demand level to
determine required capacity. In the prior battery sizing analysis for the backup islanded system, analysts had used a single capacity as the planning criteria to meet. A single load curve was plotted for the selected peak day. Plan to Peak is a similar method that selects a given day to plan for as a conservative estimate of the maximum required demand.
Using real hourly load data for the peak demand day in the prior year, the worst-case scenario would be one transformer experiencing a disruption during hour with the highest electric demand. In the specific location of Substation A, operations estimated that a maximum time of four hours would be required for repair crews to arrive and manually switch the load to other transformers after the outage occurred. Thus, if the transformer went out of service at 2 PM, in the worst case, the service could be restored through alternate channels by 6 PM. The scenario that would result in the highest lost load would be for a four-hour outage to be centered around the maximum demand hour. Graphically, this can be visualized by finding the four-hour period for which the area under the demand curve and above the capacity curve would be largest.
This situation would also necessitate the largest battery size compared to any other potential scenarios. Thus, if it is assumed that the battery could be discharged completely, the battery capacity required would be the
integral of the demand curve for the four hour period. This is the most conservative estimate, as the battery is sized for a single peak demand event that would require the most excess capacity and a full discharge.
The deterministic formulation solves for the battery energy (kWh) that yields the minimum cost of a battery system that would supplement the existing system in an N-1 contingency situation to result in zero lost load. For each hour after an outage in one transformer, the excess capacity above the summer emergency capacity threshold would be assumed to be supplemented by a battery energy storage system. The sum of these hourly required excess capacity quantitites over the four hours of outage before a service crew could arrive would be equivalent to the battery size required. In this case, we actually set the variable V of lost load to zero. Constants are assumed for unit costs of lost load ($/kWh), battery unit costs ($/kW and
$/kWh).
The formulation is as follows:
Let V = total excess capacity required above threshold of 49.2 MVA (equivalent to lost load (kWh))
Dj= electric demand for hour i
C = total current system capacity per hour
B = battery power (kW) H battery duration (h) With constants
1 = unit cost of lost load ($/kWh) a = battery power unit cost ($/kW)
b = battery energy unit cost ($/kWh)
Minimize (BH)
Where for j=24 hours of a peak day,
IV ;_ B(a + bH) such that
V=o
be 70.0 60.0 50.0 140.0 130.0 20.0 10.0Using this method, the resulting size of the battery required is approximately 48 MWh. Figure 16 is the output plot of an hourly load profile.
---saary LAd Is Load Tramne. outaq; uirod 4"r Sallry
re-ginf any behmw SE wurp as boo"na boomn suppVkmnfW1 dhag once
doe god thnwshok threshd to --- norg bamtry lowd ra
70.0 % 60.0 ---. ---.. ---.---.--- -50.0 30-0 ~~Bury SW %C 20.0 Transrmer SE threahokd
-Lead below SE lhreshoid wl beary
-Tolal load demand .
Figure 16: Method One: Plan to Peak Example Plot of Battery Discharge. (Note that the almost-instantaneous discharge of the battery is not
captured due to granularity of data.)
To compare the investment cost required for a battery storage system of this size, it is necessary to make assumptions for battery unit costs. Cost was assumed to scale linearly, although in real life it would be more accurate to model a step-wise function given required additional land space or extra cooling for large systems. When comparing the cost of a battery of this size to the capital cost of a new transformer, there was a difference of an order of magnitude, which would make it non-competitive in the evaluation process.
An advantage of this method is that it is simple to calculate and to explain. In addition, it is the most conservative approach to planning, since the output assumes maximum capacity for peak conditions at all times. For
regulatory purposes, the utility is then more secure in its ability to meet customer needs at all times.
The key disadvantage to the Plan to Peak method is that it risks over-sizing the battery storage system for the given use case, resulting in a more expensive option for the battery storage system. Another disadvantage is its use of a single peak day to plan; there is always risk for future outlier days that would yield different load curves or profiles. Even though it takes into account the forecasted growth rate applied to the peak value, the method does not take into account historical variability in demand behavior that could affect the required capacity of the subtation.
3.2.1 Battery Unit Cost Assumptions
The battery unit cost assumptions used in Method 1: Plan to Peak and Method 2: Cost Economics were based on benchmarks in industry and internal experience.
Current unit costs range depending on the vendor, application, and specific type of lithium ion technology. As of
Q3
2016, Greentech Mediaestimates the median cost for a 2-hour utility-scale lithium ion battery to be
~850/kWh and $900/kWI71. Another study by Lux estimates that installed stationary systems for residential and grid-scale use will hover around
$655/kWh and $498/kWh in 2025, respectively.
Other sources indicate Li-ion system costs currently range between
$350 and $700/kWh ($1,000 and $2,000/kW) and costs should continue to
fall on the back of growing supply from mega battery factories from the likes of Tesla, Alevo, Sharp, LG Chem and Panasonic, and promising growth in electric vehicle sales 1.
Looking to the future, there is some consensus that lithium ion battery
cost estimate study, the compound annual growth rate of capital cost of lithium ion batteries will be -12% year-over-year, meaning a 47% reduction over a 5-year period". This reduction is cost will be likely due to an increase in capacity (e.g., Gigafactory), reduction in raw materials costs, and improvement in chemistry/design. Other sources predict that costs are expected to fall 30-50% within five years. Figure 17 shows a few predicted price trend ranges from GTM Research.
Utlity-Scaie Price Trends Q3 2016 and 2018E, Energy Applications - 2 Hours ($/kWh) Utilty-Scale Price Trends Q3 2016 and 2018E, Power Applications ($fkW)
s1.200 $L2o $two.U s.w $LaLa sS5OO HC 9 S 00$4 so so
Ubiaiy (aEnfv aiman, SAwa) -0 2015 Uniib u.g Appfimba SAWOI -ZolE wpUuit mr am e, $Au)-oj 2015 Uterpnr(FOAppAin5U SAW) -2s
Figure 17: Utility-Scale Storage Price Trends
(GTM Research U.S. Energy Storage Monitor
Q3
2016)In addition to external benchmarks based on industry research, Atlantic Electric retained internal lithium ion battery unit cost estimates from past vendor proposals for battery storage system applications and requests for proposal. Compared to external benchmarks, internal cost estimates are at the low end of the range of industry cost estimates. This could be attributable to vendors attempting to compete on price, or bidding in at a lower price than average using future predicted unit costs as guidance. It could also be based on the value of additional future business, as storage becomes a more significant ongoing investment area for the utility.
To be consistent with the work being done in other groups within the
analysis. It should be noted, however, that these costs would likely be fairly
low, given the higher industry benchmark costs available. Furthermore, as mentioned, in this analysis it is assumed that battery costs would scale linearly. In reality, there might be step-wise changes in cost due to factors such as land usage and cooling systems, which would be case-specific. The same unit cost scaling assumptions are used among all three battery sizing methodologies to ensure that the outputs are comparable. The estimates were based on a $/kW cost of the inverter, transformer, and other integration, in addition to a $/kWh cost of the battery, and other materials. It should be noted that these initial capital costs do not include the operating cost that would contribute to the continuing costs of a battery storage system. These would include the cost to keep the battery charged, the charge effect on battery degradation, and the time of charge (and corresponding electricity rates). Thus, different charging strategies and optimization methods could be an area of further investigation when analyzing operating costs in the future.
3.3 Method 2: Cost Economics
The second battery sizing approach, "Cost Economics", used an
optimization that balanced estimated cost of lost load and incremental costs of battery size. If Atlantic Electric were to take a strictly cost-based view of the given investment, they would need to balance the cost of the battery to cover an N-1 contingency event during peak demand with the quantified cost of losing the ability to provide service to customers at that time. The same peak day load profile from the Plan to Peak methodology was used.
An optimization method is used that solves for the minimum total cost of the system in an event of N-1 contingency during peak demand. The total cost is defined as the sum of the cost of load lost and the capital cost of
the battery storage system. The decision variables are the battery energy (kW) and the duration of battery usage (h), which can be used to generate the battery system size (kWh). For a given peak day that we assume would occur once per year, the total excess capacity required (V) would be the sum of the difference between demand and capacity where demand is greater than capacity (from real data). We minimized the total cost, while solving for a battery size that adequately provided capacity meeting the total excess capacity required for that day.
The following formulation was used: Decision Variables:
B = battery power (kW) H = battery duration (h) Data and calculations:
Dj= electric demand for hour i
C = total current system capacity per hour
With constants
1 unit cost of lost load ($/kWh) a battery power unit cost ($/kW)
b battery energy unit cost ($/kWh)
Minimize (lV+B(a + bH))
Where
for j=24 hours of a peak day
V = [Maximumt(Di -C),0}]
BH V > 0
The resulting analysis returned a battery size of zero MWh.
This can be interpreted to mean that at the VOLL of $10,000 per MWh used in the analysis, it would be economically favorable for Atlantic Electric to allow for service disruption and subsequent lost load of four hours