Blood Clotting Inspired Polymer Physics
ARCHNES
by
Charles Edward Sing
B.S.E., Case Western Reserve University (2008)
M.S., Case Western Reserve University (2008)
MASSACHUSETTS INSTfr~fE OF TECHNOLOGY
MAY
2 0 2013
UBRARIES
Submitted to the Department of Materials Science and Engineering
and the Program in Polymer Science and Technology
in partial fulfillment of the requirements for the degree of
Doctor of Philosophy in Materials Science and Engineering
at the
MASSACHUSETTS INSTITUTE OF TECHNOLOGY
September 2012
@
Massachusetts Institute of Technology 2012. All rights reserved.
Author ...
Department of Materials Science and Engineering and the Program in
Polymer Science and Technology
July 19, 2012
C ertified by ...
...
...
Alfredo Alexander-Katz
Assistant Professor
Thesis Supervisor
Accepted by...
..
...Gerbrand Ceder
Chairman, Department Committee on Graduate Theses
Blood Clotting Inspired Polymer Physics
by
Charles Edward Sing
Submitted to the Department of Materials Science and Engineering and the Program in Polymer Science and Technology
on July 19, 2012, in partial fulfillment of the
requirements for the degree of
Doctor of Philosophy in Materials Science and Engineering
Abstract
The blood clotting process is one of the human body's masterpieces in targeted molec-ular manipulation, as it requires the activation of the clotting cascade at a specific place and a specific time. Recent research in the biological sciences have discov-ered that one of the protein molecules involved in the initial stages of the clotting response, von Willebrand Factor (vWF), exhibits counterintuitive and technologi-cally useful properties that are driven in part by the physical environment in the bloodstream at the site of a wound. In this thesis, we take inspiration from initial ob-servations of the vWF in experiments, and aim to describe the behaviors observed in this process within the context of polymer physics. By understanding these physical principles, we hope to harness nature's ability to both direct molecules in both spa-tial and conformational coordinates. This thesis is presented in three complementary sections.
After an initial introduction describing the systems of interest, we first describe the behavior of collapsed Lennard-Jones polymers in the presence of an infinite medium.
It has been shown that simple bead-spring homopolymer models describe vWF quite well in vitro. We build upon this previous work to first describe the behavior of a col-lapsed homopolymer in an elongational fluid flow. Through a nucleation-protrusion mechanism, scaling relationships can be developed to provide a clear picture of a first-order globule-stretch transition and its ramifications in dilute-solution rheology. The implications of this behavior and its relation to the current literature provides qual-itative explanations for the physiological process of vasoconstriction. In an effort to generalize these observations, we present an entire theory on the behavior of polymer globules under influence of any local fluid flow. Finally, we investigate the internal dynamics of these globules by probing their pulling response in an analogous fash-ion to force spectroscopy. We elucidate the presence of both a solid-liquid dynamic globule transition and a contour-based description of internal globule friction.
It is possible to incrementally add levels of details to these Lennard-Jones polymer models to more accurately represent biological molecules. In the second section of this thesis, we investigate the consequences of incorporating a Bell-model behavior into single homopolymer interactions to describe a "self-associating" polymer. We first demonstrate how this model is, in equilibrium, essentially the same as a
Lennard-Jones polymer, however we demonstrate that the polymer dynamics are indeed both drastically different and tunable. This has ramifications under the presence of dy-namic loads, and we investigate single-molecule response to both shear and pulling stimuli. In the former, we find novel and tunable giant non-monotonic stretching responses. In the latter, we use our observations to develop a complete and general theory of pulling these types of molecules that has ramifications in both the study of biological polymers and in the design of soft materials with tunable mechanical response.
The final section introduces concepts related to the behavior of collapsed poly-mers in fluid flows near surfaces. During the blood clotting process, vWF undergoes a counterintuitive adsorption process and here we begin to develop the physical funda-mentals required to understand this process. After a brief introduction to the relevant hydrodynamic treatment we use in simulations, we first describe the presence of a hy-drodynamic lift force and the formalism we use as we include it in the context of our theory. We reveal the presence of a non-monotonic lift force, and subsequently utilize this theoretical formalism to describe the adsorption and desorption behavior of a collapsed polymer globule near an attractive surface. We investigate the limit of large flows and highly attractive surfaces by providing a description of the confor-mational and hydrodynamic behavior of a polymer tethered at a surface. We finally discuss the behaviors of a polymer that associates with a surface, and postulate the importance of such processes in vWF function.
We finally include an addendum that describes an unrelated project that investi-gates the possibilities of using superparamagnetic beads as a tool for hydrodynamic propulsion by assembling these beads into "rotors" near a surface to create microwalk-ers that have interesting applications in self-assembled microfluidic chips.
Thesis Supervisor: Alfredo Alexander-Katz Title: Assistant Professor
Acknowledgments
While my name adorns the front page of this dissertation, it would be a mistake to not acknowledge the profound and immeasurable influence that my peers, family, and mentors have had in its creation. This is as much a product of their emotional and academic support as it is my own work, and thus I am incredible indebted to a great many people. While I cannot enumerate every influence during and preceding my graduate work, it is worth pointing out some of the most important individuals that have given me the help and support over the past few years.
First and foremost, my parents deserve the most credit for helping me to this point. Throughout my entire life, they have encouraged my curiosity in the world while still giving me the freedom to pursue my personal interests. Their ability to maintain such a balanced approach to my education is something that I am extraordinarily grateful for, and I hope this dissertation stands as a testament to their incredible patience and support.
My sister also must be acknowledged; she has been my best friend for as long as I can remember, and her emotional support and example have inspired me
through-out. She is certainly the primary driving force for my own personal and professional development.
I also owe a great deal to my advisor, Prof. Alfredo Alexander-Katz. I was initially hesitant to join a new lab to do substantially different research than what I was familiar with, but in retrospect it was one of the best decisions I have ever made. Alfredo has provided masterful guidance due to both his approachable and amicable nature as well as his incredible knowledge in the field in which we are doing research. This project has been highly rewarding, and my continued enthusiasm and progress has been due in no small part to his excellent tutelage. Alfredo is a great mentor and friend.
I am also indebted to Prof. Christoph Weder, who was my advisor at Case Western
Reserve University. It was under his guidance that I realized my immense interest in polymer science, and it was his encouragement that set me on my current trajectory.
I would, of course, like to thank my committee as well. Profs. Doyle, Van Vliet, and Rubner have provided excellent critique and guidance, and represent only a small contingent of the enormous number of academics that have helped me throughout my studies here. Among these fellow academics are my labmates, Hsieh Chen, Reid van Lehn, and TheYJ Kim. Reid in particular was our computer master for the entire time, and never hesitated to answer my inane technological questions. All of these
fellow pioneers of the Alexander-Katz group helped create an incredible environment that made my graduate life a delightful and special experience. These sentiments extend to all of my friends and colleagues, especially my roommates, Ahmed and Satoru, who have all helped me through this process in a very profound way.
Dedicated to my parents and my sister,
When you derive an equation, you own that equation.
Contents
1 Introduction 51
1.1 Blood Clotting-Inspired Polymer Physics ... 51
1.2 Blood Clotting - A Primer ... 53
1.3 von Willebrand Factor: Biological Function and Regulation ... 55
1.4 von Willebrand Factor Structure ... 57
2 Part I Introduction 69 2.1 Coil-Stretch Transitions in Homopolymers . . . . 70
2.1.1 Diffusion Sans Flow and Hydrodynamics ... 70
2.1.2 The Importance of Hydrodynamics ... 71
2.1.3 DeGennes-Peterlin Theory of Coil-Stretch Transitions . . . . . 73
2.2 Experimental Observation of Single Chains in Flow . . . . 75
2.3 Globules in Fluid Flow . . . . 77
2.4 vWF in Fluid Flow - Experiment and Theory . . . . 79
2.5 Mapping vWF from Biological Structure to Physical Model ... 81
2.5.1 The Ergodic Hypothesis ... 84
2.6 Simulation Methods ... 85
3 Dynamics of Collapsed Polymers in Elongational Flows 93 3.1 Introduction ... . 93
3.2 Results and discussion . . . . 96
3.2.1 Elongation Flow-Induced Unfolding . . . . 96
3.2.2 Intrusion Fluctuation Theory for FD Case . . . . 97
3.2.3 Protrusion Nucleation Theory for HI Case ... 101
3.2.4 Dynamics of Unfolding Collapsed Polymers ... 107
3.2.5 Elongational Viscosity ... 112
3.3 Conclusions ... . 114
4 Elongational Flow Induces the Unfolding of von Willebrand Factor at Physiological Flow Rates 121 4.1 Introduction ... 121
4.2 Results and Discussion ... 122
4.2.1 Physiological Elongational Flows ... 122
4.2.2 Coarse-Graining vWF ... 123
4.3 Conclusion . . . 126
5 Dynamics of Collapsed Polymers Under the Simultaneous Influence of Elongational and Shear Flows 131 5.1 Introduction ... 131
5.2 Theory of Globule-Stretch Transitions ... 132
5.2.1 Globule Stretch Transition: Nucleation-protrusion Mechanism 132 5.2.2 Tumbling to Non-tumbling transition ... 138
5.3 Results and Discussion ... 141
5.3.1
E
0 =o
... ... ... ... 1425.3.2 00 = ir/2 ... 151
5.3.3 00 = 7r/4 ... 153
5.3.4 Relaxation transition ... 156
5.3.5 Extension to 3-dimensions . . . . 156
5.3.6 Understanding collapsed globules in rheological flows . . . . 158
5.4 Conclusion ... 159
5.5 Appendix ... 160
6 Conformational dynamics and internal friction in homo-polymer glob-ules: equilibrium vs. non-equilibrium simulations 165 6.1 Introduction ... 165
6.2 Diffusivity of a globule along a periodic chain: equilibrium simulations 167 6.2.1 Model ... 168
6.2.2 Results ... . 172
6.3 Forced unfolding of globules: non-equilibrium simulations ... 179
6.3.1 Model ... 179
6.3.2 Liquid-solid transition for large cohesive strengths ... 181
6.3.3 Internal friction ... 184
6.3.4 Summary for pulling on homopolymer globules ... 193
6.4 Conclusions ... . 194
7 Probing Structural and Dynamical Transitions in Polymer Globules by Force 201 7.1 Introduction ... 201
7.2 Results and Discussion ... 203
7.2.1 Simulation Protocol ... 203
7.2.2 Neighbor Rearrangement Correlation Functions ... 203
7.2.3 Globule Structural Transition ... 205
7.2.4 Globule Dynamical Transition ... 206
7.3 Conclusions ... . 209
8 Part II Introduction 215 8.1 Revisiting the Ergodic Hypothesis ... 215
8.2 Bell-Model Interactions ... 216
9 Equilibrium Structure and Dynamics of Self-Associating Single
Poly-mers
9.1 Introduction ... ... ... ... 9.2 Results and Discussion ...
9.2.1 Equilibrium Structure 9.2.2 Relaxation Dynamics 9.3 Conclusions ... 223 223 225 225 235 242
10 Giant non-monotonic stretching response of a self-associating
poly-mer in shear flow
10.1 10.2 10.3 10.4 10.5 10.6 Introduction ...
The Constrained "Stuck" Globule ...
Theory of Associating Polymers in Shear Flow . Simulation Results . . . . The Spectral Properties of Associating Polymers
Conclusion . . . .
11 Force Spectroscopy of Self-Associating Homopolymers
11.1 Introduction ...
11.2 Theory . . . . 11.2.1 Shortest-Chain Kinetic Equation . . . . 11.2.2 Chain Extension . . . .
11.2.3 Chain Shortening . . . .
11.2.4 General Kinetic Theory and Equilibrium Chain
11.3 Specific Topologies . . . . 11.3.1 Random Self-Associating Homopolymer . . . . . 11.3.2 Helical Self-Associating Polymer ...
11.4 Results and Discussion ...
11.4.1 Random Self-Associating Coil ...
11.4.2 Self-Associating Helices . . . .
11.5 Conclusions . . . .
Distribution
11.6 A Note on the "Omega" Term for Randomly Associating Polymers.
12 Self-Associating Polymers in Elongational Flow
12.1 Introduction ... ...
12.2 Simulation and Methods ...
12.3 Theory of Self-Associating Polymers in Elongational Flow . . . .
12.4 Results and Discussion . . . .
12.5 Conclusion . . . . 249 249 250 251 253 256 258 265 265 267 267 270 271 272 274 274 278 281 282 290 293 296 303 303 304 304 310 315
13 Designed Molecular Mechanics Using Self-associating Polymer
Com-ponents 317
13.1 Introduction ... 317 13.2 Results and Discussion ... 319 13.3 Phenomenological Mechanical Design Principles ... 324
. . . .
. . . .
. . . .
13.4 Conclusion . . . .
14 Part III Introduction
14.1 Near-Surface Hydrodynamics . . . .
14.2 Hydrodynamic Lift Force . . . .
14.3 Simulation Methods . . . . . . . . 327 333 334 336 338 15 Non-monotonic hydrodynamic lift force on highly extended poly-mers near surfaces Introduction ... Simulation Methods . . Theory ... Relation to Microscopic Results and Discussion Conclusions ... Theory ... 16 Theory of Tethered Polymers in Shear Limit Flow: The Strong Stretching 16.1 Introduction ... 16.2 Simulation Methods ... 16.3 Theory of Strongly-Stretched Chains ... 16.3.1 FJC, no HI ... 16.3.2 Influence of Semi-Flexibility ... 16.3.3 Effect of HI ... 16.4 Discussions ... 16.5 Conclusions ... 17 Adsorption and desorption transitions for collapsed presence of shear flows 17.1 Introduction ... 17.2 Simulation Methods ... 17.3 Theory and Results ... 17.3.1 Surface-Induced Globule-Coil Transition . . . 17.3.2 Globule-Stretch Transition: Effect of Surface . 357 357 359 360 360 364 365 366 374 polymers in the 381 . ... 381 . ... 383 . ... 385 . ... 385 . ... 390
17.3.3 Potential of Mean Force: Adsorption Energy Landscape
17.3.4 Map of Adsorption-Desorption Behavior in Shear . ...
17.3.5 Adsorption/Desorption Dynamics ... 17.4 Conclusion ... 393 408 412 416
18 Surface Mobilities of Polymers on Associating Surfaces in Shear
Flow 4
18.1 Introduction ... 18.2 Theory ...
18.2.1 Transition probabilities for sausage-shaped globules . . . . 18.2.2 Rebinding transitions . . . . 23 423 425 126 128 15.1 15.2 15.3 15.4 15.5 15.6 343 343 344 345 348 350 354
18.2.3 Final Evolution Equation ... 431
18.2.4 Binder coupling for globule-stretch transitions near surfaces . . 432
18.3 Results and Discussion . . . . 434
18.3.1 Discussion of the Role of Hydrodynamic Interactions . . . . 442
18.4 Conclusion . . . . 442
19 Blood Clotting-Inspired Polymer Physics - A Perspective 447 19.1 Conclusion . . . . 447
19.2 vWF Response and Adsorption: A Hypothesis . . . . 449
19.3 Future W ork . . . . 455
20 Self-assembled Colloidal Walkers: From Single Chain Motion to Controlled Surface-Induced Flows (An Addendum) 465 20.1 Introduction ... 465
20.2 Results and Discussion ... 467
20.2.1 Single surface walker: assembly and dynamics ... 467
20.2.2 Characterization of rotor velocity and fragmentation ... .469
20.2.3 Controlled surface-induced flows and transport using ensembles of rotors... 471
20.3 Appendix . . . . 477
20.3.1 Experimental Setup . . . . 477
20.3.2 M aterials . . . . 478
20.3.3 Computer Simulations . . . . 479
20.3.4 Walking Velocity of a Single Rotor . . . . 481
20.3.5 Scaling relationship for chain fragmentation . . . . 485
List of Figures
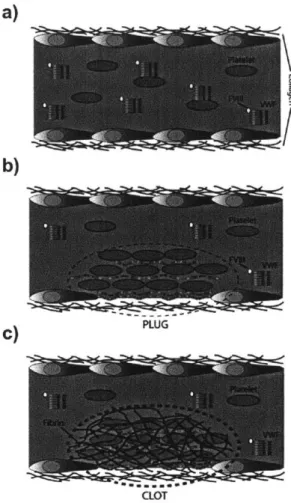
1-1 A schematic demonstrating the role of vWF in the blood stream. a)
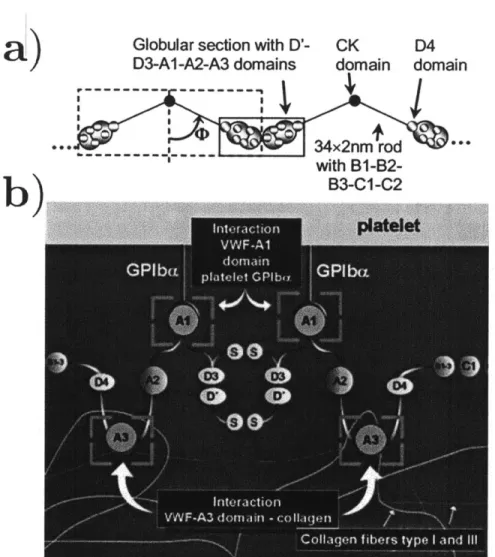
Under quiescent conditions, vWF exists in a globule state that interacts very little with its surroundings. Some vWF is freely mobile in the bloodstream, while the rest is bound in either the Weibel-Palade bodies located within the vessel endothelial wall or in platelet a-granules. b) When the vessel is damaged, the resulting change in flow conditions induce an accumulation of vWF and platelets (known as a "plug") that adheres to the exposed collagen at the wound site. During this process, vWF undergoes a conformational transition from a globule to a stretched protein, which enables it to act as the "glue" that holds the plug together. c) Fibrinogen is deposited at the site of the plug, and subsequently converted into fibrin and crosslinked to form the permanent clot. Figure courtesy of Alfredo Alexander-Katz. . . . . . 54 1-2 a) The spatial structure of two end-to-end vWF "dimers." Most of the
binding domains (Al through A3) are located in globular units, while the other structural units form a "rod" structure. Figure taken from Singh, et al. [431 b) The domain structure of a single vWF "dimer",
with the various subunits labelled and binding behaviors indicated. Non-indicated binding behaviors include the interaction between A2 and ADAMTS13,[29, 30, 31, 32, 33, 34] and the interaction between
C1 and integrins.[37] Figure taken from the review by Reininger.[20] 59
2-1 (a) Polymers in shear flow undergo a characteristic tumbling behav-ior due to an instability along the horizontal axis where the extended polymer will reach, through fluctuation, a point at which the molecule is driven back into a coil. The molecule will thus undergo an oscillation between stretched and unstretched states. (b) This tumbling process is observed experimentally upon fluorescently labeling DNA. Scale bar is 5 pm and the snapshots occur over 6s. (c) The graph of the PSD as a function of frequency does not show any apparent peaks for any shear rate (given here by the dimensionless Weissenberg number, Wi). Other graphing methods show a peak, however such features remain broad and ill-defined. Figures from [10]. . . . . 77
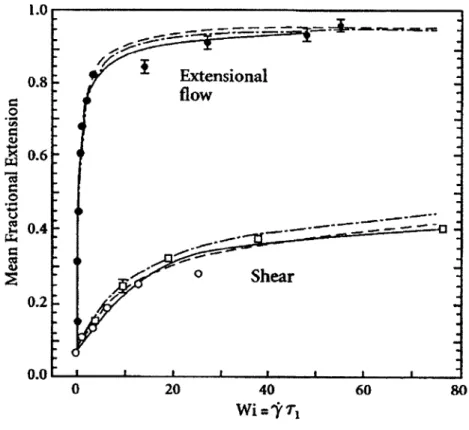
2-2 Single molecule extensional response to shear and elongational flows, with excellent agreement observed between simulation (dashed, dotted lines) and experiment (points). Simulations are run both with and without hydrodynamic interactions, however on a non-log scale with small chain lengths the difference is not drastic. Figure from [4, 13]. . 78 2-3 (a) Atomic Force Microscopy (AFM) image of vWF in both its
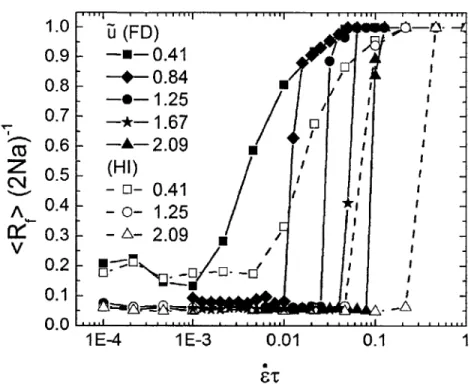
quies-cent conformation (far left) and its shear-stretched extended conforma-tion (right). Extension by AFM is also possible (center). Figure from [34]. (b) The experimental stretching and adsorption behavior of vWF under the influence of shear flows. As shear flow is increased, there is a critical shear rate above which both extension and adsorption occurs. This behavior is reproducible in simulation, shown as as open squares in the inset. This matches qualitatively and quantitatively with exper-imental data, and compares favorably with similar simulations where the polymer is no longer collapsed, shown as open circles in the inset.
Figure from [1]. . . . . 80
2-4 Schematic demonstrating the relative orientation of the flow profiles. Both an elongational flow field (black streamlines) and a shear flow (red streamlines) can be superimposed. We characterize the relative orientation of the two by rotating the elongational flow field by an
angle 6 0. . . . . 87
3-1 The average end-to-end distance ((RF)) of a polymer as a function of the elongation rate
er
and interaction energy ii between segments, taken from Brownian dynamics simulations of 50-bead chains. Both freely-draining (solid lines, closed symbols) and hydrodynamic interac-tion cases (dotted lines, open symbols) are considered. . . . . 97 3-2 Schematics representing the geometries considered for the variousmech-anisms proposed in this article. (a) represents the FD case at low values of A. The dashed boundary to the globule, as well as the large blue flow arrows, indicate that we are considering the FD condition. Each hemisphere (separated by the dotted block line, radius R) feels an op-posing drag force Ff-ic, which is counteracted by the force Fcoh due to the surface tension (represented by the red arrows). (b) represents the FD case at high values of Af. The globule now divides into two non-equivalent lobes, at a plane that is a height h < R from the top of
3-3 The scaling behavior of the critical elongation rate *,r versus the inter-action energy Aii taken from Brownian dynamics simulations for chains of varying length using the FD assumption. Two scaling regimes are seen, with i* ~ Af6 at low interaction energies and e* ~ Asil.7 5 at high interaction energies. Results are shown for N = 50 (black squares),
N = 100 (red circles), and N = 200 (blue triangles). The dashed pur-ple lines represent the best fit lines through the data, while the solid black lines demonstrate the slope predicted by the scaling argument. The slopes for the best fit lines are in excellent agreement with the theoretical prediction. . . . . 102
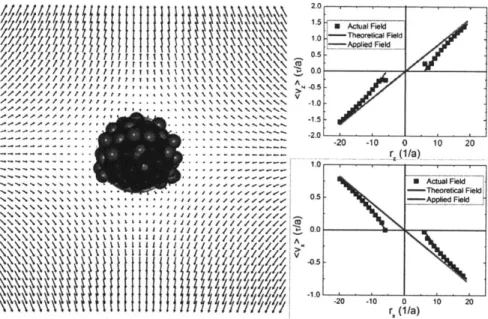
3-4 The average flow profile surrounding a collapsed polymer globule (Aii =
3.0) in a sub-e* elongation rate of 0.082 1/-r. The graphs on the right quantitatively compare the actual flow profile obtained from the simu-lations and the theoretical flow profile from equation 3.10 to the applied elongational flow profile. The fit of the theoretical flow profile to the simulation data yields the effective hydrodynamic radius of the glob-ule, which is indicated in the figure on the left as a translucent blue sphere. Note that the radius of the effect of hydrodynamic stagnation represented by this sphere is smaller than the radius of the actual glob-ule, which supports our assumption of a region of flow penetration into
the globule. . . . . 104
3-5 The scaling behavior of the critical elongation rate i*T versus the in-teraction energy A6 taken from Brownian dynamics simulations for chains of varying length considering HI. A gradual transition between two scaling regimes is seen, with
e*
~ A61 at low interaction ener-gies and 2* ~ A2 at high interaction enerener-gies. Results are shown forN = 50 (black squares), N = 100 (red circles), and N = 200 (blue trian-gles). The dashed purple lines represent the best fit lines through the data, while the solid black lines demonstrate the slope predicted by the scaling argument. The slopes for the best fit lines are in excellent agreement with the theoretical prediction. . . . . 105 3-6 The end-to-end distance RF of a polymer measured as a function of
time for a 100 bead chain in FD conditions (at low interaction en-ergies, Aii = 0.26). They are raised from below 2* to just above e*
(& = 0.02) at time t = 0. We note the presence of two distinct
confor-mation types, and include snapshots of each from simulation data: the left shows the dumbell configuration, and the right shows the kinked conformation. The latter demonstrates a "hesitation" in the unfold-ing dynamics, which is indicated in the red circle. The dumbell case does not demonstrate this feature. Black dotted lines outline the basic geometries present in the simulation figures . . . . 108
3-7 The end-to-end distance RF of a polymer measured as a function of
time for 100 bead chains considering FD at high interaction strengths
As = 3.0. They are raised from below
e*
to just abovee*
(er = 0.158)at time t = 0. Snapshots from simulations are shown to demonstrate
the typical conformations seen during unfolding. A capillary instability forms close enough to the center of the globule that the smaller lobe is able to be pulled apart from the larger one, resulting in the dumbell geometry outlined by the black dotted lines. . . . 110
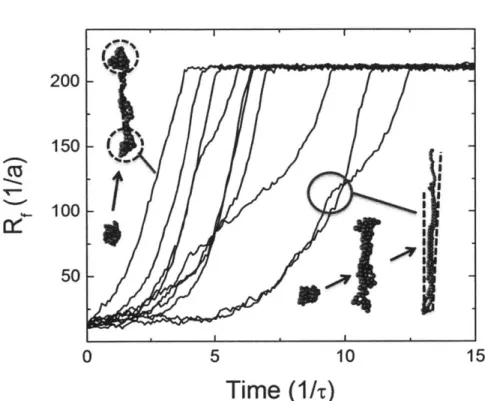
3-8 The end-to-end distance RF of a polymer measured as a function of
time for 100 bead chains considering HI. The flow rate
e
is raised frombelow
e*
to just abovee*
(er = 0.11, Afi = 0.67) at time t = 0. Snapshotsfrom simulations are shown to demonstrate the typical conformations seen during unfolding. A thermal protrusion extends far enough away from the globule to be pulled by the surrounding flow field, resulting in a half-dumbell geometry outlined by the black dotted lines. . . . 111
3-9 (a) i in the FD case as a function of
er.
(b) i in the HI case as afunction of &r. For both (a) and (b), different colors represent different interaction energies ii while different symbols represent different chain lengths. Both (a) and (b) also plot both FD and HI cases respectively for the theta condition (is = 0.41) to contrast the discrete viscosity jump of the globule-stretch transition to the continuous coil-stretch transition (grey dotted lines). (c) Plot of i as a function of N for both FD (black symbols) and HI (red symbols) cases. Square symbols represent the average (over all simulations) value of
i
below e*, and the circle symbols represent the average (over all simulations) value ofi
abovee*.
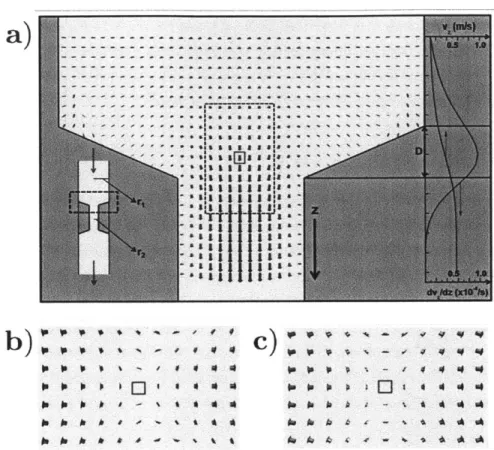
. . . 1154-1 a) A typical flow profile for the case of a thrombus or vasoconstriction (an approximate schematic is shown at bottom right). The entry to such a blockage results in an elongational flow. On the far right, there is a graph of both the fluid velocity and the velocity gradient (which corresponds to the magnitude of the elongational flow rate) along the center of the flow. The maximum elongational flow rate clearly occurs in the center of the radius change (the area bounded by D) and tends towards zero in the regimes where the vessel radius remains constant. The bottom left shows the effect of placing a protein (the red globule) in this sort of flow: in the transition region D the protein gets elon-gated by the flow field. b) The area contained in the black dotted box shown above in (a) with the reference velocity subtracted from every vector. c) A pure elongational flow using similar values (as described in equation 1). We note that both (b) and (c) are almost identical, corroborating the assertion that a change in vessel radius produces a local elongational flow. . . . . 124
4-2 a) The elongational flow (profile shown) imposed on a collapsed vWF molecule has the ability to stretch the protein. This opens up the quaternary structure to allow for bonding with other molecules. The snapshots shown represent the unfolding over time seen in simulations of vWF in elongational flow. b) The average percent extension of vWF as a function of the elongation/shear rate
/y
for simulations using two different interaction energies Au and a dimer size of ca. 50 nm (see text for discussion). The average force per monomer F mapped as a function of elongation versus shear rates ( u = 1.5kT). This forcequickly increases into the biologically relevant regime as elongational flow is applied, while application of shear flow demonstrates a much more broad transition. . . . . 125 5-1 Schematic demonstrating the nucleation-protrusion stretching
mecha-nism. There is a harmonic increase in energy upon stretching a protru-sion of length
I
from the surface of a globule. There is increasing drag force on a protrusion as the 1 increases due to the increase in fluid flow away from the globule. Once the protrusion is above a critical length, this drag force overcomes the cohesive force and stretching occurs. The green diagrams demonstrate the polymer conformation at that given point along l. . . . . 1345-2 A schematic of the variables defined in the derivation of the conditions
for the tumbling to non-tumbling transition. A chain of N beads with a radius that is elongated will equilibrate at an angle 00 that is defined
as the angle where the angular component of the velocity field vo = 0.
There is also some angle E, where the radial component of the velocity field v, = 0. These are separated by an angle
A8.
If AE is small such that thermal fluctuations can cause the chain to cross into the regime where v,. < 0, then tumbling behavior will occur. . . . . 139 5-3 The tensile-force contour plots within e-i space for 60 = 0. The darkline corresponds to equation 5.47. There is good agreement between these values and the apparent globule-stretch transitions. Dotted lines correspond to the relaxation transition, which at high values of - is
due to tumbling behavior and at low values of ' is due to entropic
relaxation. The tumbling behavior follows the scaling derived in equa-tion 5.49, while the black dots represent simulaequa-tion data. See Figure 5-5 for more data on these transitions. N = 50 and Af6 = 1.5. . . . . 143
5-4 The critical elongational rate i*r (solid symbols) and critical shear rate
7*r (open symbols) as a function of the interaction energy A. We plot the results given in the literature for both i*r and
-*r
using the same simulation methods used in this paper (red symbols). [13, 16] We include in this plot the critical flow rates for mixed flows in the limit of zero shear flow (solid, black symbols) and zero elongational flow (open, black symbols) determined in the simulations for this paper. As expected, these results correspond directly to the data presented in the existing literature, and also follow the scaling behavior derived in each case (A6 m*r for both elongation and shear flows in the high-Au regime, and A6 ~*r in the low-A6 regime). [13, 16] . . . . . 1455-5 (a) The tumbling-extension transition as a function of the (N =
50)-normalized elongation rate irN/50 versus the shear rate i for 60 = 0.
The fit line represents the predicted scaling of '* ~ j*3/2 from equa-tion 5.49, and the simulaequa-tion data closely follows this trend regardless of the interaction energy A6. The normalization of N/50 is also pre-dicted by equation 5.49. Solid symbols denote values that are above
A* and
e*,
and represent a reversible transition. The open symbols denote values that are below '* and e*. (b) The relaxation transitionfor 6 0 = w/6 and w/3 mapped on a
e-
plot for N = 50. Therelax-ation at low values of - are governed by the entropic relaxrelax-ation time,
i,7 ~ 0.045, which is governed by the equation 5.78. At high values of
-,
the relaxation is governed by the tumbling-extension transition. The fit line for this section represents the scaling predicted by equation 5.95which
is ~ *2. . . . . .150
5-6 The tensile-force contour plots within
e--
space for 60 = r/2 (a), r/4(b), ir/6 (c), and v/3 (d). Dark lines correspond to equations 5.64, 5.76, and 5.100 for their respective values of 60. There is good agreement
between these values and the apparent globule-stretch transitions. Dot-ted lines correspond to the relaxation transitions, which at high values of ' are due to tumbling behavior and at low values of y are due to
entropic relaxation. The fit lines represent the scaling seen in equa-tions 5.67, 5.77, 5.86, and 5.95, while the black dots represent simula-tion data. See Figure 5-5 for more data on these transisimula-tions. All plots are for N = 50 and As = 1.5. . . . . 154
5-7 The hysteresis present in the stretching and collapsing behavior of a
polymer chain with high Afi(= 1.5) self-interactions (red). Filled sym-bols represent increasing
eT
and open symbols represent decreasinger.
This is compared to the behavior of a chain extending at e-conditions6-1 The diffusion of a globule relative to the stretched polymer linker is simulated. The globule mobility, the number of monomers NG inside the globule, the diameter of the globule 1G, and the fluctuations of the linkers (i.e. the stretched part of the chain that is not part of the globule) depend on the cohesive strength u, eq. 6.7. Snapshots at different times for ii = 0.8 (left) and 2.09 (right) are shown. To
prevent motion of the linker chain section and thereby obtain directly the globule diffusivity relative to the chain, the monomer it, in the middle of the linker chain (indicated by the arrow) is trapped by a harmonic potential, eq. 6.8. Periodic boundary conditions for a box of length L using the minimum image convention are employed to model an infinite polymer. The color coding indicates the running monomer index along the chain. . . . . 169 6-2 The density profile of the globule depends on the cohesive strength fi.
The globule is defined as the region where the monomer density is p > 5/a (indicated by the horizontal line). . . . . 171
6-3 6-3a The number of monomers NG inside the globule increases weakly with the interaction strength u until it finally levels off. The limiting values N are depicted by horizontal broken lines and are determined
by eq. 6.9, describing a spherical globule and tightly stretched
link-ers. Error bars denote the standard deviations of the distributions.
6-3b Probability distribution of the number of monomers NG inside
the globule for chain length N = 200 and different cohesive strengths
ii = 0.8, 1, 1.5, 2.81. For small u considerable size fluctuations are
ob-served, which decrease upon increasing u. Further, increasing u raises the mean NG up to the limiting value N& given by eq. 6.9 (broken vertical line). . . . . 173
6-4 Trajectories of the x-coordinate of the center of the globule, r.G) defined in eq. 6.11, for N = 200 and various interaction strengths
i = 17 1.25, 2.5, 2.81. The smaller the attractive interaction between
the monomers, the more mobile the globule is. If u is large, the globule is frozen in a single conformation and does not move at all. . . . . 174
6-5 The mean squared displacement (MSD) of the center of the globule for
N = 200 and ft = 1, 1.75, 2.5, 2.81 is calculated from the trajectories, fig. 6-4, using eq. 6.12. Symbols denote the measured MSD from our
simulations, lines the corresponding linear fits for MSD(t) > 10. For
ii < is with as ~ 2.3 for N = 200, the globule exhibits normal diffusion
and the diffusivity DG decreases as u increases. For ii = 2.5, normal
diffusive behavior is obtained, whereas for ft = 2.81 the diffusion time
scale is of the order of the simulation time and normal diffusive behavior is barely reached. . . . . 175
6-6 6-6a Diffusion constant DG of the globule (open symbols) as obtained
from linear fits to the MSD curves, fig. 6-5. DG decreases with increas-ing N and u. At u = us, with us depending on N, a transition of the
internal dynamics occurs and the diffusion constant drops to zero. DG is compared to the ideal Rouse diffusion constant Do (solid symbols) of a globule with NG monomers, eqs. 6.13 and 6.14, which can move freely and independent of the linkers. (b) Rescaling the actual diffu-sion constant by the ideal diffudiffu-sion constant, Dc/Do, removes the N dependence to a large extent in the liquid regime. . . . . 177
6-7 Illustration of the concept and calculation of the reduced number of
monomers NG in the globule. For a displacement of the globule by a distance x only a reduced number of monomers have to move along, here NG = 14 (shown in orange). In order to obtain N , the linker is continued through the globule and the monomers belonging to this internal linker are subtracted from NG yielding N, see eq. 6.14. . . . 178
6-8 Illustration of the two different pulling protocols. Rx denotes the
po-sitions of the two traps that positionally constrain the chain ends. 6-8a Preparation of the annealed structures. After a long equilibrium run with
ii
= 0.8 and R, = 0.1 (broken line), the globule is equilibrated atthe cohesive strength at which the pulling curve is recorded (horizontal solid line). The subsequent pulling cycle is depicted by the thick gray line. 6-8b Preparation of the un-annealed structures. The traps are moved from complete extension, Rx = a(N -1), to R2 = 0.03aN, which ensures that one single globule forms. Without pausing, the pulling cycle starts and force extension curves are recorded and analyzed in the interval 0.1 < R2/(aN) < 1 (thick gray line). . . . . 180
6-9 Typical initial configurations in the annealed (top) and un-annealed
simulations (bottom) for ii = 2.91 and , = 0.001. For the large
u
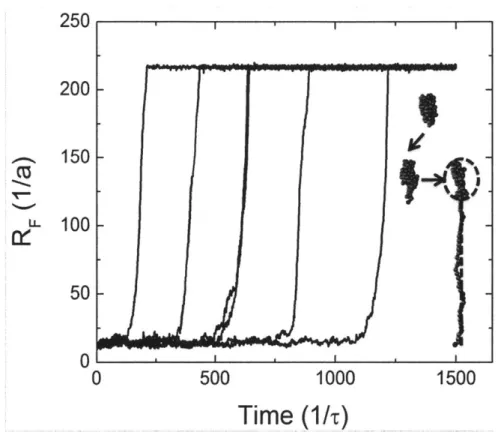
shown here, the collapsed un-annealed structures show some residual ordering. The color coding indicates the monomer index along the chain contour. 1806-10 Force extension curves for constant velocity ii = 0.001, various cohesive
strengths and N = 300 using annealed initial configurations. All curves
are averages over twenty pulling cycles. Above the globule transition,
ii >
u.
N 0.5, a force plateau followed by a dip in the force extensioncurve is observed. The broken line depicts the theoretically expected force extension trace of an extensible freely jointed chain for ii = 0,
eq. 6.17. For ii = 2.5 the pulling curve exhibits a marked maximum at
6-11 Pulling curves for N = 300 and f) = 0.001 with (a-c) un-annealed and (d-f) annealed structures as initial configurations. The thin lines are
individual force extension traces, whereas the thick black line is the average over twenty pulling curves. The un-annealed structures exhibit rather smooth pulling curves and no drastic differences between the various cohesive strengths u is observed. In contrast, the annealed structures feature marked fluctuations above a certain threshold ii ; 2.1 for N = 300, which diminish for large extension, i.e. when the
globule sizes decrease. We attribute these fluctuations to a liquid-solid transition, which dramatically changes the internal dynamics (see text). . . . . 184
6-12 Averaged force extension curves in the vicinity of the liquid-solid
tran-sition are shown as a function of the number of monomers inside the
globule, NG, eq. 6.9, for the annealed set of initial configurations. Once
NG is below a certain threshold (; 100 for f6 = 2.91, ~ 140 for ii = 2.5)
the globule is driven into the liquid state, and force curves for different
N and equal ii collapse. The dependence of the liquid-solid transition
on NG is discussed in detail in ref. [42]. . . . . 185
6-13 Averaged pulling curves for various pulling velocities with N = 300, i! =
2.08, and annealed initial configurations. The friction force increases
with increasing pulling velocity. The curves with the slowest pulling velocities
f)
= 0.001, 0.0045 almost coincide, indicating that with theseslow velocities one has approximately reached the equilibrium pulling limit. The dotted curve is one individual pulling curve for ij = 0.045. The inset illustrates the definition of the dissipated work, eq. 6.18, which is the shaded area between the two curves. . . . . 186
6-14 Dissipated work per monomer AW/N as a function of the pulling ve-locity v for N = 300 and different cohesive strengths u starting from
the (a) annealed and the (b) un-annealed set of initial configurations. Symbols depict simulation data, lines show linear fits to the data ac-cording to eq. 6.24. Below the globule transition, ii < I ;u 0.5, the curves collapse, i.e. interaction contributions to friction are negligible. Below the liquid-solid transition, ii < us a 2.1 for N = 300, the data
is linear in v in the whole range of velocities studied, indicating that friction is of viscous nature. Above the liquid-solid transition the linear scaling breaks down. AW is slightly lower for the simulations start-ing from the un-annealed set of initial configurations showstart-ing that the globule is not completely equilibrated and still rather ordered. . . . . 188
6-15 Dissipated work per monomer rescaled by the pulling velocity, AW/(Nv),
as a function of the pulling velocity v for N = 300 and different cohesive
strengths u starting from the 6-15a annealed and the 6-15b un-annealed set of initial configurations. Symbols denote simulation results, lines depict l' as obtained from linear fits according to eq. 6.24 in fig. 6-14. For u < us, our simulations are carried out in the linear viscous regime
and there is no v dependence after rescaling. Above the liquid-solid transition the linear scaling in v breaks down. For ii = 0 and 2.08, error
bars indicate the standard deviations of the twenty measurements of
A W (v,u). . . . 189
6-16 The standard deviation per monomer aAwIN of the dissipated work,
as obtained from twenty pulling cycles. For u < us, oAwIN is
in-dependent of the chain length N and small. The fluctuations of the dissipated work increase significantly when u > us, where us decreases
for increasing N, see Table 6.1. The data is obtained from simulations with i = 0.001 and annealed initial configurations. . . . . 189 6-17 Rescaled dissipated work per monomer AW/(N 2v) as a function of
the pulling velocity v for different N and cohesive strengths u starting from the annealed set of initial configurations. Curves with equal u and different N collapse for u < us. This shows that the dissipated work per monomer is an extensive function and AW ~ N2
v. Again,
this scaling behavior breaks down above the liquid-solid transition. . . 191 6-18 Rescaled internal viscosity qG(u)/G(0), eq. 6.25, as a function of the
cohesive strength u for 6-18a, 6-18c annealed 6-18b, 6-18d un-annealed initial configurations. The viscosity G(U) is obtained from linear fits to the dissipated work as a function of the velocity v. As the data points for different N coincide, all f(u, N) exhibit the same N dependence. The solid line is the prediction of the excess viscosity of a Brownian particle in a sinusoidal potential, see eq. eq.refeq:28. In 6-18a, 6-18c the viscosity ratio as obtained from our equilibrium simulations, see fig.
6-6b, 7(u)/IG(0) = DoIDG(U) is shown in addition. . . . . 193
7-1 Plots of time correlation functions F(t) (a) and G(i) (b) for a variety of N values at F = 2.08 are shown. There is a distinct change in the
correlation dynamics as N is increased above N = 250. Both graphs are
fit to double-exponential fits, and the fit parameters for (a) are shown in (c). This plot demonstrates that there is a substantial change in Ai values at N* ~ 250, which is due to the the appearance of prominent relaxation modes that operate on time scales well beyond accessible simulation tim es. . . . . 204
7-2 Plot of the i dependence of F(500r) for a variety of N values. The value of F(500r) approximates AO, and displays the same drastic in-crease in value at a critical value of F*. We indicate the location of E* for each N with arrows corresponding to the point F(500r) : 5. F* is clearly a function of N, and the inset maps the transition on the E - N
plane. Gratifyingly, the resulting globule solid-liquid transition curve corresponds well to the scaling introduced by Rampf shown in equation
1. [7] Red traces represent the trajectory of the globule as it shrinks
due to the pulling that is demonstrated in Figure 7-4. The red "x"s represent the apparent solid-liquid transition seen in these simulations, which directly corresponds to the transition seen in quiescent globules. 205
7-3 Pair correlation function g(r) as a function of N near the solid-liquid transition. There is a clear change from solid-like to liquid-like cor-relations around N* ~ 260. Traces are offset by a constant value of
0.015. . . . . 206
7-4 (Color online) (Top panel) Force
f
versus extensionL
plots for anannealed globule of N = 300, with F = 2.08,2.50,2.91 (solid, dashed,
dotted lines respectively) and i = 0.001. The curve at e = 2.08
demon-strates only the features of a liquid globule, while the curves at F = 2.50
and 2.91 initially demonstrate the response characteristic of a solid globule. Upon passing the transition points shown in the Figure 7-2 inset (indicated in this figure by the arrows), the pulling response re-verts to liquid-like behavior. This transition is also seen in direct mea-surements of the globule reorganization dynamics by plotting F(50r, L)
versus L, which demonstrates a similar transition that is also indicated
by arrow s. . . . . 208 7-5 F(i, L) as a function of time i for a variety of
L
at j = 2.50. At lowextensions L < 0.5, there is long time correlations in the globule due to
its solid structure. As the globule transitions to a liquid state at L > 0.5
due to globule shrinkage, the time correlation now demonstrates signif-icant decay. The values of F(50r, L) are graphed in the bottom panel
of Figure 7-4 to show that these dynamic changes directly correspond to the pulling response of the globule. . . . . 209 9-1 This figure shows the energy landscape of a binding-unbinding
transi-tion for two adjacent beads. We consider only two states, an unbound state where two beads only interact through the standard Lennard-Jones potential for a e-polymer, and a bound state where there is a harmonic spring connecting the two binding beads. There is an overall change in energy upon binding AEo, which results from the difference in activation barriers for forward (AEB) and backward (AEUB) reactions.226
9-2 A plot of size (R2 )1/2 as a function of binding energy AEO for a num-ber of activation energies, designated by AEB (see 9-1). All values of AEB fall along the same universal curve, demonstrating that the equilibrium structure for globules collapsed by reaction mechanisms is
only determined by AEo. . . . . 227
9-3 Logio-logio plot of the correlation function (gB(n)) as a function of the distance between two beads n. For a e-polymer, there should be a scaling of (gB(n)) ~ n-3/2 which is characteristic of a Gaussian chain.
A number of curves representing different of values of AEO are plotted,
along with a dashed line representing this n-3/2 scaling. Clearly, as AEO is decreased, large deviations from this behavior occur. At very low values of AEo, there are two regimes. At low values of n, the typical e-polymer behavior remains, however at higher values of n the scaling becomes (gB(n)) ~ nO. This is shown on the graph by the dotted line. This behavior is characteristic of polymer globule structure. . . . . 229
9-4 (a) The root-mean-square radius of gyration (R2)1/2/a as a function of the reaction energy AEO for a number of periodicities p. As p increases, the extent of collapse strongly decreases. N = 100 for all values of p,
and data is aggregated from simulations with low AEB and AEUB such that the equilibrium state is observed. (b) Comparison of the relative probabilities of finding a binder that has an index of multiple of 4 (N4)
versus a binder that is not a multiple of 4 (N!4). This metric 3N4/N 4 describes the relative amount of binders radially from the center of mass (r) for p * 1. Thus, the case p = 1 is roughly flat and centered
on 3N4/NI4 = 1, while p = 2 and p = 4 demonstrate an abundance
of binding beads in the center. As the length of non-binding chain separating two binders increases, there is an increased tendency for the binders to partition to the center of the globule. N = 100. and
A EO = -4. . . . 230
9-5 The collapsing behavior of a Lennard-Jones polymer (solid lines) de-scribed by plotting (R2)/N as a function of the Lennard-Jones interac-tion parameter
siL.
Equation 9.3 is used to replot data like that seen in 9-2 as a function of an "effective" interaction parameter UEFF that corresponds to ULJ. Data is shown for p = 1 (filled squares), p = 2 (open squares) and p = 4 (open circles). There is a different extent of collapse seen in reacting polymers due to the presence of topological effects that prevents the realization of full chain collapse. This effect can be lowered by including difunctional binding, rather than making binding exclusive. The inset shows the effect of difunctional binding by plotting N = 50 (black) and N = 100 (red) for both monofunctional (filledsym-bols) and difunctional (open symsym-bols) binding. Difunctional points are plotted using the effective energy term described in 9.5. Polymers with difunctional binders are driven to a more collapsed state, however full Lennard-Jones comparison is still not completely possible. All points on these figures have error bars smaller than the size of the symbols. . 232
9-6 Lattice picture of the interior of a collapsed globule with self-associating behavior. A given binder (green lattice site) can bind to any of z neigh-bors (blue lattice sites) through a binding association (red arrow). This behavior is shown in (i) and (ii), which each demonstrate a binding pos-sibility. There is also a probability PUB = (1 + e-AEo)-z that a given
binder is not bound to any of its neighbors, which is shown in (iii).
By enumerating the probability of being bound versus unbound in this
type of system, it is possible to describe the corresponding "effective" interaction parameter eff that would give the same behavior in a Lennard-Jones system. . . . . 233 9-7 Local correlation factor F(T) as a function of i for a variety of values of
AEUB, and fit to 9.9 (black lines) using the values F(0) = 3.33,
4
= 0.21,and fuB = 0.87. N = 50, AEO = 0, and p = 1. The main plot shows an
enlarged portion of the overall correlation behavior. This clearly shows the important features of this plot, namely the quantitative fit between simulation and 9.9 for a variety of values of AEUB. The inset shows the overall correlation behavior, which demonstrates a very rapid decay at
i~ 0 due to the diffusion of unbound beads. . . . . 238
9-8 Normalized global correlation factor (C -2-AO)/(A1+A2) as a function
of t for a variety of values of AEUB, and fit to 9.13 (dashed lines) using
the values TR = 195 and A2/(A1 + A2) = 0.35. N = 50, AEo = 0, and
p = 1. In the inset, the same data is plotted on a semilog plot of
In ((C/ - Ao)/(A1+ A2)) versus i. This clearly shows the emergence
of the second time scale at large AEUB, in agreement with the double-exponential fit used. . . . . 240
9-9 In rL as a function of the unbinding energy AEUB for a N = 30 (filled
squares), N = 50 (open squares), and N = 100 (circles) with AEO = 0
(black symbols), AEO = -2 (red symbols) and AEO = -4 (green sym-bols). Both simulation data (symbols) and theory (lines) are shown, with the Rouse time r chosen to match the simulation data. Two regimes are apparent -at low AEUB relaxation is dominated by Rouse motion, while at high AEUB relaxation is dominated by binder kinet-ics. The theoretical time scale of a single binder is shown by the dotted, thick black line which matches up well with the binder kinetic regime for all curves at large AEUB . . . . - - - .- 241
9-10 (R2)1/
2VS. egf for
N =
50. As the value of AEUB (AEB = 0) isincreased and the globule is collapsed, the initial state of the globule has an effect on its size at the time scale of the simulation (5 x 10⁸
time steps). If the initial configuration is elongated (black points), there is a finite time for the collapsed structure to become realized.
If the structure does not have the ability to relax fully in the time
scale of the simulation, it remains larger than equilibrium collapsed conformation. This is seen in the points above ieff > 2, where AEUB is large. If the globule is collapsed by slowly increasing the value of AEUB
(red points), the resulting size is closer to the equilibrium collapsed structure. The solid black line indicates the collapse of a Lennard-Jones system with respect to the interaction parameter GiJ. Error bars are smaller than the size of the data points. . . . . 243
10-1 Relevant transitions in conformational space. A coil or globule will be
stretched by a shear flow
4.
The concurrent tumbling instability will drive the polymer back into the coil or globule, however due to either hydrodynamic effects or association constraints the polymer may be at first resistant to stretching for some subsequent amount of time. We dub this state the "stuck globule" (sg) state, and the traditional coil-elongational description represents the "coil-stretch" (cs) state. The arrows show the conformational trajectory of a self-associating polymer in shear flow. . . . . 25110-2 The energy landscape for a single associating pair of binding monomers. If two spatially adjacent monomers are within the reaction radius, there is a possibility that these monomers will bind and a spring between the two will form. The energy barrier to form this bond is given by AEB,
and the barrier to unbind from this bond is given by AEUB- -. . . . . 254
10-3 (a) Polymer elongation (L)/(2N) as a function of the shear rate :y
for different values of AEO and AEUB. As expected, decrease in AEO results in the collapse of the polymer at all values of
4.
Increasing values of AEUB demonstrate the presence of a marked decrease in the ability of the polymer to elongate under the influence of shear for all values of AEO. The response for a e-polymer is also shown, and also demonstrates non-monotonicity due to the same effect as that seen for the binders, only solely due to hydrodynamic effects. (b)(L)/(2N) vs.
4
for different values of AEUB at AEO = 0. Simulationdata (points) matches well with the theoretical prediction (lines). The
LJ response for a polymer of similar level of collapse 6 = 0.55 is also
shown (connected points), and serves as an input for the theory. Green arrows correspond to time sequences shown in (c). For (a) and (b), error bars are smaller than symbol size. (c) Polymer elongation L/(2N) as a function of time at a number of shear rates with AEO = 0 and AEUB = 5.0. Notice the suppresion of stretching events as shear rate
10-4 Power spectral density P versus frequency C for LJ-polymer (filled symbols, ii = 0.55) and self-associating polymer (open symbols, AEO =
0, AEUB = 11.0) for the shear rates indicated in Figure 3b-c. Both
trends are the same, except in magnitude, implying the same shear response except when suppressed by the stuck globule state. . . . . 259 10-5 Power spectral density Po versus frequency & for LJ-polymer (filled
symbols, ii = 0.55) and self-associating polymer (open symbols, AEO =
0, AEUB = 11.0) for the shear rates indicated in Figure 10-4. Like
Figure 10-4, both trends are the same except in magnitude, implying the same shear response except when suppressed by the stuck globule state. ... 260 11-1 Schematic demonstrating the extending and shortening pathways along
the M-coordinate, occuring with frequency v, and v_ respectively. The elongating pathway, represented by the left to right process, occurs when a bond (between the two red dots) along the shortest chain (red path of length M) is broken. The next-shortest chain (of length M+n) thus becomes the shortest chain, extending the chain for n > 0 (blue
chain segment). The shortening pathway, represented by the right to left process, occurs when two beads n apart along the shortest chain contour of length M + n bind to produce a shortest chain of M. While other modes for the shortening process are imaginable, we assume these contributions to be negligible. . . . . 271
11-2 Fraction of monomers undergoing binding associations (4, black points) as a function of AEo for a N = 50 chain. Due to exclusivity constraints
and spatial correlation effects, the fraction
4
is below what would be expected for a simple 2-state (bound-unbound) system (given by the purple, solid line,4o
= (1 +eAEo-1). . . . . 275 11-3 The simulation-calculated form for the distribution Q(n) as a functionof n for a N = 200 bead chain at AEo = 0.0 and AEO = -2.0 around equilibrium at L = 40 (small deformations). These distributions hold for small extensions, but at longer extensions this value will be expected to likewise evolve with the state of the system. At this limiting case, these distributions take the form of a double-exponential decay given
by equation 11.21, which is shown by the solid fit lines (simulation data
is given by points). The only point where this fit is insufficient is for n = 0, however in the the theory developed in this paper, associated