Publisher’s version / Version de l'éditeur:
International journal of thermophysics, 31, 8-9, pp. 1402-1416, 2010-05-01
READ THESE TERMS AND CONDITIONS CAREFULLY BEFORE USING THIS WEBSITE.
https://nrc-publications.canada.ca/eng/copyright
Vous avez des questions? Nous pouvons vous aider. Pour communiquer directement avec un auteur, consultez la première page de la revue dans laquelle son article a été publié afin de trouver ses coordonnées. Si vous n’arrivez pas à les repérer, communiquez avec nous à PublicationsArchive-ArchivesPublications@nrc-cnrc.gc.ca.
Questions? Contact the NRC Publications Archive team at
PublicationsArchive-ArchivesPublications@nrc-cnrc.gc.ca. If you wish to email the authors directly, please see the first page of the publication for their contact information.
This publication could be one of several versions: author’s original, accepted manuscript or the publisher’s version. / La version de cette publication peut être l’une des suivantes : la version prépublication de l’auteur, la version acceptée du manuscrit ou la version de l’éditeur.
For the publisher’s version, please access the DOI link below./ Pour consulter la version de l’éditeur, utilisez le lien DOI ci-dessous.
https://doi.org/10.1007/s10765-010-0748-2
Access and use of this website and the material on it are subject to the Terms and Conditions set forth at A mechanism for the oxidation-related influence on the thermoelectric behavior of palladium
Ohm, W.-S.; Hill, K. D.
https://publications-cnrc.canada.ca/fra/droits
L’accès à ce site Web et l’utilisation de son contenu sont assujettis aux conditions présentées dans le site LISEZ CES CONDITIONS ATTENTIVEMENT AVANT D’UTILISER CE SITE WEB.
NRC Publications Record / Notice d'Archives des publications de CNRC:
https://nrc-publications.canada.ca/eng/view/object/?id=fa92e9fc-3737-4f95-821d-ed81b5bed227 https://publications-cnrc.canada.ca/fra/voir/objet/?id=fa92e9fc-3737-4f95-821d-ed81b5bed227
A Mechanism for the Oxidation-related Influence on the
Thermoelectric Behaviour of Palladium
W.-S. Ohm1,2and K. D. Hill1,3
1National Research Council of Canada, Ottawa, Canada.
2School of Mechanical Engineering, Yonsei University, Seoul, Korea
Abstract
Oxidation of thermocouple elements can degrade the accuracy of thermocouple-based temperature measurements. As a particular example of such effects, oxidation of the Pd element of a platinum/palladium thermocouple is known to increase the thermoelectric emf by an amount equivalent to a temperature change of order 100-200 mK at 420 °C [1].
We propose a possible physical mechanism to explain how oxidation affects the thermoelectric output of a Pt/Pd thermocouple. The analysis hinges on the hypothesis that the oxide-induced strain within the Pd thermoelement leads to a change in the Seebeck coefficient, and therefore to the thermoelectric emf.
A theoretical model relating deformation of the palladium lattice to the change in the Seebeck coefficient is presented. The level of agreement between the calculation and the experimental observations suggests that oxide-induced strain in the Pd thermoelement is a likely explanation for the change in thermoelectric output of a Pt/Pd thermocouple within the temperature range where oxidation is active.
1. Introduction
Oxidation of thermocouple elements can degrade the accuracy of thermocouple-based temperature measurements. As a particular example of such effects, oxidation of the Pd element of a platinum/palladium thermocouple is known to increase the thermoelectric emf by an amount equivalent to a temperature change of order 100-200 mK at 420 °C. Changes in thermoelectric properties of the Pt component are known to be insignificant within the heat-treatment temperature range of interest (below 900 °C). For this reason, our attention is devoted to the Pd leg only.
The physical mechanism (or mechanisms) responsible for the reversible change in Seebeck emf following oxidation of the Pd thermoelement remains the subject of speculation, at least in our opinion. The principal investigators have been Burns and Ripple (NIST), Bentley (NMIA), and Hill (NRC). We exclude from the current discussion irreversible changes (i.e. drift) that generally occur at temperatures exceeding 1000 °C.
The oxidation of Pd was well-described by Burns and Ripple [1]; “When Pd wire is heated in air at temperatures in the range from about 350 °C to 800 °C, a dark gray oxide film forms rapidly on the surface and thickens as the time at elevated temperature is increased. When heated to temperatures above about 800 °C, the superficial oxide decomposes very quickly, leaving a clean metal surface.” With regard to the effect on the thermocouple, they opined “The increase in inhomogeneity and decrease in the thermocouple emf at full immersion are caused by the oxidation of the Pd thermoelement.” In a later article, they wrote [2] “At temperatures above 500 °C, oxidation causes a measurable shift of the thermoelectric properties of Pd.” In their most recent article on the topic [3], they “suggest that there are two separate reversible effects of opposite signs: a reversible decrease in thermocouple emf following exposure to temperatures in the approximate range 550 °C to 800 °C, and a reversible increase following exposure to temperatures in the approximate range 750 °C to 950 °C.” The article concludes “At this time, we cannot identify unambiguously the source of the reversible changes. Our previous work attributed reversible decreases in emf to an oxidation effect, but it is not likely that oxidation of Pd is the source of the emf increase in the
range 750 °C to 950 °C, which is generally above the approximate range 350 °C to 800 °C where Pd oxide is stable. … It is clear that the reversible effects observed with Pd are complex and depend on the particular lot of Pd used. What is not clear is the identification of the impurity or other property responsible for the effect in the range 750 °C to 950 °C.”
Bentley expressed the opinion that [4] “In principle, the presence of oxide on an element may affect its Seebeck coefficient either as a consequence of its effect on the Fermi surface of the metal or because of parallel electrical conduction through the oxide film. Unless significant oxide is formed interstitially or along grain boundaries it seems unlikely that oxidation would affect the Fermi surface. It is possible that oxygen in solid solution affects the Fermi surface, and there is some evidence for such solubility in Pd, but not below 800 °C.” In a subsequent paper [5], he stated that “Clearly, the Seebeck EMF of Pd decreases when the metal is heated in the range 550–850 °C … I suggest that oxidation, per se, is unlikely to affect the Seebeck coefficient, although dissolved, interstitial oxygen may.” In his most thorough and most recent article on the subject [6], Bentley wrote: “… annealing a Pd wire of high purity at 700 °C will decrease its Seebeck emf for temperatures up to about 700 °C and increase it above 800 °C. … Heating in air at 1000 °C, and above, establishes significant levels of oxygen in the metal in two modes: in solid solution, with little effect on Seebeck coefficient, and as impurity oxides (of base metals), with a significant lowering of the coefficient. A subsequent heating at temperatures around 700 °C converts some oxygen from solid solution into impurity oxides, probably of the Pt metals. The latter oxides would then decompose at 1000 °C. In summary, all thermoelectric changes observed in Pd seem to be governed by impurities. … It is suggested that all changes observed in this study, in the Seebeck emf of Pd, are due to impurities. In particular, the reversible change at around 700 °C is due to the oxidation of impurities.”
According to Hill [7], “The Pd RTD results illustrate unequivocally that the oxidation of palladium is most active in the temperature range 600 °C to 800 °C. The impact of this oxidation process on the performance of Pt/Pd thermocouples is decidedly more complex. The isothermal heat treatments of the thermocouples resulted in either no change or a small decrease in the inhomogeneity of high-purity (>99.99 %) Pd wires as determined from
immersion profiles in a freezing zinc ingot. However, the thermoelectric emf increased with the temperature of heat treatment, peaking near 750 °C before decreasing. The peak change was approximately 1.5 μV (equivalent to 0.15 °C) at the zinc point. The emf exhibited a secondary increase from 850 °C to 900 °C that is clearly not due to oxidation, as the Pd RTD results indicate that Pd oxide does not form above 800 °C.”
Having established the context through the words of the various authors, it is fair to conclude that no definitive explanation for the reversible changes in Seebeck emf of the Pd thermoelement exists, though there is speculation (by some) that impurities are to blame. It seems to us that the formation of palladium oxide must play some role since the change in thermoelectric emf that occurs below 800 °C is coincident with the oxide growth, and is a maximum at the temperature where Pd oxide growth is also a maximum (725 °C). With that in mind, we suggest that the strain developed by surface Pd oxide is significant enough to cause noticeable variation in Seebeck emf. It is this hypothesis that we explore herein.
2. Thermocouple response to tensile stress
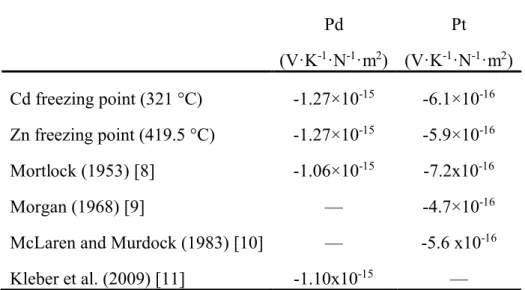
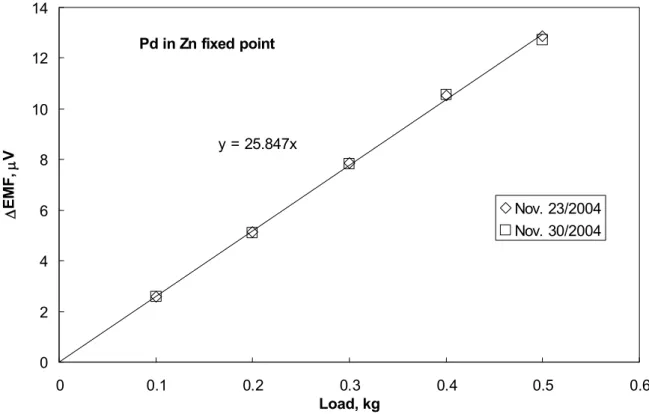
It has long been recognized that the thermocouple voltage is affected by tensile stress. We devised an experiment to individually place the 0.51 mm diameter wires comprising a Pt/Pd thermocouple under “simple extension” (i.e. axial tension with no restriction on transverse deformation), while the junction was maintained at a constant temperature in a freezing ingot of either cadmium or zinc with the reference junction maintained in an ice point at 0 °C. Figure 1 provides an example of the experimental data and Table 1 summarizes the sensitivity coefficients derived from a linear fit to the various data sets. Table 1 also includes data obtained from the literature. Mortlock [8] reported a value of -1.04×10⁻¹⁰V·K-1·kg-1·cm2 for
palladium and -7.1x10⁻¹¹ V·K-1·kg-1·cm2 for platinum with the thermocouple reference and
measuring junctions at 20 °C and 100 °C, respectively. Dividing by the acceleration due to gravity to convert from weight to force and rearranging units, we obtain -1.06×10⁻¹⁵V·K-1·N -1·m2and -7.2x10⁻¹⁶ V·K-1·N-1·m2 for Pd and Pt, respectively. Morgan [9] obtained -4.7×10⁻¹⁶
Murdock [10] reported extensive data for Pt for different temperatures and wire sizes, and a representative value of -5.6 x10⁻¹⁶V·K-1·N-1·m2 can be obtained by averaging their results for
0.5 mm diameter wire with the measuring junction at the tin freezing point (232 °C). Recently, Kleber et al. [11] obtained the value -1.10x10⁻¹⁵ V·K-1·N-1·m2 for Pd near room
temperature.
3. Stress in Pd wire induced by Pd oxide growth
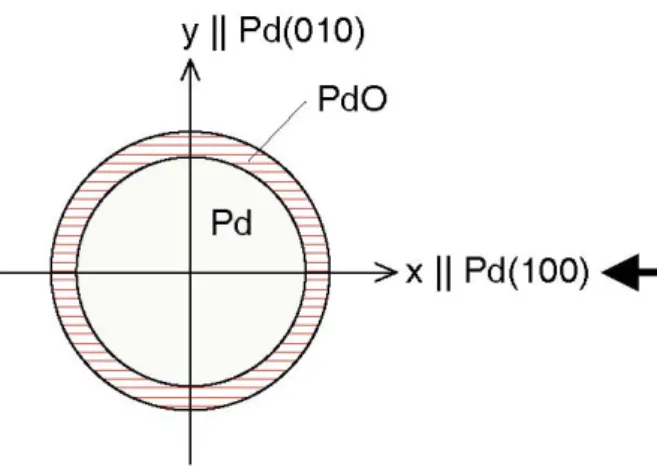
Stress in the Pd thermoelement arises from Pd oxide formation as a consequence of the lattice mismatch between Pd metal and Pd oxide. Pd metal forms a face-centered-cubic structure with a lattice constant of 3.89 Ǻ [12] and a nearest-neighbour distance of 2.75 Ǻ. Palladium oxide (PdO) crystallizes in a tetragonal structure with Pd atoms at all corners and in the center, and O atoms at (0,1/2,1/4), (0,1/2,3/4), (1,1/2,1/4), and (1,1/2,3/4) (Fig. 2); the experimental lattice constants are a = 3.04 Å and c = 5.34 Å [13]. For PdO, the Pd-Pd nearest-neighbour distance of 3.04 Å exceeds the metallic Pd value by approximately 10%.
At this juncture, it is fitting to point out that a detailed calculation of strain arising from the formation of oxide film is a rather complicated and computationally expensive undertaking. Three factors contribute to the complexity that renders a rigorous analysis in elasticity impractical for the purpose of this article. First, single-crystal palladium is a highly anisotropic solid – the anisotropy ratio based on the elastic constants of palladium, c11= 227.1
GPa, c44 = 71.73 GPa, and c12 = 176.04 GPa [14], is = 2c44/(c11-c12) = 2.8, a value far from
unity for isotropic solids – and therefore detailed information on the morphology and orientations of individual grains forming the actual Pd leg may be necessary for an accurate evaluation of stress and strain. Second, due to the relatively large mismatch between Pd and PdO lattices ((3.04 Å - 2.75 Ǻ) / 2.75 Ǻ = 10.5%), nonlinear elasticity must be taken into account, especially near the Pd/PdO interface where the lattice distortion is greatest. Third, the elastic boundary conditions at the Pd/PdO interface are not known a priori, but are specified only implicitly in terms of lattice mismatch between the two bulk materials; the
stress and strain at the interface are to be determined by solving the relevant elasticity equations.
In order to circumvent these difficulties, we propose a simplified picture of the strain profile inside the Pd component. The primary effect of the surrounding oxide film is to elongate the Pd element in the axial (z-) direction, where the cross-sectional average of elongation is approximately proportional to the relative cross-sectional area and the relative elastic stiffness of PdO (see Fig. 3).
In other words, the average axial strain zzwithin the Pd leg is represented along with
two proportionality relations
zz , (1) Pd PdO PdO A A A , (2) and Pd PdO Y Y . (3)
Here, APd,PdO and YPd,PdO are the cross-sectional area and the stiffness (Young’s Modulus) of
Pd and PdO, respectively. The average axial strain due to the lattice mismatch is thus given by
Pd PdO Pd PdO PdO mismatch Y Y A A A . (4)
The axial elongation is accompanied by contraction in the transverse directions:
xx= yy= - (5)
where xx,yy are average strains in the x- and y-axes and is the ratio of the transverse
deformation to the axial elongation. (In the case of simple extension, the parameter assumes the role of Poisson’s ratio.) Equations (1), (4) and (5) constitute a two-parameter (
and ) representation of the surface oxide-induced strain in the Pd wire. Young’s Modulus for bulk Pd is 170 GPa [15] and that of PdO is estimated to be 169 GPa [16]. This leads to the expression YPdO/ YPd≈ 1.
To assess the thickness of the PdO layer, we turn to the oxidation of a palladium resistance thermometer [7]. In that study, a Pd RTD was subjected to a series of incremental heat treatments at temperatures from 500 °C to 900 °C in a manner similar to that for the thermocouples, and the subsequent change in resistance of the Pd RTD at the triple point of water (0.01 °C) was carefully monitored (Fig. 4). Because the surrounding PdO film is a poor conductor of electricity, the fractional change in resistance is directly proportional to the relative cross-sectional area of the PdO layer. From Fig. 4, the maximum increase in resistance is about 0.008 following the heat treatment at 725 °C. In other words, APdO/(APdO+
APd) ≈ 0.008 (i.e. oxide thickness ~ 0.5 m) at the peak oxidation rate for the 0.25 mm
diameter wire used to construct the RTD. Substituting the stiffness and area ratios appropriate to the 0.5 mm diameter thermocouple wire (i.e. APdO/(APdO+ APd) ≈ 0.004 for the same oxide
thickness) into Eq. (4) yields ≈ 4.2×10⁻⁴. The accompanying transverse contraction of the
Pd leg (given by Eq. (5)) is much harder to estimate, although the effective contraction ratio is believed to be in the neighbourhood of 0.38, Poisson’s ratio for single-crystal palladium [14]. Because of the relatively high uncertainty associated with calculating, we instead elect to consider values of falling within some reasonable bounds such as 0.3 <.
So far, we have estimated the strain in the Pd wire resulting from oxide formation. The experimental data of Section 2 provides the sensitivity coefficients required to relate change in thermocouple emf to simple extension. The force of extension on the wire is connected to the strain (fractional change in length) via Young’s Modulus:
= / Y . (6)
Here, is the stress and Y is Young’s Modulus. With Y = 170 GPa [15] as the bulk value for Pd, our calculated ≈ 4.2×10⁻⁴ corresponds to ≈ 7.1×10⁷ N·m-2. With our measured
coefficient is 9×10⁻⁸ V·K-1. When measured at the freezing point of zinc (419.527 °C), the
expected change in emf is 38 V. This is clearly much larger than the 1-2 V reported [7]. Different loading modalities (i.e. loading by simple extension as in Section 2 vs. loading via surface oxidation) produce fundamentally different strain profiles, leading to different contraction ratios even for the same average axial strain . Therefore, a direct comparison of the two cases may be inappropriate. Still, given the simplifications that we introduced when calculating the strain, this is a better situation than finding the prediction orders-of-magnitude less than the observed value. We view the oxide-based strain hypothesis as a possible, and even probable, explanation for the reversible change in the Seebeck coefficient of Pd in the temperature range where oxidation occurs (mainly 600 – 800 °C).
4. Strain, the electronic density of states, and thermoelectricity
The preceding discussion has been largely phenomenological in nature. However, any fundamental discussion of thermoelectricity (and the influence of strain) must consider the nature of the conduction electrons responsible for the Seebeck effect.
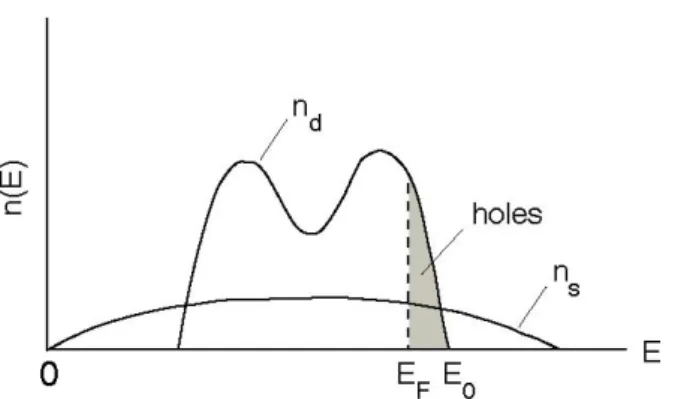
Figure 5 schematically shows the electronic structure of a d-band transition metal such as palladium. Here, nd and ns are, respectively, d- and s-like densities of electronic states
originating from the d and s atomic orbitals of constituent atoms. Valence electrons occupy energy states up to the Fermi energy EF, and the energy at the top of the d-band is denoted by
E0.
Mott and Jones [17] derived the expression
) ( 6 0 F 2 B 2 E E e T k S (7)
for the thermopower of transition metals such as Pd and Pt, where kB is Boltzmann’s
numerical factor 1/6 in Eq. (7) by x/3 where x is a (fitting) parameter whose value varies slightly among transition metals. Barnard [19] provides an insightful derivation of Eq. (7), which we shall reproduce briefly beginning with the general expression for the Seebeck coefficient
F E E E E e T k S ln 3 2 B 2 (8)(E) is the electrical conductivity and EFis the Fermi energy. By assuming that conduction is
predominantly via the s-electrons, that these s-electrons behave as free electrons, and that scattering into empty d-states is the dominant scattering mechanism, the expression in brackets becomes
E F F E E E E E E F 2 0 1 2 3 ln (9)where E0is the energy at the top of the d-band (relative to the bottom of the s-band). For
transition metals with parameters such that (E0-EF) <<EF, we recover Eq. (7). However, we
will use Barnard’s expression (Eq. (9)) for our analysis.
The Fermi energy EF varies only weakly with temperature [18]; therefore, it is
reasonable to assume a linear dependence of the Seebeck coefficient on temperature. Where this is valid, the temperature-independent part of the Seebeck coefficient,
) ( 2 1 3 2 3 0 2 B 2 F F E E E e k T S (10)
is a function of material parameters only. Both the Fermi energy EFand the top of the d-band
The sensitivity of the Seebeck coefficient to strain is obtained by differentiating Eq. (8) with respect to the average axial strain :
T T S S (11) From Eq. (10), ) ( 2 1 3 2 3 0 2 B 2 F F E E E e k T S . (12)
Equations (11) and (12) show that the Seebeck coefficient’s sensitivity to strain is through the strain-induced variation in E0and EF. The resulting change in thermocouple voltage is
l dz dz dT T T S 0 emf (13-a)
a t T T TdT T S , (13-b)where l is the length of the Pd segment that has undergone uniform heat treatment (oxidation), Tt the absolute temperature at the thermocouple tip, and Ta the reference (ice) junction
absolute temperature. (We omit the subscripts “Pd” in Eqs. (13) without ambiguity.) Note that the particular form of Seebeck sensitivity in Eq. (13-a), showing no explicit dependence on z, allows the integrand of Eq. (13-a) to be written as an exact differential of 2
2
1T as in Eq.
(13-b). The change in thermoelectric emf thus becomes, regardless of the temperature profile,
T S T T ) ( 2 1 emf 2 t 2 a . (14)
The Linear Combination of Atomic Orbitals (LCAO) model, also known as the tight-binding approximation, offers a simplified framework for calculating E0 and EF [20, 21].
Formulation of the method and the computational procedure are elucidated by Harrison [21]. We will briefly discuss our approach to accommodating lattice deformation within the method. For the sake of analysis, a single-crystal Pd thermoelement is considered, whose (001) crystalline direction coincides with the thermocouple (z-) axis as depicted in Fig. 3.
At the core of the LCAO method is the construction of the 6×6 Hamiltonian matrix
e 0, Hi, H i i i
k r k (15)where k is the wave vector, rithe position of the ithatom nearest the central atom at the origin,
H the Hamiltonian of the time-independent Schrödinger equation, and , (=1, 2,…, 6) the indices for an atomic orbital basis consisting of the outermost s-state and five d-states per atom. The interatomic energy integral 0, Hi, quantifies the extent of spatial overlap between the orbital of the central atom and the orbital of the ithneighboring atom. For a
face-centered cubic (fcc) solid such as palladium, there are twelve nearest neighbors surrounding the central atom, situated at ri = (±a0/ 2, ±a0/ 2, 0), (±a0/ 2, 0, ±a0/ 2), and (0,
±a0/ 2, ±a0/ 2), where a0 is the strain-free lattice constant. Upon application of uniform axial
strain, these nearest neighbors are relocated to
ri= (±b / 2, ±b / 2, 0), (±b / 2, 0, ±a / 2), and (0, ±b / 2, ±a / 2), (16)
where the new lattice parameter a in the axial (z-) direction is, in terms of the axial strain,
a = (1 + )a0 (17)
b = (1 -)a0. (18)
With Eqs. (17) and (18), the position vector riof a nearest neighbor (Eq. (16)) is recast in the
general form d n m l i (xˆ yˆ zˆ) r (19)
where (l, m, n) are direction cosines, d the distance from the central atom, and xˆ, yˆ , and zˆ unit vectors in the Cartesian coordinates. Together, Eqs. (16)–(19) completely specify the crystalline structure of the Pd component for any given strain . The interatomic matrix elements Ei, 0, H i, in Eq. (15) depend on the lattice structure (Eqs. (16)–(19)) via
the functional forms tabulated in Table 20-1 of Harrison [21].
Once the Hamiltonian matrix H(k) in Eq. (15) is summed over the contributions
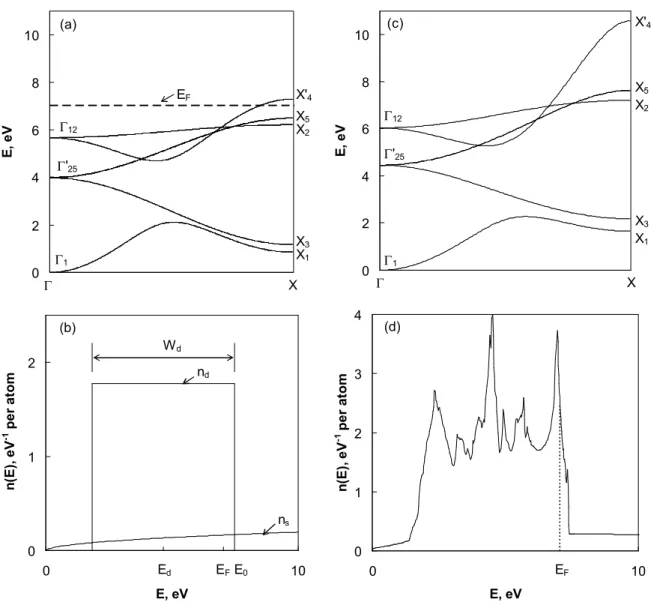
from the twelve nearest neighbors, the energy bands are given by the eigenvalues corresponding to the Bloch vector k. Figure 6(a) shows the resulting energy bands for palladium. There are five bands associated with the d atomic states, emerging from either 12
(two-fold degenerate) or ′25 (three-fold degenerate). These d-bands are hybridized with the
free-electron-like s-band emanating from 1 toward X′4. To facilitate calculation of the top of
the d-band energy E0 and the Fermi level EF, we adopt a two-parameter description of the d
bands [21], where the d-band width Wd and its nominal energy Ed relative to the s-band
minimum 1are defined by
Wd= X5– X1, (20)
5212 5325
1 d
E . (21)
The values of Wd, Ed, and E0 ≡ Ed + ½Wd computed from the energy bands of Fig. 6(a) are
5.64 eV, 4.66 eV, and 7.48 eV, respectively. Then, the d-band density of electronic states can be expressed by a boxcar function centered at Edwith bandwidth Wd [21, 22],
( ) ( )
) 10 ( ) (E W H E E 21W H E E0 nd d d d , (22)where H is the Heaviside step-function. The density of the free-electron-like s-states is given by a parabola [21], E m v E n s s 2 3 2 2 2 2 ) ( (23)
where v = ab2/4 is the atomic volume (the divisor 4 accounts for the fact that one unit cell of
an fcc solid contains four atoms) and ms= m(1 + 20rd3/3v)-1the free-electron effective mass.
These densities of states are shown in Fig. 6(b). The total density of states is the sum of ndand
ns. It is immediately apparent from Fig. 6(b) that Eq. (22) is a crude approximation for the
real density of d-like states. By way of comparison, Fig. 6(c) is the somewhat more complex (e.g., includes second-neighbour interactions) band structure calculation of Papaconstantopoulos [23] along the same symmetry direction as in Fig. 6(a). Fig. 6(d) is the Pd electron density of states following [23]. Nonetheless, use of Eq. (22) can be justified to a certain extent because evaluation of the Fermi energy requires integration of the density of states, which smoothes out the structural details. The Fermi energy is obtained by integrating the total density of states until the value is equal to ten, the number of valence electrons per palladium atom. This yields EF= 7.04 eV, in fair agreement with more sophisticated analyses:
7.06 from [23], 7.08 eV from [24], 7.35 eV from [25] and 6.80 eV from [26].
Applicability of the model is demonstrated by its ability to predict the absolute Seebeck coefficients for the case of zero strain. Eq. (10) combined with the LCAO calculations of the energies EFand E0is tested against experimental data for palladium in Fig.
7. The dashed line is a linear fit to the widely-cited experimental values reported by Cusack and Kendall [27] (closed circles). For completeness, we also show the more recent data of Laubitz and Matsumara [28] (open circles), though their measurements do not extend to as high a temperature. The linear temperature dependence anticipated by the model agrees well
the prediction of the model (Eq. (10)) with EF = 7.04 eV and E0= 7.48 eV. It is remarkable
that the prediction of the model with no free parameters yields ∂S/∂T within 0.08% of the experimental value. This leads us to believe that the theory in conjunction with an appropriate band calculation scheme (such as the LCAO method) can be an effective analytical tool for investigations of thermoelectric phenomena. In particular, we expect that the method is more than adequate for investigating the oxide strain hypothesis since inadequacies of the physical model ought to cancel (to first order), and we are interested in the difference rather than the absolute value.
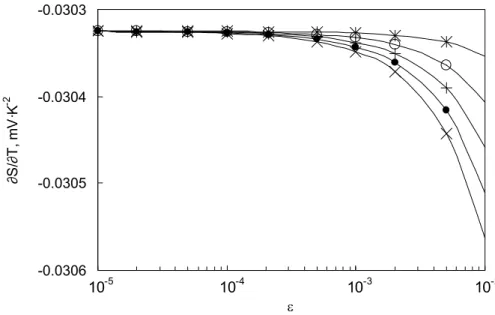
Figure 8 shows the temperature-independent part ∂S/∂T (Eq. (10)) of the Seebeck coefficient as a function of for a number of possible choices of . Calculations of the energies EF and E0 are performed using the LCAO scheme, and the computed values are
substituted into Eq. (10) to produce the data points shown as asterisks, circles, dots, and crosses, respectively. Though not clearly demonstrated by the semi-log plot, the dependence of ∂S/∂T on strain is very linear. It is worth noting in Fig. 8 that for = 0.5 (shown with asterisks) where the dilatation (1 - 2 is zero, there remains some change in the Seebeck coefficient. This is because the arrangement of constituent atoms and thus their overlap in atomic orbitals are perturbed by the presence of the oxide film, even though the Pd crystal maintains its initial volume for = 0.5.
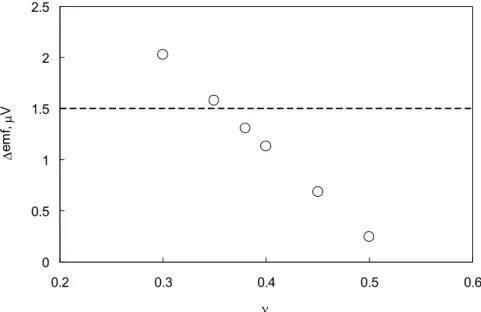
Changes in emf at the maximum oxidation rate ( ~ 4.2×10⁻⁴) calculated according to
Eq. (13) with temperatures Tt= 692.677 K (zinc melting point) and Ta = 273.15 K (ice point)
are shown for several possible estimates of in Fig. 9. The emf change of 1.5 V measured by Hill [7] is within 13% of the theoretical prediction for = 0.38 (Poisson’s ratio for single-crystal palladium) and reconciliation is possible through modest alterations to either the assumed oxide thickness or . Bearing in mind the approximations made in our analysis, this agreement between the model and the experimental observation is remarkable. Again, notice the non-zero (albeit small) change in emf at = 0.5, where the volume of the Pd leg remains constant though the lattice structure experiences distortion due to oxidation.
A physical mechanism to account for the change in the Seebeck emf of a Pt/Pd thermocouple subjected to oxidation is proposed. Oxidation of the Pd thermoelement is believed to introduce internal stress that distorts the crystalline structure of palladium. This perturbs the electron states and hence the Seebeck coefficient of the Pd component, causing the change in thermoelectric emf. To quantify the proposed strain effect on the Seebeck emf, an analytical framework is presented to (a) estimate the strain due to Pd oxidation and (b) calculate the Seebeck coefficient from the underlying crystalline structure. Application of the model produces satisfactory agreement with the absolute Seebeck coefficient of palladium. In particular, the model predicts the correct sign and magnitude of the observed change in Seebeck emf at the peak oxidation rate despite the simplifying assumptions of the model. The result supports our hypothesis that oxide-induced strain is responsible for the reversible change in thermoelectric emf.
References
1. G.W. Burns, D.C. Ripple, in Proc. TEMPMEKO ‘96: 6th Int. Symp. Temperature and Thermal Measurements in Industry and Science, ed. by P. Marcarino (Levrotto & Bella, Torino, 1997) pp 171–6
2. G.W. Burns, D.C. Ripple, M. Battuello Metrologia 35, 761 (1998)
3. G.W. Burns, D.C. Ripple, in Proc. TEMPMEKO 2001, 8th International Symposium on Temperature and Thermal Measurements in Industry and Science, ed. by B. Fellmuth, J. Seidel, G. Scholz (VDE VERLAG, Berlin, 2002) pp. 61-66
4. R.E. Bentley, Measurement 23, 35 (1998)
5. R.E. Bentley, Meas. Sci. Technol. 11, 538 (2000) 6. R.E. Bentley, Meas. Sci. Technol. 12, 1250 (2001) 7. K.D. Hill, Metrologia 39, 51 (2002)
8. A.J. Mortlock, Aust. J. Phys. 6, 410 (1953)
9. E.S. Morgan, Brit. J. Appl. Phys. (J. Phys. D) 1, 1421 (1968)
10. E.H. McLaren, E.G. Murdock, The properties of Pt/PtRh Thermocouples for Thermometry in the Range 0-1100 °C, III. Effect of Mild Quenching and Deformation on Standard Thermocouples, NRC Monograph 17409 (NRC, Ottawa, 1983) pp. 112-113
11. X. Kleber, P. Roux, M. Morin, Phil. Mag. Lett. 89, 565 (2009)
12. N.W. Ashcroft, N.D. Mermin, Solid State Physics (Holt, Rinehart and Winston, New York, 1976) pp 115–117
13. D.B. Rogers, R.D. Shannon, J.L. Gillson, J. Solid State Chem. 3, 314 (1971)
14. H. Ledbetter, S. Kim, in Handbook of Elastic Properties of Solids, Liquids, and Gases, Vol. II, ed. by M. Levy (Academic Press, San Diego, 2001) p. 100
15. S.U. Jen, T.C. Wu, Thin Solid Films 492, 166 (2005) 16. X. Ning, H. Ye, Chinese Phys. Lett. 7, 188 (1990)
17. N.F. Mott, H. Jones, The Theory of the Properties of Metals and Alloys (Oxford University Press, London, 1936) pp 308–14
18. D.D. Pollock, Thermocouple Theory and Properties (CRC Press, Boca Raton, 1991) pp. 168–85
19. R.D. Barnard, Thermoelectricity in Metals and Alloys (Taylor & Francis Ltd., London, 1972) pp. 148-151
20. J.C. Slater, G.F. Koster, Phys. Rev. 94, 1498 (1954)
21. W.A. Harrison, Electronic Structure and the Properties of Solids (W. H. Freeman and Company, San Francisco, 1980) pp 476–530
22. J. Friedel, in The Physics of Metals: 1. Electrons, ed. by J. M. Ziman (Cambridge University Press, New York, 1969) pp 340–408
23. D.A. Papaconstantopoulos, Handbook of the Band Structure of Elemental Solids (Plenum Press, New York, 1986)
24. F.M. Mueller, A.J. Freeman, J. O. Dimmock, A.M. Furdyna, Phys. Rev B 1, 4617 (1970) 25. A.H. MacDonald, J.M. Daams, S.H. Vosko, D.D. Koelling, Phys. Rev. B 23, 6377 (1981) 26. A.P. Cracknell, in Metals: Phonon States, Electron States and Fermi Surfaces, Vol.
III/13c of Landolt-Börnstein, New Series, ed. by K-H. Hellwege, J.L. Olsen (Springer, New York, 1984) pp 281–90
27. N. Cusack, P. Kendall, Proc. Phys. Soc. 72, 898 (1958) 28. M.J. Laubitz, T. Matsumara, Can. J. Phys. 50, 196 (1972)
TABLES
Table 1. Tensile stress sensitivity coefficients for platinum and palladium thermocouple wires. Pd (V·K-1·N-1·m2) Pt (V·K-1·N-1·m2) Cd freezing point (321 °C) -1.27×10⁻¹⁵ -6.1×10⁻¹⁶ Zn freezing point (419.5 °C) -1.27×10⁻¹⁵ -5.9×10⁻¹⁶ Mortlock (1953) [8] -1.06×10⁻¹⁵ -7.2x10⁻¹⁶ Morgan (1968) [9] — -4.7×10⁻¹⁶
McLaren and Murdock (1983) [10] — -5.6 x10⁻¹⁶
FIGURE CAPTIONS
Fig. 1. Variation in the thermoelectric voltage of a Pt/Pd thermocouple when the portion of the 0.51 mm diameter Pd wire passing from the measuring junction at 321 °C to room temperature is subjected to tensile (longitudinal) stress.
Fig. 2. Crystalline structure of bulk palladium oxide (PdO). The large dark spheres represent Pd atoms, and the small light ones are oxygen atoms.
Fig. 3. Cross-sectional view of a Pd thermoelement with an oxide film. For convenience in analysis, a Pd leg composed of a single crystal is assumed, whose (001) crystalline direction is parallel to the thermocouple (z-) axis.
Fig. 4. Fractional resistance increase of the Pd RTD as a function of heat-treatment temperature [7].
Fig. 5. Schematic density of electronic states of a band transition metal. The densities of d-like states (nd) and s-like states (ns) are drawn separately.
Fig. 6. Computed electronic structure of strain-free palladium: (a) hybridized s-d bands and (b) density of electronic states. In (b), the calculated energy values in eV are Ed = 4.66, Wd =
5.64, EF = 7.04, and E0 = 7.48. For comparison, (c) is the band structure calculation of
Papaconstantopoulos [23] and (d) his corresponding density of states for Pd.
Fig. 7. Absolute Seebeck coefficient of strain-free palladium: solid circles, widely-cited values reported by Cusack and Kendall [27]; dashed line, linear fit to experimental data; solid line, model calculation. The open circles are the more recent experimental values of Laubitz and Matsumara [28].
Fig. 8. Temperature-independent part of the Seebeck coefficient plotted as a function of for five different values of . Symbols correspond to = 0.3 (x), 0.35 (·), 0.4 (+), 0.45 (o), and 0.5 (*). Note that a semi-log plot is used to differentiate points at small .
Fig. 9. The calculated change in the thermoelectric emf at the peak oxidation rate (corresponding to ~ 4.2×10⁻⁴) for several plausible choices of . The dashed line indicates
the value 1.5 V observed by Hill [7], and 1.31 V is the model calculation for = 0.38, Poisson’s ratio for single-crystal Pd.
Pd in Zn fixed point y = 25.847x 0 2 4 6 8 10 12 14 0 0.1 0.2 0.3 0.4 0.5 0.6 Load, kg E M F , V Nov. 23/2004 Nov. 30/2004
Fig. 1. Variation in the thermoelectric voltage of a Pt/Pd thermocouple when the portion of the 0.51 mm diameter Pd wire passing from the measuring junction at 420 °C to room temperature is subjected to tensile (longitudinal) stress.
Fig. 2. Crystalline structure of bulk palladium oxide (PdO). The large dark spheres represent Pd atoms, and the small light ones are oxygen atoms.
Fig. 3. Cross-sectional view of a Pd thermoelement with an oxide film. For convenience in analysis, a Pd leg composed of a single crystal is assumed, whose (001) crystalline direction is parallel to the thermocouple (z-) axis.
0 1 2 3 4 5 6 7 8 9 400 500 600 700 800 900 1000
Heat treatment temperature / °C
Fractional resistance increase x 1000 0
2 4 6 8 10 12 14 cumulative heat treatment incremental heat treatment
Fig. 4. Fractional resistance increase of the Pd RTD as a function of heat-treatment temperature [7].
Fig. 5. Schematic density of electronic states of a band transition metal. The densities of d-like states (nd) and s-like states (ns) are drawn separately.
0 2 4 6 8 10 E , e V X EF (a) 1 '25 12 X'4 X5 X2 X3 X1 0 2 4 6 8 10 E , e V X 1 '25 12 X1 X3 X2 X'4 X5 (c) 0 1 2 0 10 E, eV n (E ), e V -1 p e r a to m (b) ns nd EF Ed Wd E0 0 1 2 3 4 0 10 E, eV n (E ), e V -1 p e r a to m (d) EF
Fig. 6. Computed electronic structure of strain-free palladium: (a) hybridized s-d bands and (b) density of electronic states. In (b), the calculated energy values in eV are Ed= 4.66, Wd =
5.64, EF = 7.04, and E0 = 7.48. For comparison, (c) is the band structure calculation of
-60 -50 -40 -30 -20 -10 0 0 500 1000 1500 2000 T, K S , V ·K -1 Theory: ∂S/∂T = -0.030323 V·K-2 Expt: ∂S/∂T = -0.0303 V·K-2
Fig. 7. Absolute Seebeck coefficient of strain-free palladium: solid circles, widely-cited values reported by Cusack and Kendall [27]; dashed line, linear fit to experimental data; solid line, model calculation. The open circles are the more recent experimental values of Laubitz and Matsumara [28].
-0.0306 -0.0305 -0.0304 -0.0303 ∂S /∂ T , m V ·K -2 10-5 10-4 10-3 10-2
Fig. 8. Temperature-independent part of the Seebeck coefficient plotted as a function of for five different values of . Symbols correspond to = 0.3 (x), 0.35 (·), 0.4 (+), 0.45 (o), and 0.5 (*). A semi-log plot is used to differentiate points at small .
0 0.5 1 1.5 2 2.5 0.2 0.3 0.4 0.5 0.6 em f, V
Fig. 9. The calculated change in the thermoelectric emf at the peak oxidation rate (corresponding to ~ 4.2×10⁻⁴) for several plausible choices of . The dashed line indicates
the value 1.5 V observed by Hill [7], and 1.31 V is the model calculation for = 0.38, Poisson’s ratio for single-crystal Pd.

![Fig. 4. Fractional resistance increase of the Pd RTD as a function of heat-treatment temperature [7].](https://thumb-eu.123doks.com/thumbv2/123doknet/14146579.471192/26.892.256.658.148.487/fig-fractional-resistance-increase-rtd-function-treatment-temperature.webp)
![Fig. 7. Absolute Seebeck coefficient of strain-free palladium: solid circles, widely-cited values reported by Cusack and Kendall [27]; dashed line, linear fit to experimental data; solid line, model calculation](https://thumb-eu.123doks.com/thumbv2/123doknet/14146579.471192/29.892.254.640.142.516/absolute-seebeck-coefficient-palladium-reported-kendall-experimental-calculation.webp)