Publisher’s version / Version de l'éditeur:
Lighting Research & Technology, 41, 2, pp. 143-163, 2009-06-01
READ THESE TERMS AND CONDITIONS CAREFULLY BEFORE USING THIS WEBSITE. https://nrc-publications.canada.ca/eng/copyright
Vous avez des questions? Nous pouvons vous aider. Pour communiquer directement avec un auteur, consultez la première page de la revue dans laquelle son article a été publié afin de trouver ses coordonnées. Si vous n’arrivez pas à les repérer, communiquez avec nous à [email protected].
Questions? Contact the NRC Publications Archive team at
[email protected]. If you wish to email the authors directly, please see the first page of the publication for their contact information.
NRC Publications Archive
Archives des publications du CNRC
This publication could be one of several versions: author’s original, accepted manuscript or the publisher’s version. / La version de cette publication peut être l’une des suivantes : la version prépublication de l’auteur, la version acceptée du manuscrit ou la version de l’éditeur.
For the publisher’s version, please access the DOI link below./ Pour consulter la version de l’éditeur, utilisez le lien DOI ci-dessous.
https://doi.org/10.1177/1477153508099889
Access and use of this website and the material on it are subject to the Terms and Conditions set forth at A camera as a sensor for lighting and shading control
Newsham, G. R.; Arsenault, C. D.
https://publications-cnrc.canada.ca/fra/droits
L’accès à ce site Web et l’utilisation de son contenu sont assujettis aux conditions présentées dans le site LISEZ CES CONDITIONS ATTENTIVEMENT AVANT D’UTILISER CE SITE WEB.
NRC Publications Record / Notice d'Archives des publications de CNRC:
https://nrc-publications.canada.ca/eng/view/object/?id=f59a4313-d125-4233-bec1-424f128d2fea https://publications-cnrc.canada.ca/fra/voir/objet/?id=f59a4313-d125-4233-bec1-424f128d2fea
http://irc.nrc-cnrc.gc.ca
A Ca m e ra a s a se nsor for light ing a nd sha ding
c ont rol
N R C C - 5 0 4 5 3
N e w s h a m , G . R . ; A r s e n a u l t , C . D .
J u n e 2 0 0 9
A version of this document is published in / Une version de ce document se trouve dans:
Lighting Research & Technology, 41, (2), pp. 143-163, DOI: 10.1177/ 1477153508099889
The material in this document is covered by the provisions of the Copyright Act, by Canadian laws, policies, regulations and international agreements. Such provisions serve to identify the information source and, in specific instances, to prohibit reproduction of materials without
written permission. For more information visit http://laws.justice.gc.ca/en/showtdm/cs/C-42
Les renseignements dans ce document sont protégés par la Loi sur le droit d'auteur, par les lois, les politiques et les règlements du Canada et des accords internationaux. Ces dispositions permettent d'identifier la source de l'information et, dans certains cas, d'interdire la copie de
A Camera as a Sensor for Lighting and Shading Control
GR Newsham PhD, C Arsenault BScNational Research Council Institute for Research in Construction 1200 Montreal Rd., Ottawa, Ontario, K1A 0R6, Canada
Abstract
We developed a proof-of-concept prototype camera-based system for lighting and shading control. The system utilized a simple CMOS-based digital camera with an approximate v-lambda filter, calibrated to provide pixel luminance values up to 10,000 cd/m2. We demonstrated that the single camera sensor has the potential to replace the multiple sensors required by conventional systems for daylight harvesting, shading control, and occupancy sensing. Performance similar to conventional systems was replicated, but in additional, alternate control algorithms based on spatial luminance information were demonstrated. However, considerable further development would be required to produce a commercial version, and there may be resistance to deployment due to privacy issues. Cameras offer other potential valuable end uses, examples are fire detection and security, which could effectively subsidize the lighting control functions, making automatic lighting controls more financially attractive, and promoting energy savings.
1. Introduction
The human visual system detects spatial luminance patterns, not illuminance. One would expect that building occupant preferences for the luminous environment would be better predicted by metrics related to spatial luminance patterns than simple illuminance metrics, and there is some evidence for this1-3. However, prevailing
automatic lighting and shading control systems employ illuminance (or similar) sensors, which integrate light flux from an entire field of view. For example, almost all daylight harvesting systems use photosensors on the ceiling, calibrated to maintain desktop illuminance at a given fixed value, despite evidence that this is not what occupants choose for themselves1,3.
Part of the reason that illuminance is used for sensing is that historically illuminance has been a lot cheaper and easier to measure than luminance. Specialist spatial luminance detectors (video photometers) became available in the 1980s4. The potential to use them as advanced sensors in lighting control systems was recognised in principle5,6, but their cost and bulk presented severe practical limitations, which persist. However, recent advances in digital camera technology and high dynamic range (HDR) photography7 mean that spatial luminance information may be available from very cheap, compact devices8. Although the luminance information from such devices is not as accurate as from a specialist video photometer, it may be good enough for some control applications. In addition to controlling electric lighting and shading devices, the camera may replace an occupancy sensor/general object locator9, which could be used for building system control, management, or safety applications.
Sarkar et al.10 described the use of digital video camera to control electric lighting in response to daylight availability. The system detected luminances (up to 91 cd/m2) at
seven points in a room, and adjusted the output of four luminaires individually to best-satisfy the seven, spatially-distributed, target luminance values. A half-day trial of the system demonstrated successful functionality. The authors also described the principles of occupancy sensing using camera images.
This paper describes a laboratory-based prototype system incorporating a camera sensor for controlling electric lighting and a motorized blind. Rudimentary occupancy detection is also explored. Our goal was to further develop the proof-of-concept beyond that already described in the above literature.
2. Methods and Procedures
2.1 Office design and ambient conditions
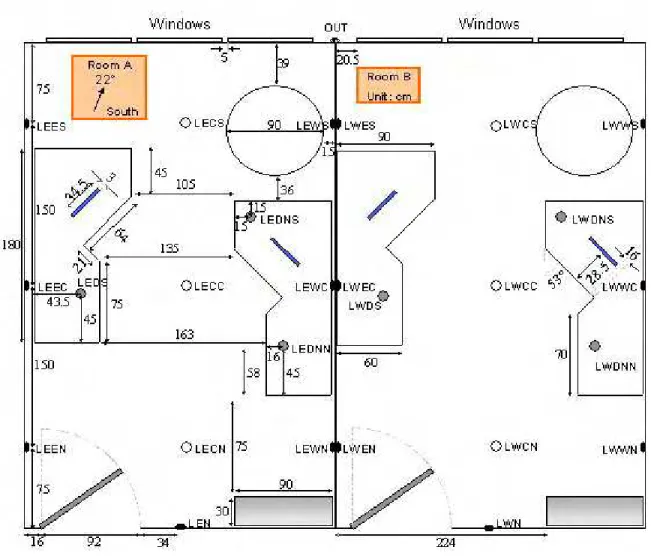
The proof-of-concept trials took place in a dedicated daylighting laboratory located in Ottawa, Canada (45o N and 76o W). The laboratory featured two identical private offices, and a control room where a researcher monitored the data collection system. The façade faced SSE (22o from true South).
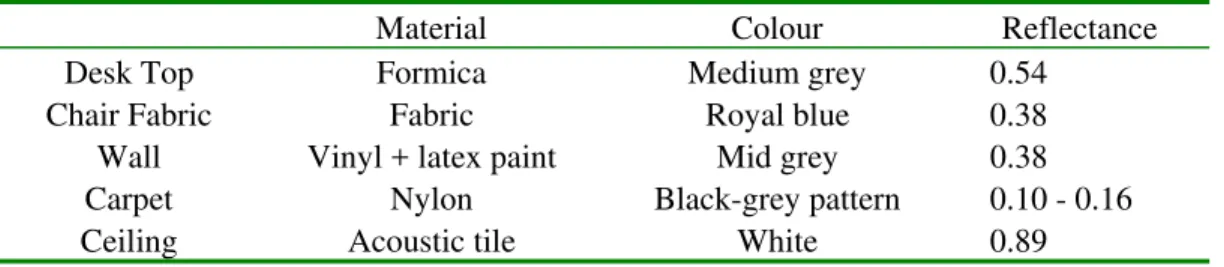
Both offices had identical double-glazed windows of conventional clear glass with a low-e coating, overall transmittance 80%. Due to some earlier work, one of the small window panes was missing from each office, resulting in a somewhat unusual shape to the glazed area. Each of the two offices was furnished as a shared office for two occupants, with desks arranged perpendicular to the window, and the main viewing direction at 45o to the window (Figure 1). Each desk had a computer and flat 15” LCD monitor (screen luminance ~140 cd/m2, measured on a white screen with window covered and no electric lighting). Table 1 summarizes the materials and reflectances of the furnishings.
The lighting system in each room consisted of four 300 x 1200 mm (1x4-foot), 2-lamp, “paracube”-louvered luminaires operated on electronic dimming ballasts with linear response by a custom lighting control system. The lamps were 32W, 3500 K, 80 CRI T8 fluorescents. When operated with identical fenestration conditions and dimming ballast outputs, the lighting conditions in the two rooms were always identical to within 3%. The maximum desktop illuminance from electric lighting alone was 740 lx, and the minimum was 50 lx.
In the initial trials in which electric lighting only was controlled, there were no shading devices. A two-element internal shading system was introduced for later trials in Room B, consisting of an upper Venetian louvre blind with manual control, and a lower, motorized, roller blind (Figure 2).
2.2 Camera and its Use in Control Function
We used a Micron MT9VO032L12STMDES camera demo kit as the sensor. This was a CMOS-based 10-bit greyscale camera, with resolution of 752 x 480 pixels.
Although the format we used was a relatively expensive development kit to facilitate custom configuration, the camera was essentially the same as the very inexpensive hardware found in cell-phones and other similar applications.
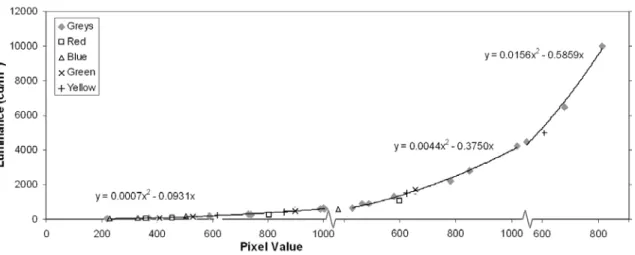
We added an approximate v-lambda filter on top of the camera lens to better match camera response to the human eye. Camera control software allowed us to fix the exposure setting manually. We then compared the camera greyscale value to the
exposure settings, covering a range up to 10,000 cd/m2, for both grey and saturated colour targets. In this comparison, a single representative pixel in the image was chosen in the same area covered by the spot luminance. The result is shown in Figure 3. We used the grey target response to generate a calibration curve for each exposure setting. For grey targets only, the mean difference between the calibration curve and the measured luminance was 7.1%; the mean for all targets was 10.7%. Noise in the system caused temporal fluctuations in luminance readings. At the low end of the luminance range, these fluctuations were around 0.3 cd/m2. These errors suggest that the camera was capable of providing acceptable luminance measurements, in the context of typical photometric errors for this type of application.
For use in the control system, the camera was placed behind the desktop on the right of Room B, and aimed towards the window (see Figure 1). Thus, the field of view included many of the elements that would be seen by an occupant of this desk. Figure 4 shows this field of view, as well as the various points and areas used for control.
In operation, the camera took an image at each of the three exposure settings. These three images were taken within a 20 second period, which minimized changes in ambient lighting due to daylight between images. The three images were part of a set, with each set of images separated by one minute, which was the shortest time between image sets possible given the required processing time with the hardware we used. Each pixel was examined for every exposure. The calibration equation for the highest
exposure that was not saturated was used to convert the greyscale value for that pixel into a luminance. Thus we generated a spatial luminance map of the space every minute, and used this luminance information to control the electric lighting and blinds in various ways.
2.3 Other photometric and Energy Measurements
Illuminance, interior and exterior temperature and humidity conditions, and lighting energy use, were recorded every minute. The locations of illuminance measurements are shown in Figure 1.
3. Results
We conducted a series of trials demonstrating the behaviour of the luminance-based (camera) controller operated in various ways. In many cases the performance and conditions in Room B, as controlled by the camera, were compared to Room A, under the control of a more conventional illuminance-based system. Results are presented for 7am – 7pm (local time), encompassing a period typical of office occupancy. Each trial encompassed one or more days. The results of each trial are presented below.
3.1 Desk Luminance vs. Desk Illuminance
We began with the most straightforward comparison of control technologies. We placed a circular, matte white spectralon reflectance standard (reflectance 99%), labelled “a” in Figure 4, next to the desktop illuminance sensor labelled “LWDNN” in Figure 1 and Figure 4. We calibrated the camera luminance for the centre of this target to the neighbouring illuminance sensor reading, based on the theoretical relationship for a Lambertian reflector of Luminance = Illuminance/π. Room B was then controlled on this luminance, while Room A was controlled on the equivalent illuminance measured by the
sensor labelled LEDNN in Figure 1. Room A control parameters were set similar to those for a conventional daylight harvesting system, to maintain desktop illuminance at 450 ± 25 lx. Room B control parameters were set to produce the same desktop
illuminance as in Room A, based on the calibration between luminance and illuminance, that is 145 ± 10 cd/m2
. To facilitate direct comparison between the control methods, control actions were initiated in both rooms once per minute. Each minute the sensor values were compared to the target values. If the sensor value was within the target range, no change in electric lighting occurred. If the sensor value was above (or below) the target range, the electric lighting dimmer was decreased (or increased) by 2%. A commercial daylight-harvesting system with an illuminance-based sensor would control continuously, and might not actuate a simple fixed step change in dimmer setting, and therefore would respond more rapidly to changing daylight conditions. Nevertheless, we think our system adequately reproduced the overall performance of an illuminance-based system, particularly under the stable skies that predominated in our study.
The results are shown in Figure 5. The data clearly show that the luminance-based sensor can mimic the performance of a desktop illuminance sensor. Over three days, one overcast and two clear sky, the mean absolute difference in desktop illuminance at sensors LWDNN and LEDNN was only 3.8%, and the mean absolute difference in measured electric lighting energy use was only 4.8%.
3.2 Desk Luminance vs. Ceiling Illuminance
This trial again used the maintenance of desktop illuminance as the goal of the control, but compared the luminance- and illuminance-based methods under more realistic conditions. Conventional illuminance-based daylight harvesting typically employs a sensor on the ceiling, calibrated to desktop illuminance; and a camera is unlikely to have a pure white, matte target on the desktop to aim at. In Room A we used a partially-shielded illuminance sensor designed to eliminate a direct view of the window by the sensor, as used by Rubinstein et al.11, in the location labelled LECC in Figure 1. Partial-shielding was recommended by Kim & Kim12 to reduce electric lighting
fluctuations in daylight harvesting systems. A simple calibration factor between desk and ceiling that works well for the full range of lighting conditions is difficult to obtain, as described by Choi & Mistrick13. We conducted calibration measurements during various daytime conditions, and at night, and decided to use a value derived from daytime
conditions with electric light output at 50%, typical of the situation of interest in this study. Daytime calibration, with daylight providing a large portion of the design light level was recommended in Choi & Mistrick13. The resulting ratio of desktop:shielded ceiling illuminance was 5.8. This yielded a control target for the Room A shielded ceiling sensor of 80 ± 5 lx.
The desk area in Room B was covered with typical office papers of various reflective properties. In this trial, the luminance over an area of this desk was used for control purposes, labelled “b” in Figure 4. A simple calibration suggested a target area luminance of 64 ± 4 cd/m2
would be appropriate for providing a desktop illuminance of 450 lx.
The results are shown in Figure 6. For these three days very little electric light contribution is required except for early morning and late afternoon. However, both control algorithms allow desktop illuminance to drop well below 450 lx. In Room A,
with the ceiling-based illuminance sensor, desktop illuminance drops as low as 220 lx, 100 lx lower than that in the camera-controlled Room B. The Room A calibration could be altered so that the minimum illuminance does not drop so low. For example,
Rubinstein et al.11 suggested a desktop:shielded ceiling illuminance ratio that varied according to the sensor signal. However, such a modification will inevitably come at greater lighting energy use. Over three days, the mean absolute difference in desktop illuminance at sensors LWDNN and LEDNN was 7.9%, and the mean absolute
difference in measured electric lighting energy use was 9.2%. Of course, in a real setting the papers on the desk in Room B would not be static over a period of days, which would present problems for calibration against desktop illuminance.
3.3 75th:25th Percentile Luminance vs. Desk Illuminance
Earlier research conducted in the same laboratory3 suggested that the ratio of the 75th percentile luminance to the 25th percentile luminance derived from all pixels in the image was a reasonable predictor of occupant preference for electric lighting. This metric has the potential practical benefit of not being based on luminance in a particular location in the image, and therefore would be potentially easier to commission in a real installation. During the daytime, the higher luminances are driven by daylight and are affected relatively little by electric light. Therefore increasing electric light has the effect of raising the lower luminances in the image, and lowering the 75th:25th ratio. Newsham
et al.3 suggested a target value for this ratio of around 3.6, however, the window
transmission in their work was much lower, around 20%. Initial trials in the current study suggested a workable control target for Room B using the camera 75th:25th ratio of 5.5 ± 0.4. This was compared to Room A using the desktop illuminance sensor with a target of 450 ± 25 lx.
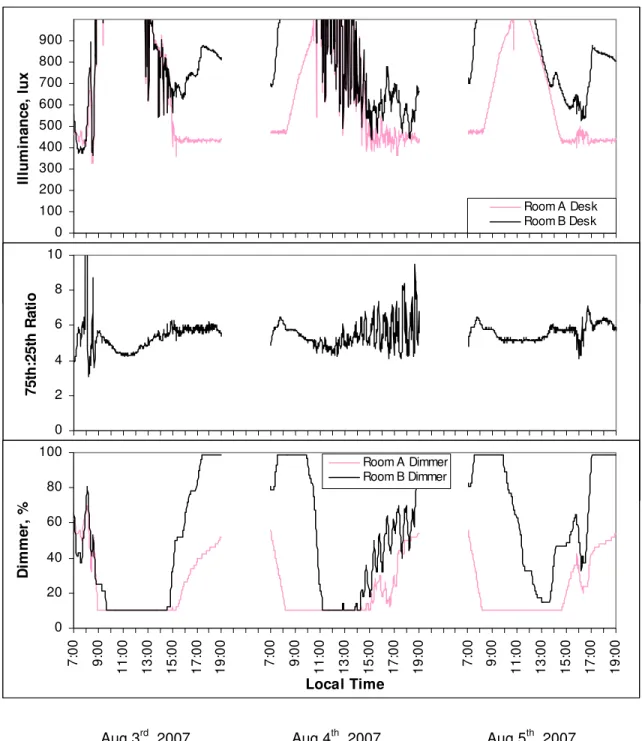
The results are shown in Figure 7. The luminance ratio target was successfully maintained under the stable skies of August 3rd and 5th, but large fluctuations were apparent under the variable sky on the afternoon of August 4th. Maintaining this luminance ratio required generally higher electric lighting output, resulting in
substantially higher illuminance levels in Room B than in the conventionally controlled Room A.
3.4 Wall Luminance vs. Desk Illuminance
A number of studies have reported office occupant preferences for wall luminance levels, independent from, or coupled with, desktop illuminance14-19; notably these studies were in spaces with little or no daylight. If indeed wall luminance is important in
determining the preferred luminous conditions, the camera-based sensor system gives us a way of controlling for it. For this trial we chose an area of wall directly behind the notional occupant’s computer screen, labelled “c” in Figure 4. In accordance with
previous research, we chose a control target for Room B using the camera mean wall area luminance of 40 ± 5 cd/m2
. This was compared to Room A using the desktop illuminance sensor with a target of 450 ± 25 lx.
The results are shown in Figure 8. On the study days the luminance of the chosen wall area was well above the control target for most of the day, and electric lighting was required to boost wall luminance late in the afternoon only. Electric lighting was
morning, and earlier in the afternoon. Therefore, in Room B, desktop illuminance fell as low as 200 lx in the late afternoon; lighting energy use in Room B was consequently considerably lower than in Room A.
3.5 Wall Luminance Ratio vs. Desk Illuminance
Recommended practice documents commonly suggest luminance ratios between surfaces. For example IESNA20 recommends that in office spaces the ratio between task and immediate surround should be no greater than 3:1 and no less than 1:3; for more remote surfaces the recommended ratio is 10:1 and 1:10. We wanted to explore this as a control criterion, but were unable to find ratios between important surfaces in our
laboratory that ever violated the above recommendations, or could be substantially manipulated by changing electric lighting levels. This might not be true in all office spaces, therefore, to demonstrate the principle, we chose the ratio of an area of interior wall near the window to a desktop area (labelled “d” and “e” in Figure 4), and aimed to maintain this no greater than 2:1 and no less than 1:2. This meant a control target for Room B using the camera and the ratio of the mean wall area luminances of 1.25 ± 0.75. This was compared to Room A using the desktop illuminance sensor with a target of 450 ± 25 lx.
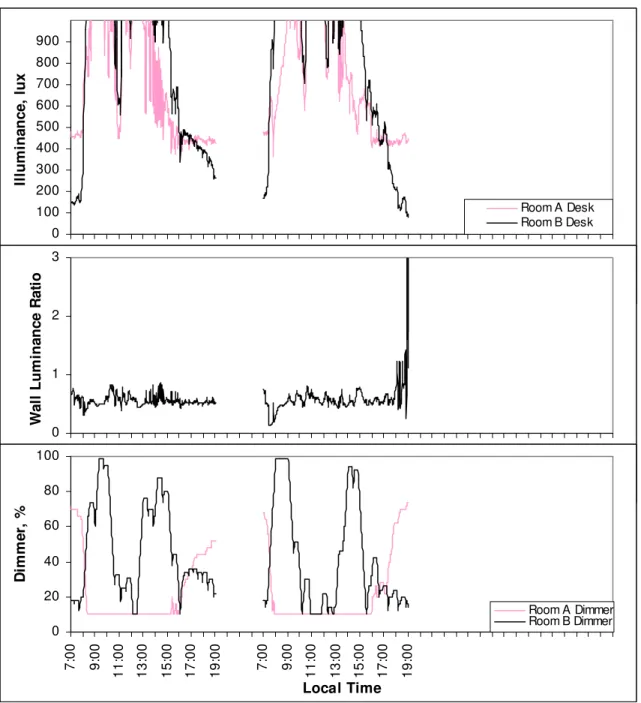
The results are shown in Figure 9; only two full days of data were collected for this trial. The target luminance ratio was maintained at the lower bound for most of the study period. However, this required considerably more electric lighting in Room B than that to maintain desktop illuminance in Room A, until mid-afternoon. In the late
afternoon, the luminance ratio was maintainable at lower electric light levels than those in the Room A. However, this meant that desktop illuminance in Room B fell to around 100 lx.
3.6 Blind Control to Counteract Glare
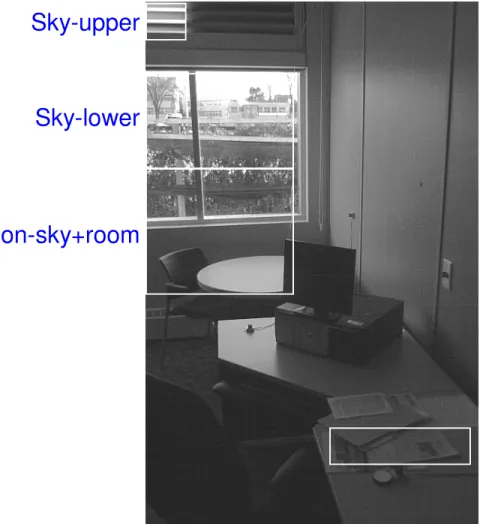
We installed a split blind system on the interior of the window in Room B (see Figure 2. The upper part of the system comprised aluminium louvres (240 x 43 cm), which could be manually tilted. The lower part of the system was a motorized perforated roller blind. The blind material itself was black and opaque, but there was an openness to the weave such that the overall blind transmission was around 2 %. The camera was repositioned and rotated so that it had a view of the notional occupant’s workspace, as well as upper and lower parts of the window. The upper louvres were set partly open, at a position that would not cause glare at the occupant location, but would still provide the camera with a small, unobstructed view of the sky. The luminance data from the camera was then used to control the position of the roller blind, with the goal of eliminating the risk of glare for the notional occupant. The areas of the image used for control and performance monitoring purposes are shown in Figure 10. The control algorithm we used was:
If time < 5am OR time >= 5pm then blinds fully down If Sky-upper luminance > 3000 cd/m2 then blind fully down
If Sky-upper luminance > 2000 cd/m2 (for 5 minutes in a row) then blind to mid position If Sky-upper luminance < 2000 cd/m2 (for 5 minutes in a row) then blind fully up
The time condition was chosen as a realistic security condition. The choice of luminance criteria for changing the blind position was based on research on triggers for blind use21,22. The mid blind position was chosen so that it blocked a view of the sky from the occupant location, but still allowed a partial view of external objects lower in the field of view. Note that even if the blind was fully down, the camera view of the louvre allowed a continuing measure of sky conditions, and thus a decision of when the blinds could be raised again.
We desired to control electric lighting and blinds simultaneously. In this case, we again used the mean luminance over a desk area covered with typical office papers for control purposes. Because the camera position was moved, the selected area wasn’t identical to that used in earlier trials. In this trial we used a target area luminance of 72 ± 4 cd/m2 with the goal of providing a desktop illuminance of 450 lx. The results are shown in Figure 11. There was no blind system in Room A, therefore the results are for Room B only, with no comparison to Room A.
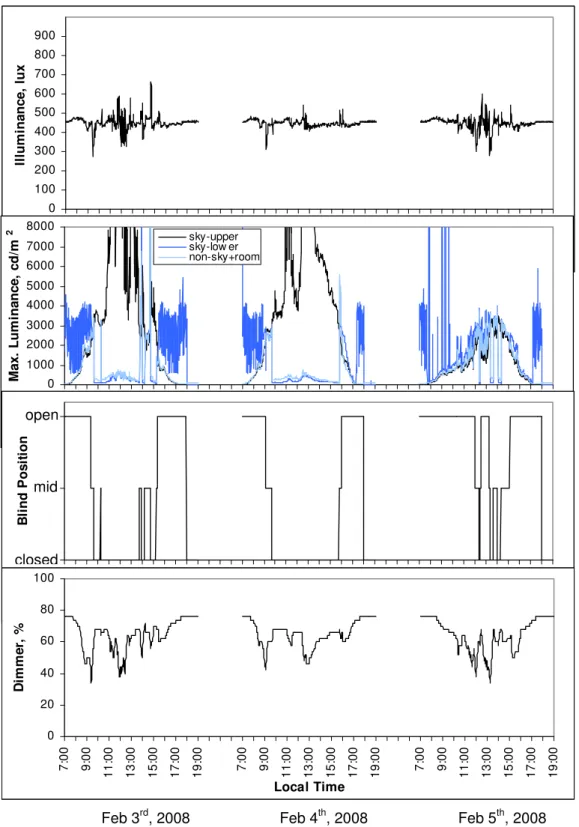
The combination of blind and electric lighting control was very successful at maintaining the desired desktop illuminance level within a relatively small range (mean = 448 lx, s.d. = 28 lx) throughout occupancy; in earlier trials without blinds illuminance rose above 900 lx in the middle of the day. The luminance of the sky seen through the upper louvers (Sky-upper) shows that the first two days of this trial were generally clear, though not perfectly stable, whereas the third day was almost uniformly overcast. As a result, the roller blind was deployed much less on the third day. Nevertheless, under both types of skies, the maximum luminance in the field of view of the notional occupant was successfully controlled below the target range of 2,000-3,000 cd/m2. Note, there are many occasions when the maximum luminance in the lower part of the window (Sky-lower) is > 3,000 cd/m2 in early morning, or late afternoon. This was due to reflections of low-angle sunlight from external objects such as windows, car mirrors, or ice.
However, the area of these high luminances was very small; the number of camera pixels in this area was 30240, and the number of pixels > 2,000 cd/m2 was typically less than 10. There were also periods during the first two days when the blind was raised when the luminance in the lower parts of the field of view (Non-sky+room) was higher than the target range. The area covered by the high luminance area was typically less than 15%, which is small but not trivial, but the time periods involved were very brief. The excellent glare control overall does mean that daylight harvesting potential is reduced compared to earlier trials (see Figure 6, for example). The overall energy saving compared to a fixed system providing 450 lx electric light on the desktop (or a daylight harvesting system where a blind is manually closed all the time) was 10.7%, although savings as great as 50% were achieved at some times of the study days.
3.7 Occupancy Sensor
In the final phase of the research, we aimed to demonstrate that the camera could also function as an occupancy sensor. This was done in Room B only. For this initial demonstration we fixed the window blinds in the closed position to virtually exclude all daylight; electric lighting could be set in one of two positions: on providing ~ 475 lx on the desktop, or on at a minimum level, providing ~ 50 lx on the desktop.
To determine occupancy, we used a simple image subtraction technique, similar to that proposed by Sarkar et al.10 and Augdal6. Images from consecutive minutes were
compared. First, the luminance on a white reflectance standard on the desktop was compared in both images, and the ratio of the luminance at this location in the second image to the first image was calculated; this ratio was then applied to all pixel luminances in the first image to calibrate for any general changes in light level from
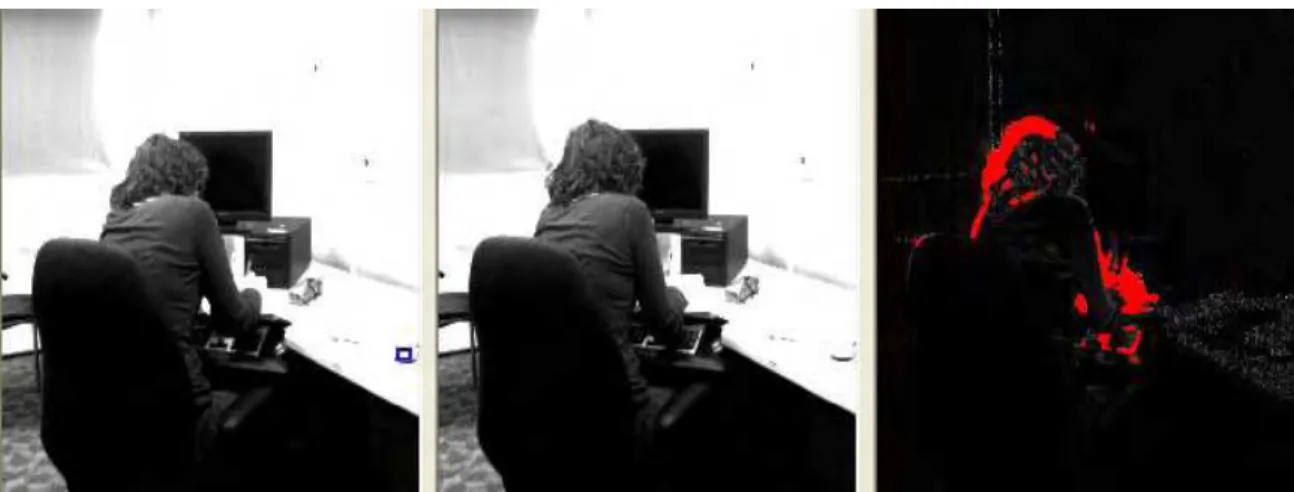
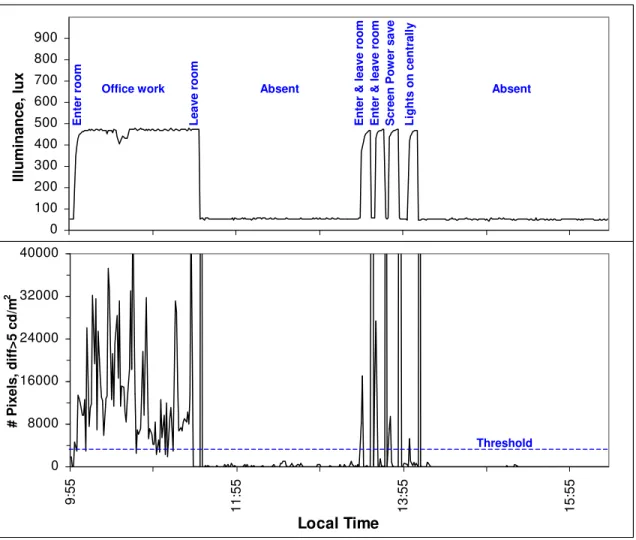
minute-to-minute. Second, we applied a simple upper luminance limiter such that luminances in both images greater than 255 cd/m2 were set to 255 cd/m2. Third, the individual pixel luminances in the second image were subtracted from those in the first image. Fourth, the number of pixels where the luminance difference was greater than 5 cd/m2 was tallied. Two images separated in time by one minute, and the result of the image subtraction, are shown in Figure 12. If the number of pixels where the difference was greater than 5 cd/m2 was greater than 4,000 then the room was considered occupied; a pixel count less than 4,000 indicated no occupancy. To protect against false-offs, we required five consecutive minutes of no occupancy before the lights were switched to minimum. However, following a period of no occupancy, a single occupancy signal would bring the electric lights back up again.
Figure 13 shows a six-hour period illustrating examples of system functionality. The lights were brought up when the occupant initially occupied the room. For the following ~ 90 minutes the occupant conducted a variety of typical office tasks. Such movement kept the pixel count above the threshold for most minutes. The pixel count did fall below the threshold occasionally, but not for the five-minute continuous period required to switch the lights. The occupant then left the room, and five minutes later the lights were reduced to minimum. Note, the act of switching the lights itself generated a large difference in consecutive images, however, the system was programmed to
recognise this, and not to consider a reduction of light level in this manner as indicating occupancy. In the afternoon, the occupant briefly entered the room twice. On both occasions the system registered the occupancy and brought the light level up, and then five minutes later, after no occupancy, brought the light level down again. Following this, with the occupant absent, the computer screen power saver switched off the computer screen. The number of pixels that thus experienced a large change in
luminance was great enough for the system to interpret this (falsely) as occupancy, and the electric light level was raised. Again, five minutes later, with no occupancy or
change in the computer screen luminance, the lights were reduced to minimum. The next event was a signal from outside the room to increase the light level to 475 lx (manual electric lights on at 75% output). Five minutes later, with no occupancy, the lights were again reduced to minimum. For the remainder of the afternoon there was no occupancy and the lights remained at their minimum level.
4. Discussion
Overall, the results demonstrated that a single, basic CMOS camera chip has the potential to replace the multiple sensors required by conventional systems for daylight harvesting, shading control, and occupancy sensing. As stated in the Introduction, the concept of using a camera for lighting control functions in not a new one. However, the work described in this is paper clearly takes this concept substantially further than previously demonstrated. For example, Glennie et al.5 introduced the concept in a very expensive form. They articulated the idea of controlling electric lighting scenes in a non-daylit room based on room surface luminances, and occupancy based on image
subtraction, but no actual performance data were presented. Augdal6 suggested a theoretical system to control multiple luminaires to improve luminance uniformity, and occupancy detection based on image subtraction was also discussed. Again, no actual performance data were presented. Sarkar et al.10 described a video system used to control multiple lighting circuits in a non-daylit room with the goal of maintaining luminance on multiple room surfaces. Performance data were presented, but for a few hours only. Occupancy detection based on image subtraction was introduced, but actual performance data were not presented. Therefore, our work takes the concept forward in several ways: 1. Demonstrated use of a camera-based system in a daylit setting, and for daylight harvesting.
2. Demonstrated use to control a motorized blind as well as electric lighting 3. Exploration of alternative control algorithms beyond constant luminance 4. Presentation of performance data over one or more full days
5. Demonstration of a working, though limited, occupancy sensor function We clearly demonstrated that alternate control algorithms based on spatial
luminance information can be employed that are not possible with conventional sensors. For example, we controlled lighting output based on wall luminance levels or luminance ratios between important surfaces. The alternative strategies we demonstrated were based on published human factors studies suggesting that these alternatives better represent occupant preference than the traditional control criterion of desktop
illuminance. However, we did not conduct new human factors studies in our work, due to resource limitations. Combinations of several criteria could also be employed using optimization routines, although such techniques were not attempted in this study. More research is certainly needed to confirm whether such alternative algorithms would be beneficial to occupants, and to elucidate the energy implications. We hope this paper will encourage others to conduct such research.
Each trial involving daylight encompassed two or more days. Obviously, detailed performance will differ under different sky conditions, latitudes, building orientations, and seasons. Examining performance over such a wide range of daylighting conditions was not in the scope of our study, but should be addressed in future development of a camera-based control system.
The occupancy sensing algorithm we used was successful, but only in a limited context: daylight was excluded from the space. Large fluctuations in daylight would be expected to disrupt the simple image subtraction technique we employed, a complication also recognized by Sarkar et al.10. In addition, we expect that the thresholds we used (to determine if a pixel had changed, and how many pixel changes indicated occupancy) would be situationally dependent, although it might be possible for the thresholds to be dynamic, and reliably related to measured properties of the image. Despite these limitations, our demonstration of the occupancy sensor function has value. As stated above, previous papers have talked about the concept of image subtraction in principle, but did not demonstrate it in even a severely limited case. We hope that our simple example will inspire others to work on the problem of generalizability. In fact, Mahdavi
et al.9 describe a camera-based occupancy detection system to detect motion independent
The mandate of our study was to develop a proof-of-concept only, considerable further work would be required to optimize the system for commercial application. In addition to the issues above, the system would have to operate much faster, one minute between images (and therefore control actions) would not be acceptable in some situations. This is particularly true for an occupancy sensor that is expected to switch lights on as well as off; however, a manual on/automatic off configuration would operate without concern at the current system speed. Also, several of the control algorithms we described are specific to particular room locations. This implies a detailed
commissioning procedure, with location descriptions unique to each space. A method of detecting particular object types in the image would be desirable to facilitate this.
Additional work should also explore the sensitivity of system performance to camera characteristics such as field of view, aiming, resolution, and dynamic range.
One potential major drawback is privacy, one could expect considerable resistance from occupants to having a camera in their workspace, no matter what the benefits for visual comfort and energy use. Sarkar et al.10 suggest designing the sensor so that it does not resemble a conventional camera. They also note that, for lighting control purposes, there is no need to store the image, only a few control metrics derived from pixel luminance values are used; this knowledge might allay privacy fears.
For this proof-of-concept to be further developed towards a commercial
application requires the promise of tangible performance and cost benefits compared to incumbent technologies. In general terms, the only elements of a lighting control system that are replaced by the proof-of-concept are the sensors, other wiring, controller,
software, and set-up costs can be expected to be similar. The current commercial price for quality photosensors and occupancy sensors may still exceed $150 each, even in volume. The camera we used was of the type packaged inside cell-phones, with the entire phone costing $100 and up, so it is unlikely that a similar camera package for lighting control would cost more than a single photosensor or occupancy sensor. Note also that a single camera can support several lighting control functions (daylight harvesting, blind control, occupancy sensing) and can therefore replace multiple
conventional sensors. There are potential performance benefits too, by providing control functions based on spatial luminance information: prior research suggests this might better align with occupant preference. Further, camera-based sensors offer other
applications. For example, there are image processing techniques for fire detection23-24. There are also potential applications in safety and security, for determining if a building evacuation is complete, or the location of an intruder, for example. These other
applications may subsidize the lighting control functions in a way not possible with conventional lighting control systems. This would further enhance the cost-benefit equation, and facilitate an increase in market penetration for energy-saving lighting technology.
5. Conclusions and Implications for Practice
A single, basic digital camera has the potential to replace the multiple sensors required by conventional systems for daylight harvesting, shading control, and occupancy sensing. However, our research generated a proof-of-concept system only, and was demonstrated in a single space. Considerable optimization is necessary for a commercially-viable system. Further, important privacy concerns associated with
cameras in building interiors remain to be addressed. Nevertheless, camera-based sensors have applications in other areas that could effectively subsidize the cost of automatic lighting controls, and dramatically reduce payback times.
Acknowledgements
This work was financially supported by the Climate Change Plan for Canada, Technology and Innovation R&D Initiative, and the National Research Council. The authors would like to extend their thanks to Roger Marchand for his technical
development of the experimental space. This work was part of a collaboration with Francis Rubinstein of Lawrence Berkeley National Laboratory, and we are also grateful to Steve Selkowitz for facilitating this collaboration. We have also collaborated with Jens Christoffersen of the Danish Building Research Institute in the development of this work. We are also indebted to Micron Technology Inc. (Ed Jakl, Joe Camilleri, Paul Gallagher), Somfy Canada (George Strickland), and Sun Project Toro (Luca Giovannoni) who supported the project in various ways. Finally, we are grateful for the continuing support of our Director, Morad Atif (NRC).
References
1 Halonen L, Lehtovaara J. Need of individual control to improve daylight utilization and user satisfaction in integrated lighting systems. In Proceedings of the 23rd session
of the CIE, New Delhi, India, 1995: 200-203.
2 Wienold J, Christoffersen J. Evaluation methods and development of a new glare prediction model for daylight environments with the use of CCD camera. Energy and
Buildings 2006; 38(7): 743-757.
3 Newsham GR, Aries M, Mancini S, Faye G. Individual control of electric lighting in a daylit space. Lighting Research and Technology 2008; 40 (1), 25-41. URL:
http://irc.nrc-cnrc.gc.ca/pubs/fulltext/nrcc49453/
4 Rea MS, Jeffrey IG. A new luminance and image analysis system for lighting and vision. Journal of the Illuminating Engineering Society 1990; 19(1): 64-72.
5 Glennie WL, Thukral I, Rea MS. Lighting control: feasibility demonstration of a new type of system. Lighting Research and Technology 1992; 24(4): 235-242.
6 Augdal A. Using a CCD camera as a sensor for indoor lighting control. SINTEF Report TR A5017, Trondheim, Norway, 1999.
7 Reinhard E, Ward G, Pattanaik S, Debevec P. High Dynamic Range Imaging:
Acquisition, display and Image-Based Lighting. Morgan Kaufman, Amsterdam, the
Netherlands, 2006.
8 Sarkar A, Mistrick RG. A novel lighting control system integrating high dynamic range imaging and DALI. Leukos 2006; 2(4): 307-322.
9 Mahdavi A, Icoglu O, Camara S. Vision-based location sensing and self-updating information models for simulation-based building control strategie. In Proceedings of
IBPSA, 10th Building Simulation Conference, Beijing, China; 2007: 1291-1298.
10 Sarkar A, Fairchild M, Salvaggio C. Integrated daylight harvesting and occupancy detection using digital imaging. In Proceedings of SPIE (International Society for Optical Engineering) Volume: 6816; Sensors, Cameras, and Systems for
11 Rubinstein F, Ward G, Verderber R. Improving the performance of photo-electrically controlled lighting systems. Journal of the Illuminating Engineering Society 1989; 18(1): 70-94.
12 Kim S-Y, Kim J-J. The impact of daylight fluctuation on a daylight dimming control system in a small office. Energy and Buildings 2007; 39(8): 935-944.
13 Choi A, Mistrick RG. On the prediction of energy savings for a daylight dimming system. Journal of the Illuminating Engineering Society 1997; 26(2): 77-90.
14 Newsham GR, Richardson C, Blanchet C, Veitch JA. Lighting quality research using rendered images of offices. Lighting Research & Technology 2005; 37(2): 93-115. 15 Loe DL, Mansfield KP, Rowlands E. Appearance of lit environment and its relevance
in lighting design: experimental study. Lighting Research & Technology 1994; 26(3): 119-133.
16 Veitch JA, Newsham GR. .Preferred luminous conditions in open-plan offices: research and practice recommendations. Lighting Research & Technology 2000; 32(4): 199-212. URL: http://irc.nrc-cnrc.gc.ca/pubs/fulltext/nrcc43061/
17 Berrutto V, Fontoynont M, Avouac-Bastie P. Importance of wall luminance on users satisfaction: pilot study on 73 office workers. In Proceedings of Lux Europa – 8th
European Lighting Conference, Amsterdam, 1997: 82-101.
18 Van Ooyen MHF, van de Weijgert JAC, Begemann SHA. Preferred luminances in offices. Journal of the Illuminating Engineering Society 1987; 16(2): 152-156. 19 Goven T, Bangens L, Persson B. Preferred luminance distribution in working areas.
In Proceedings of Right Light 5, Nice, France, 2002: 87-92.
20 IESNA. Lighting handbook 9th edition, New York, NY, USA: Illuminating Engineering Society of North America, 2000: 11-3.
21 Clear RD, Inkarojrit V, Lee ES. Subject responses to electrochromic windows.
Energy and Buildings 2006; 38(7): 758-779.
22 Christoffersen J, Wienold J. Monitoring Procedure for assessment of user reaction to
glare. Report ECCO-DBUR-0303-01, Energy and Comfort Control for Building
management systems (ECCO-Build), EU Commission (Contract No: ENK6-CT-2002-00656), 2005.
23 Celik T, Demirel H, Ozkaramanli, H, Uyguroglu M. Fire detection using statistical color model in video sequences. Journal of Visual Communication & Image
Representation 2007; 18(2): 176-185.
24 Cheong K-H, Ko B-C, Nam J-Y. Automatic fire detection system using CCD camera and Bayesian network. In Proceedings of SPIE (International Society for Optical Engineering) Volume: 6813; Image Processing: Machine Vision Applications, 2008: 68130S-68130S-12.
Table 1 Room surface materials and reflectances
Material Colour Reflectance
Desk Top Formica Medium grey 0.54 Chair Fabric Fabric Royal blue 0.38 Wall Vinyl + latex paint Mid grey 0.38 Carpet Nylon Black-grey pattern 0.10 - 0.16
Figure 1 Plan of daylighting lab test rooms, all measurements are in centimeters. The grey circles show horizontal illuminance sensors at desk level (h=75cm), the white circles show ceiling mounted illuminance sensors, the black ovals show illuminance sensors vertically mounted on the interior (h=119cm) and exterior (h=340cm) walls. Each of these sensors is uniquely identified by
Figure 2 The two-element internal shading system was introduced for later trials in Room B, consisting of an upper Venetian blind with
manual control, and a lower, motorized, opaque roller blind
Figure 3 The calibration curve for the digital camera with the approximate v-lambda filter. Camera pixel values are plotted vs. luminance (of targets measured with a calibrated spot meter)
for three different, fixed exposures, and targets of various colours. Equations show the best-fit quadratic curves at each exposure, for the greyscale targets
Figure 4 View of Room B from the perspective of the camera used for control. Superimposed are the points/areas used for control criteria in the early trials. (LWDNN) is the desktop illuminance sensor; (a) is the reflectance standard; (b) is the desk area; (c) is the wall area behind
the computer from the occupant perspective; (d) is the wall area near the window; (e) is an alternate desk area used for a ratio with area (d). Note, when the camera was used to control the
motorized blind, the field of view was changed slightly to incorporate the upper part of the window
0 100 200 300 400 500 600 700 800 900 7: 00 9: 00 11 :0 0 13 :0 0 15 :0 0 17 :0 0 19 :0 0 7: 00 9: 00 11 :0 0 13 :0 0 15 :0 0 17 :0 0 19 :0 0 7: 00 9: 00 11 :0 0 13 :0 0 15 :0 0 17 :0 0 19 :0 0 Local Time Illu min a n c e , lu x Room A Desk Room B Desk 0 20 40 60 80 100 7: 00 9: 00 11 :0 0 13 :0 0 15 :0 0 17 :0 0 19 :0 0 7: 00 9: 00 11 :0 0 13 :0 0 15 :0 0 17 :0 0 19 :0 0 7: 00 9: 00 11 :0 0 13 :0 0 15 :0 0 17 :0 0 19 :0 0 Local Time D imme r, % Room A Dimmer Room B Dimmer
July 20th, 2007 July 21st, 2007 July 22nd, 2007
Figure 5 Three-day comparison of desktop illuminance and electric lighting dimmer setting. In Room A an illuminance sensor on the desktop was used as a sensor to maintain 450 ± 25 lx on
the desktop; In Room B the camera was used as a sensor to maintain the luminance of a white target on the desktop at 145 ± 10 cd/m2
0 100 200 300 400 500 600 700 800 900 7: 00 9: 00 11 :0 0 13 :0 0 15 :0 0 17 :0 0 19 :0 0 7: 00 9: 00 11 :0 0 13 :0 0 15 :0 0 17 :0 0 19 :0 0 7: 00 9: 00 11 :0 0 13 :0 0 15 :0 0 17 :0 0 19 :0 0 Local Time Illu min a n c e , lu x Room A Desk Room B Desk 0 20 40 60 80 100 7: 00 9: 00 11 :0 0 13 :0 0 15 :0 0 17 :0 0 19 :0 0 7: 00 9: 00 11 :0 0 13 :0 0 15 :0 0 17 :0 0 19 :0 0 7: 00 9: 00 11 :0 0 13 :0 0 15 :0 0 17 :0 0 19 :0 0 Local Time D imme r, % Room A Dimmer Room B Dimmer
Sept 17th, 2007 Sept 18th, 2007 Sept 19th, 2007
Figure 6 Three-day comparison of desktop illuminance and electric lighting dimmer setting. In Room A, a shielded illuminance sensor on the ceiling was used as a sensor to maintain 80 ± 5 lx on the ceiling; In Room B the camera was used as a sensor to maintain the luminance of a typical
desk area at 64 ± 4 cd/m2
; both target values were chosen to corresponded to 450 lx on the desktop
0 100 200 300 400 500 600 700 800 900 7: 00 9: 00 11 :0 0 13 :0 0 15 :0 0 17 :0 0 19 :0 0 7: 00 9: 00 11 :0 0 13 :0 0 15 :0 0 17 :0 0 19 :0 0 7: 00 9: 00 11 :0 0 13 :0 0 15 :0 0 17 :0 0 19 :0 0 Local Time Illu min a n c e , lu x Room A Desk Room B Desk 0 2 4 6 8 10 7: 00 9: 00 11 :0 0 13 :0 0 15 :0 0 17 :0 0 19 :0 0 7: 00 9: 00 11 :0 0 13 :0 0 15 :0 0 17 :0 0 19 :0 0 7: 00 9: 00 11 :0 0 13 :0 0 15 :0 0 17 :0 0 19 :0 0 Local Time 7 5 th :25 th R a ti o 0 20 40 60 80 100 7: 00 9: 00 11 :0 0 13 :0 0 15 :0 0 17 :0 0 19 :0 0 7: 00 9: 00 11 :0 0 13 :0 0 15 :0 0 17 :0 0 19 :0 0 7: 00 9: 00 11 :0 0 13 :0 0 15 :0 0 17 :0 0 19 :0 0 Local Time D imme r, % Room A Dimmer Room B Dimmer
Aug 3rd, 2007 Aug 4th, 2007 Aug 5th, 2007
Figure 7 Three-day comparison of desktop illuminance, luminance ratio, and electric lighting dimmer setting. In Room A an illuminance sensor on the desktop was used as a sensor to maintain 450 ± 25 lx on the desktop; In Room B the camera was used as a sensor to maintain the
0 100 200 300 400 500 600 700 800 900 7: 00 9: 00 11 :0 0 13 :0 0 15 :0 0 17 :0 0 19 :0 0 7: 00 9: 00 11 :0 0 13 :0 0 15 :0 0 17 :0 0 19 :0 0 7: 00 9: 00 11 :0 0 13 :0 0 15 :0 0 17 :0 0 19 :0 0 Local Time Illu min a n c e , lu x Room A Desk Room B Desk 0 40 80 120 160 200 7: 00 9: 00 11 :0 0 13 :0 0 15 :0 0 17 :0 0 19 :0 0 7: 00 9: 00 11 :0 0 13 :0 0 15 :0 0 17 :0 0 19 :0 0 7: 00 9: 00 11 :0 0 13 :0 0 15 :0 0 17 :0 0 19 :0 0 Local Time W a ll L u m in a n c e , c d /m 2 0 20 40 60 80 100 7: 00 9: 00 11 :0 0 13 :0 0 15 :0 0 17 :0 0 19 :0 0 7: 00 9: 00 11 :0 0 13 :0 0 15 :0 0 17 :0 0 19 :0 0 7: 00 9: 00 11 :0 0 13 :0 0 15 :0 0 17 :0 0 19 :0 0 Local Time D imme r, % Room A Dimmer Room B Dimmer
July 25th, 2007 July 26th, 2007 July 27th, 2007
Figure 8 Three-day comparison of desktop illuminance, wall luminance and electric lighting dimmer setting. In Room A an illuminance sensor on the desktop was used as a sensor to maintain 450 ± 25 lx on the desktop; In Room B the camera was used as a sensor to maintain the
0 100 200 300 400 500 600 700 800 900 7: 00 9: 00 11 :0 0 13 :0 0 15 :0 0 17 :0 0 19 :0 0 7: 00 9: 00 11 :0 0 13 :0 0 15 :0 0 17 :0 0 19 :0 0 Local Time Illu min a n c e , lu x Room A Desk Room B Desk 0 1 2 3 7: 00 9: 00 11 :0 0 13 :0 0 15 :0 0 17 :0 0 19 :0 0 7: 00 9: 00 11 :0 0 13 :0 0 15 :0 0 17 :0 0 19 :0 0 Local Time W a ll L um ina nc e R a ti o 0 20 40 60 80 100 7: 00 9: 00 11 :0 0 13 :0 0 15 :0 0 17 :0 0 19 :0 0 7: 00 9: 00 11 :0 0 13 :0 0 15 :0 0 17 :0 0 19 :0 0 Local Time D imme r, % Room A Dimmer Room B Dimmer Aug 11th, 2007 Aug 12th, 2007
Figure 9 Two-day comparison of desktop illuminance, wall luminance ratio, and electric lighting dimmer setting. In Room A an illuminance sensor on the desktop was used as a sensor to maintain 450 ± 25 lx on the desktop; In Room B the camera was used as a sensor to maintain the
ratio of the luminance of the wall near the window to the luminance of a desktop area at 1.25 ± 0.75
Sky-upper
Sky-lower
Non-sky+room
Figure 10 The split-blind system used in later trials, from the perspective of the control camera. Also shown are the various image areas used for control and performance monitoring purposes
0 100 200 300 400 500 600 700 800 900 7: 0 0 9: 0 0 11 :00 13 :00 15 :00 17 :00 19 :00 7: 0 0 9: 0 0 11 :00 13 :00 15 :00 17 :00 19 :00 7: 0 0 9: 0 0 11 :00 13 :00 15 :00 17 :00 19 :00 Local Time Illu min a n c e , lu x
Feb 3rd, 2008 Feb 4th, 2008 Feb 5th, 2008
Figure 11 Three-day recording of desktop illuminance, maximum luminance in the field of view, roller blind position, and electric lighting dimmer setting. In B the camera was used as a sensor to maintain the luminance of a desktop area at 72 ± 4 cd/m2
, chosen to correspond to 450 lx, and to limit luminance in the field of view below 2,000-3,000 cd/m2
0 1000 2000 3000 4000 5000 6000 7000 8000 9: 00 11 :00 13 :00 15 :00 17 :00 19 :00 7: 00 9: 00 11 :00 13 :00 15 :00 17 :00 19 :00 7: 00 9: 00 11 :00 13 :00 15 :00 17 :00 19 :00 Local Time M ax. L u m in an ce , cd /m 2 sky-upper sky-low er non-sky+room 7: 00 0 1 7: 00 9: 00 11 :00 13 :00 15 :00 17 :00 19 :00 7: 00 9: 00 11 :00 13 :00 15 :00 17 :00 19 :00 7: 00 9: 00 11 :00 13 :00 15 :00 17 :00 19 :00 Local Time B li nd P os it ion 2 open mid closed 0 20 40 60 80 100 7: 00 9: 00 11 :00 13 :00 15 :00 17 :00 19 :00 7: 00 9: 00 11 :00 13 :00 15 :00 17 :00 19 :00 7: 00 9: 00 11 :00 13 :00 15 :00 17 :00 19 :00 Local Time D imme r, %
Figure 12 An example of the image subtraction technique for occupancy sensing. The images to
sub in
the left and in the middle were taken one minute apart. The area of the reflectance standard used for image calibration is shown by the blue square on the left. To the right is the result of
tracting the two images. Pixels where the difference was greater than 5 cd/m2 are shown red. Even small changes in body/object positions are clearly captured
0 100 200 300 400 500 600 700 800 900 9:55 11:55 13:55 15:55 Local Time Illuminance, lux Enter room Le av e room
Office work Absent
Enter & leav
e room
Enter & leav
e room Scre en Po w e r s a v e Lig h ts on c e ntra ll y Absent 0 8000 16000 24000 32000 40000 9:55 11:55 13:55 15:55 Local Time # Pixels, diff>5 cd/m 2 Threshold
Figure 13 A six-hour trial of the occupancy sensor system, showing the number of pixels above the threshold luminance difference, and the desktop illuminance in the room. Activity in the