HAL Id: hal-00454477
https://hal.archives-ouvertes.fr/hal-00454477
Submitted on 8 Feb 2010HAL is a multi-disciplinary open access archive for the deposit and dissemination of sci-entific research documents, whether they are pub-lished or not. The documents may come from teaching and research institutions in France or abroad, or from public or private research centers.
L’archive ouverte pluridisciplinaire HAL, est destinée au dépôt et à la diffusion de documents scientifiques de niveau recherche, publiés ou non, émanant des établissements d’enseignement et de recherche français ou étrangers, des laboratoires publics ou privés.
and its effect on SAR Radar Signal Backscattered over
Soil Surface
M. Zribi, A. Le Morvan, N. Baghdadi
To cite this version:
M. Zribi, A. Le Morvan, N. Baghdadi. Dielectric constant modelling with soil-air composition and its effect on SAR Radar Signal Backscattered over Soil Surface. Sensors, MDPI, 2008, 15 p. �hal-00454477�
sensors
ISSN 1424-8220
www.mdpi.com/journal/sensors Article
Dielectric Constant Modelling with Soil–Air Composition and
Its Effect on Sar Radar Signal Backscattered over Soil Surface
Mehrez Zribi 1, 2,*, Aurélie Le Morvan 1 and Nicolas Baghdadi 3
1
CETP/IPSL/CNRS, 10-12 av. de l'Europe, 78140 Vélizy, France 2
IRD-CESBIO, 18 av. Edouard Belin, bpi 2801, 31401 Toulouse cedex 9, France 3
CEMAGREF, UMR TETIS, 500 rue François Breton, 34093 Montpellier cedex 5, France * Author to whom correspondence should be addressed; E-mail: zribi@cetp.ipsl.fr;
Tel.: 33 1 39 25 48 23; Fax: 33 1 39 25 49 22,
Received: 16 July 2008; in revised form: 27 August 2008 / Accepted: 29 October 2008 / Published: 1 November 2008
Abstract: The objective of this paper is to present the contribution of a new dielectric
constant characterisation for the modelling of radar backscattering behaviour. Our analysis is based on a large number of radar measurements acquired during different experimental campaigns (Orgeval’94, Pays de Caux’98, 99). We propose a dielectric constant model, based on the combination of contributions from both soil and air fractions. This modelling clearly reveals the joint influence of the air and soil phases, in backscattering measurements over rough surfaces with large clods. A relationship is established between the soil fraction and soil roughness, using the Integral Equation Model (IEM), fitted to real radar data. Finally, the influence of the air fraction on the linear relationship between moisture and the backscattered radar signal is discussed.
Keywords: dielectric constant, radar, moisture, modelling
I. Introduction
Soil moisture and roughness parameters play a key role in hydrological and climate studies. Considerable effort has been devoted to the study of radar backscattering responses from natural surfaces, in active microwave remote sensing [1-5]. Firstly, electromagnetic backscattering models (Kirchoff models, the small perturbation Model) [1] and more recently, the Integral Equation Model
(IEM, [6]) have been used in order to estimate these parameters. However, different experimental measurements have shown that their use should be restricted to smooth or medium-rough surfaces. For example, the Small Perturbation Model (SPM) is valid only for very smooth soils, IEM shows a validity domain with k s<1.3 (k: wave number, s: rms height [7]). In practice, it is still difficult to identify a single model with a large domain of validity, for real agricultural soils, in spite of the improvements achieved over the past few years [8, 9]. An approach, based in the parameterisation of a correlation length function of the rms height, has been proposed in order to improve the fit of IEM to real radar data in different configurations [4, 5, 10]. Various improvements have been achieved in the description of roughness, by introducing multi-scale approaches [11, 12], generalized power law spectra [13], and by introducing new parameters such as the Zs index [3]. However, even with these improvements, discrepancies are still observed for medium or high degrees of roughness [14].
Secondly, past experimental studies have been designed to estimate surface moisture only, by adding different hypotheses to the surface roughness description. A linear relationship between surface moisture and backscattered radar signals has been proposed [1]. This approach was validated by a large number of experimental studies [15, 16]. It is generally considered to be a valid approximation for a given studied site. However, the coefficients needed to describe the linear relationship often vary from one watershed to another and also from one year to another, and thus need to be calibrated [16, 17]. For this reason, it is still very difficult to use this relationship for radar signal inversion, without making a considerable effort to obtain correct calibration of the coefficients.
In general, for agricultural soils with rough surfaces, we observe clods with a large air fraction between them. This air fraction is not taken into account when estimating the dielectric constant. In fact, with the gravimetric approach, and thetaprobe or TDR measurements, we neglect this effect and analyse the soil fraction only. In the present study, we propose a new modelling process for the dielectric constant, in order to include the effects of the air fraction. Our calculation of the dielectric constant is based on the assumption of a composite ground, with both soil and air fractions. Section 2 describes the experimental data used for this work, recorded during three experimental campaigns (Orgeval'94, Pays de Caux’98, Pays de Caux’99). Section 3 describes IEM modelling, using dielectric constant modelling based on the introduction of both “air” and “soil” phases. It presents an analysis of the relationship between soil fraction and radar signal behaviour, and its influence on the relationship between radar signal and soil moisture. Finally, our conclusions are presented in Section 4.
II. Experimental campaigns
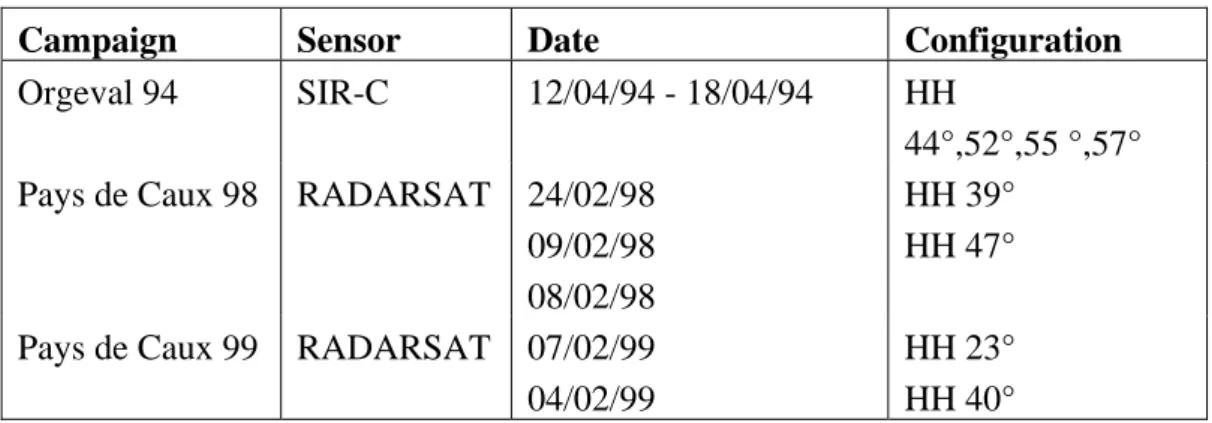
In this study, data was acquired during three experimental campaigns (Orgeval’94, Pay de Caux’98, 99,), over agricultural watersheds. For each one of these, SAR images (RADARSAT-1, SIR-C) were acquired with different configurations (Table 1). Simultaneously to the radar acquisitions, ground measurements were carried out in a large number of test fields. Measurements of the soil moisture, within the top 5 cm, were made using a gravimetric method and/or a TDR probe. Roughness measurements were carried out using a pin-profiler (with a total length of 1 and 2 m, and a resolution of 5 and 10 mm, respectively). In order to ensure that sufficient statistical precision could be achieved, ten profiles were taken for each test field.
1- Orgeval’94
The objective of this experimental campaign was to characterize the effect of soil roughness on radar measurements. The Orgeval watershed is located to the east of Paris (France; Lat. 48° 51’N and Long. 3° 07’E). The experimental campaign was conducted by the CETP (Centre d’étude des Environnements Terrestre et Planétaires) and the CEMAGREF (Centre d’Etude de Machinisme Agricole, du Génie Rural et des Eaux et Forets). The Orgeval’94 campaign was run concurrently with the SIRC/XSAR (1.25 GHz, 5.3GHz and 9.25 GHz) missions [6].
The soil composition is relatively constant over the whole basin: 17% clay, 78% silt, and 5% sand. Simultaneous ground measurements were carried out in eight bare soil fields. The soil moisture content remained high and constant over the watershed (about 0.35 cm3/cm3), such that the soil roughness and tilling practices were the only remaining factors, which could influence the backscattered radar signals.
2- Pays de Caux’98, 99
The Pays de Caux’98, 99 experimental campaign was designed to characterize the agricultural soil roughness and its effects on erosion and runoff in the North of France. The test site was the Blosseville watershed located in the Pays de Caux, in Northern France (long. 0°50' W, lat. 49°47' N). The loamy soils of the northern European loess belt are sensitive mainly to soil structure degradation, and are commonly exposed to erosion caused by concentrated runoff. Within that framework, an intensive research program was carried out in the region of the Pays de Caux. The site’s soil features are: (1) a very homogenous loamy texture (13% clay, 65% loam, and 22.5% sand), (2) approximately 50% of the fields are bare, or nearly bare. RADARSAT-1 measurements were recorded in 1998 and 1999, over more than 10 large (more than 100m x 100m each) test fields.
Table 1. Details of radar data acquisition.
Campaign Sensor Date Configuration
Orgeval 94 SIR-C 12/04/94 - 18/04/94 HH
44°,52°,55 °,57° Pays de Caux 98 RADARSAT 24/02/98
09/02/98 08/02/98
HH 39° HH 47° Pays de Caux 99 RADARSAT 07/02/99
04/02/99
HH 23° HH 40° 3- Roughness measurement results
The rms heights (s) and correlation lengths (l) are extracted from the correlation function, computed from the measured soil profiles. Roughness measurements were made using a pin profiler (with a total length of 2 m and a resolution of 1 cm). The results illustrated in figure 1 show many types of agricultural soil, with s values ranging from 0.3 to 3.8 cm, and l ranging from 2.1 cm to 13.8
cm. We observe a correlation between these two parameters, for the studied test fields, with a tendency for the rms height to increase with correlation length, as illustrated by regression lines for the three databases.
Figure 1. Roughness parameters of the test fields.
0 2 4 6 8 10 12 14 16 18 20 0 0.5 1 1.5 2 2.5 3 3.5 4 4.5 c o rr e la ti o n le n g th ( c m ) rms height (cm) Pays de Caux 98 Pays de Caux 99 orgeval 94
III. Backscattering modelling
1- IEM
The present study is focussed on a particular radar configuration: HH polarization and C band (5.3 GHz) operating mode, for the radar acquisitions. IEM is used as a reference, for the simulation of backscattering coefficients. It is the most used model in backscatter studies of bare soil ([18-19]). The IEM input parameters are the dielectric constant (deduced from the surface volumetric moisture content and soil texture), the surface height and correlation function or corresponding spectrum. Many studies have been made in order to derive a good and current description of the correlation function shape ([13-14], [20]). However, in the case of agricultural soil studies, an exponential correlation function generally provides a good fit to the majority of experimental surfaces ([21-23]). An exponential correlation function was therefore used in this study. In order to remain strictly within the domain of validity of the IEM and to prevent it from being affected by other influences resulting from volumetric scattering, we took into account only those surfaces with k s < 1.3 (k: wave number, s: rms height).
The dielectric constant is introduced into IEM, through the Fresnel reflection coefficients, R0, between the air (region 0) and the soil layer (with permittivity ), which are defined as:
2 1 2 1 0 sin cos sin cos h R (1) 2 1 1 2 1 1 0 sin cos sin cos v R (2)
Water content is converted to a dielectric constant, by using a dielectric mixing model ([24]). These models need soil moisture and composition. The subscripts h and v denote horizontal or vertical polarisation, respectively. This IEM version introduces the transitional function proposed by Wu et al. [9], in which the Fresnel coefficient is not evaluated at the incidence angle i, but at an angle ranging between i and normal incidence, depending on the surface roughness parameters.
Figure 2-a provides a comparison between simulations and radar measurements, acquired over different test fields, showing good agreement for low values of radar signals in the drawn ellipse, corresponding to small roughness values. Radar signals with simulated values are illustrated in Figure 2-b as a function of the roughness parameter Zs.
Figure 2. Inter-comparison between radar signal measurements and backscattering
simulations as a function of soil roughness.
-25 -20 -15 -10 -5 0 -25 -20 -15 -10 -5 0 Radar data (dB) si g m a 0 ( d B ) Pays de Caux'98 Pays de Caux'99 O l'94 (a)
Figure 2. Cont. -25 -20 -15 -10 -5 0 5 0.00 0.05 0.10 0.15 0.20 0.25 0.30 0.35 0.40 Zs (cm) 0 (d B)
Caux 98 radar data Caux 98 simulated sigma Caux 99 radar data Caux 99 simulated sigma Orgeval 94 radar data Orgeval94 simulated sigma
(b)
Zribi and Deschambre [3] proposed this parameter, defined by s²/l, which is given by the product of the rms height (s) and the slope of the soil surface (s/l). Smooth soils correspond in general to small values of Zs (<0.1 cm), whereas ploughed soils correspond to large values of Zs (>0.1 cm). The discrepancy, between simulated and measured radar signals, increases when the values of the roughness parameter, Zs, reach higher values. This section shows particularly the difficulty of IEM to simulate correctly backscattering over surfaces with highest roughness, even in its validity domain. In the next sections, we present a hypothesis, concerning dielectric constant modelling, which could explain this disagreement for high roughness.
2- Dielectric constant modelling
As can be seen in Figure 3, the agricultural soil surface is composed of clods of different sizes, embedded together, with considerable volumes of air between the clods. The presence of air is also observed around and below the clods (Figure 4). When determining the soil’s dielectric constant, this air is not taken into account by the dielectric mixing model, which is more specifically adapted to homogenous soils with a smooth surface. In fact, as a general rule, measurements are made without including the presence of air between the clods. In the present case the surface backscattering models, which assume a homogenous soil texture, are not realistic for a large number of surfaces with medium or high roughness.
Figure 3. Illustration of real agricultural soils.
Figure 4. Clod illustration, showing soil and air fractions.
clods
soil Air fraction
around and below clods
In this study, rather than trying to simulate the heterogeneity resulting from the presence of air, with an accurate 3D backscattering model, we introduce a modification to the modelling of the dielectric constant. We consider a dielectric, two-phase mixing model [25] for the “air” and “soil” phases. This type of decomposition is proposed by [26] for passive microwave measurement analysis. These phases are accounted for by their volume fractions (1-soil) and soil in the mixing formula, yielding:
1/*
1
*
soil soil airsoil
app
, (3)where the exponent is set to =0.5, representing the refractive mixing model ([27]).
In order to retrieve the variations of soil for our database, it was decided to fit IEM to the radar data, in the HH and C band configurations.
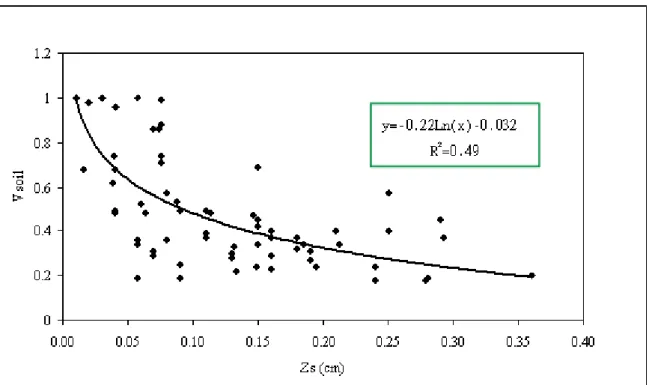
Figure 5 shows how the soil parameter varies as a function of the roughness parameter Zs. A correlation can be observed between the soil fraction and surface roughness (correlation coefficient R² equal to 0.49). This could be explained simply by the fact that, with increasing roughness, we have an increase in the number and size of clods and thus a higher probability of encountering a higher air fraction. We propose the following empirical relationship between Zs and soil, derived from the fitted data:
0.032 log 22 . 0 Zs soil
(4)Figure 5. Variation of the soil parameter (soil fraction) as a function of the soil roughness parameter Zs.
Real data fitted to this model shows a very high portion of air (even superior to 0.7) for high roughness values. This is due, firstly to our use of a single dielectric constant and the hypothesis of homogeneous soil texture, and secondly, to the use of a surface model, which is not necessarily well adapted to the backscattering estimation, over these surfaces.
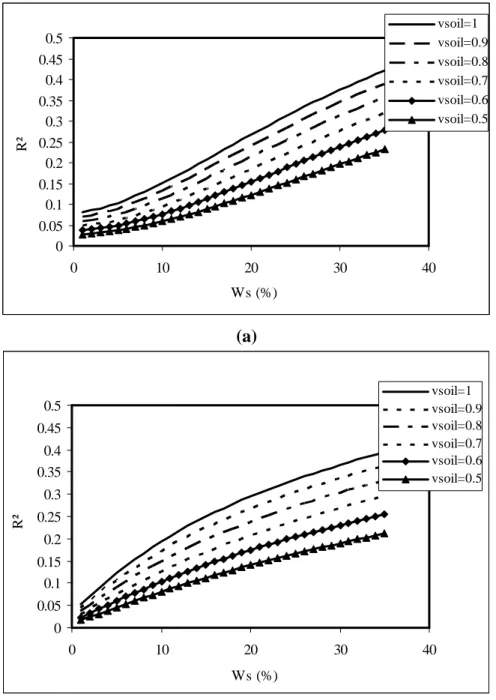
Figure 6 illustrates the variation of the Fresnel coefficient square R , on a linear scale, in HH 2 polarization, in the L (1.25 GHz) and C (5.3GHz) bands, as a function of the volumetric moisture parameter Ws, for different values of soil. We clearly observe the strong influence of this parameter on the Fresnel coefficient, with increasing values of R for a low air fraction. This could explain, in 2 particular, the strong variations in radar signal observed as a result of variations in moisture, from one field to another. In fact, the saturation of R2 (on a logarithmic scale) and of the resulting backscattered signal, at high moistures, will occur more rapidly when the air fraction is low. This is the reason for which backscattering simulations generally predict saturation, before it occurs in real measurements [15].
Figure 6. Illustration of variations in R , as a function of soil moisture, for different 2 values of the soil parameter (soil=1, soil =0.9, soil =0.8, soil =0.7, soil =0.6), (a) at L band (1.25 GHz), (b) at C band (5.3 GHz). 0 0.05 0.1 0.15 0.2 0.25 0.3 0.35 0.4 0.45 0.5 0 10 20 30 40 Ws (%) R² vsoil=1 vsoil=0.9 vsoil=0.8 vsoil=0.7 vsoil=0.6 vsoil=0.5 (a) 0 0.05 0.1 0.15 0.2 0.25 0.3 0.35 0.4 0.45 0.5 0 10 20 30 40 Ws (%) R² vsoil=1 vsoil=0.9 vsoil=0.8 vsoil=0.7 vsoil=0.6 vsoil=0.5 (b)
3- Analysis of the correlation between backscattering and moisture measurements
Figure 7 illustrates the variation of backscattering as a function of soil moisture, using IEM simulations, with no modification to the dielectric constant calculation, for the L and C bands. We observe, in particular, a saturation of the simulated signals for volumetric moisture of around 25%. This is not the case for real data, which generally exhibits a linear trend for volumetric moistures up to approximately 35%. On the other hand, in the past, the inversion of radar signals was generally based on a simple linear relationship between the radar signal at a given incidence angle (0
), and the mean soil surface volumetric moisture (Ws):
b W a dB) . s (%) ( 0 (5)
where the parameters a and b depend on incidence angle, roughness and polarisation.
Figure 7. Illustration of IEM simulations, with a classical computation of the dielectric constant, for different values of roughness, as a function of soil moisture. (a) L band (1.25 GHz), (b) C band (5.3 GHz). (a) -25 -20 -15 -10 -5 0 5 0 10 20 30 40 Ws (%) si g m a 0 d s=0.4 s=0.6 s=0.8 s=1 (b) -25 -20 -15 -10 -5 0 0 5 10 15 20 25 30 35 40 Ws (%) si g m a 0 - IE M (d B ) s=1 s=0.8 s=0.6 s=0.4
As described in the Introduction, the coefficients describing the linear relationship between moisture and radar signal are often different from one watershed to another and also from one year to another. For example, with ERS/SAR (VV polarisation, 23° incidence angle), the slope is equal to 0.33 for [16], equal to 0.28 for [15], equal to 0.42 for [28], equal to 0.55 for [29]. In this section, we propose to analyse the effect of air fraction percent on soil composition on the variation of the linear relationship regression coefficients (a and b). In order to understand this influence of the air fraction on a, b, we analysed various different case studies based on IEM simulations. We monitored the surface moisture of one site, on six different dates, corresponding to the successive surface moisture values: Ws1=5%, Ws2=10%, Ws3=15%, Ws4=20%, Ws5=25% and Ws6=30%. On the other hand, we assumed six soil parameters: and estimated from a uniform distribution between the values 0.6 and 1. These lead to infinite cases, which could be observed at real agricultural sites. We then simulated backscattering coefficients with IEM for different situations, by mixing one soil parameter (between 0.6 and 1) with one moisture value (v, Wsj, i=1,..6, j=1,..6), for six different dates.
Linear relationships between the six input moistures and the corresponding backscattering coefficient IEM simulations were illustrated just for the ten cases in the L and C bands in Figure 8. The values of the coefficients a and b were found to be highly variable, with a in the L band ranging between 0.18 and 0.34 as illustrated in Figure 8-a, with a mean value equal to 0.26, and a in the C band ranging between 0.14 and 0.30 as shown in Figure 8-b, with a mean value of 0.22.
Figure 8. Illustration of the effects of air fraction on the linear relationship between soil moisture and simulated radar signals, lines corresponding to ten linear relationship cases, with for each one, as input, successive surface moisture values (5%, 10%,15%, 20%, 25% and 30%) with six soil parameters (and estimated from a uniform distribution between the values 0.6 and 1. (a) L band (1.25 GHz), (b) C band (5.3 GHz).
y = 0.18x - 18.59 y = 0.34x - 22.63 -25 -20 -15 -10 -5 0 5 10 15 20 25 30 35 Ws (%) si g m a 0 ( d B ) (a)
Figure 8. Cont. y = 0.14x - 8.45 y = 0.30x - 12.31 -15 -10 -5 0 5 0 5 10 15 20 25 30 35 Ws (%) Si g m a 0 (d B )
The influence of the air fraction can thus be clearly observed in the behaviour of the backscattered radar signals. This effect is more significant for low moistures, with a variation equal to 3 dB for a moisture value of 5%, and 2dB for a moisture value of 30%, in the C band (Figure 8-b).
This result explains the high variation of linear relationship between soil moisture and radar signal, due just to the presence of the air fraction in the estimation of dielectric constant. This is in agreement with the other experimental studies showing this variation [16, 17]. [30] have shown the effect of roughness in the variation of this relationship. The air fraction presence is certainly a second factor that could influence this relationship from one site to another, with differences due to the oldness of tillage, rain events, etc.
IV. Conclusions
In this paper we deal with a scientific question, often neglected in our previous studies, related to the computation of the dielectric constant used in backscattering models for the estimation of soil roughness or moisture. For real agricultural soils, particularly for medium or rough surfaces, we have observed the presence of a significant air fraction that could be present between clods, or below clods. This portion could have a significant influence on the dielectric constant. In this study, based on a large experimental campaign involving moisture, roughness and radar measurements, we propose modelling of the dielectric constant in which both a soil fraction and an air fraction are used. The fitting of an IEM to real radar data clearly shows that an increase in roughness leads to an increase in the air fraction. However, this fraction could also be correlated to the time since the soil was last worked. Generally, for new soil tillage, we observe the presence of larger quantities of air between
embedded clods, and with rainfall and runoff, the percentage of air decreases. Therefore, the soil parameter probably decreases with the age of the tillage. This effect could explain some of the differences in behaviour observed in the correlation between radar signals and soil moisture. These results illustrate the difficulty to analyse backscattering behaviour over natural surfaces. In future studies, first, it will be very interesting to estimate experimentally the percent of air fraction for different types of soil (large ploughed, ploughed, cloddy, smooth soils, etc) in order to propose a correction of dielectric constant computation, for each case of surface. Second, the consideration of volume diffusion in surface backscattering models needs to be more discussed and estimated, particularly for surfaces with large air fraction percent.
Acknowledgements
This work was financed by the French CNES/TOSCA program. The authors would like to thank the European Space Agency (ESA) for providing us with the radar images free of charge.The authors also wish to thank the BRGM, CEMAGREF and CETP teams for their logistical support during the field campaigns.
References
1. Ulaby, F.T.; Moore, M.K.; Fung, A.K. Microwave Remote Sensing, Active and Passive. Artech House: Norwood, MA, 1986; Vol. 3.
2. Jackson, T.J.; Schmugge, J.; Engman, E.T. Remote sensing applications to hydrology: soil moisture. Hydrol. Sci. 1996, 41, 517-530.
3. Zribi, M.; Dechambre, M. A new empirical model to retrieve soil moisture and roughness from Radar Data. Remote Sens. Environ. 2002, 84, 42-52.
4. Baghdadi, N.; King, C.; Chanzy, A.; Wigneron, J.P. An empirical calibration of the integral equation model based on SAR data and measurements of soil moisture and surface roughness over bare soils. Int. J. Remote Sens. 2002, 23, 4325-4340.
5. Baghdadi, N.; Gherboudj, I.; Zribi, M.; Sahebi, M.; King, C.; Bonn, F. Semi-empirical calibration of the IEM backscattering model using radar images and moisture and roughness field measurements. Int. J. Remote Sens. 2004, 25, 3593-3623.
6. Fung, A.K.; Li, Z.; Chen, K.S. Backscattering from a randomly rough dielectric surface. IEEE Trans. Geosci. Remote Sens. 1992, 30, 356-369.
7. Zribi, M.; Taconet, O.; Le Hégarat-Mascle, S.; Vidal-Madjar, D.; Emblanch, C.; Loumagne, C.; Normand, M. Backscattering behavior and simulation comparison over bare soils using SIRC/XSAR and ERASME 1994 data over Orgeval. Remote Sens. Environ. 1997, 59, 256-266.
8. Chen, K.S.; Wu, T.D.; Tsay, M.K.; Fung, A.K. A note on the multiple scattering in an IEM model. IEEE Trans. Geosci. Remote Sens. 2000, 38, 249-256.
9. Wu, T.D.; Chen, K.S.; Shi, J.; Fung A.K. A transition model for the reflection coefficient in surface scattering. IEEE Trans. Geosci. Remote Sens. 2001, 39, 2040-2050.
10. Baghdadi, N.; Holah, N.; Zribi, M. Calibration of the Integral Equation Model for SAR data in C-band and HH and VV polarizations. Int. J. Remote Sens. 2006, 27, 805-816.
11. Mattia, F.; Le Toan, T. Backscattering properties of multi-scale rough surfaces. J. Electromagnet. Wave. 1999, 13, 491-526.
12. Zribi, M.; Ciarletti, V.; Taconet. O, Validation of a rough surface model based on fractional brownian geometry with SIRC and ERASME radar data over Orgeval site. Remote Sens. Environ.
2000, 73, 65-72.
13. Li, Q.; Shi, J.C.; Chen, K.S. A generalized Power Law Spectrum and its Applications to the Backscattering of soil surfaces Based on the Integral Equation Model. IEEE Trans. Geosci. Remote Sens. 2002, 40, 271– 281.
14. Zribi, M.; Baghdadi, N.; Holah, N.; Fafin, O.; Guérin, C. Evaluation of a rough soil surface description with ASAR-ENVISAT Radar Data. Remote Sens. Environ. 2005, 95, 67-76.
15. Quesney, A.; Le Hégarat-Mascle, S.; Taconet, O.; Vidal-Madjar, D.; Wigneron, J.P.; Loumagne, C.; Normand, M. Estimation of watershed soil moisture index from ERS/SAR data. Remote Sens. Environ. 2000, 72, 290-303.
16. Le Hégarat-Mascle, S.; Zribi, M.; Alem, F.; Weisse, A. Soil moisture estimation from ERS/SAR data: Toward an operational methodology. IEEE Trans. Geosci. Remote Sens. 2002, 40, 2647- 2658.
17. Moran, M.S.; Hymer, D.C.; Qi, J.; Sano; E.E. Soil moisture evaluation using multitemporal synthetic aperture radar (SAR) in semiarid rangeland. Agric. Forest Meteorol. 2000, 105, 69-80. 18. Moran, M.S.; Peters-Lidard, C.D.; Watts, J.M.; McElroy, S. Estimating soil moisture at the
watershed scale with satellite-based radar and land surface models. Can. J. Remote Sens. 2004, 30, 805-826.
19. Verhoest, N. E.C; Lievens, H.; Wagner, W.; Alvarez-Mozos, J.; Moran, M.S; and Mattia, F. On the soil roughness parameterization problem in soil moisture retrieval of bare surfaces from Synthetic Aperture Radar. Sensors 2008, 8, 4213-4248
20. Shi, J.; Wang, J.; Hsu, A.Y.; O‘Neill, P. E.; Engmann, T. Estimation of Bare Surface Soil Moisture and Surface Roughness Parameter Using L-Band SAR Image Data. IEEE Trans. Geosci. Remote Sens. 1997, 35, 1254-1265.
21. Callens, M.; Verhoest, N.E.C.; Davidson, M.W.J. Parameterization of tillage-induced single-scale soil roughness from 4-m profiles. IEEE Trans. Geosci. Remote Sens. 2006, 44, 878-888.
22. Davidson, M.W.J.; Le Toan, T.; Mattia, F.; Satalino, G.; Manninen, T.; Borgeaud, M. On the characterization of agricultural soil roughness for radar remote sensing studies. IEEE Trans. Geosci. Remote Sens. 2000, 38, 630-640.
23. Oh, Y.; Kay, Y.C.; Condition for precise measurement of soil surface roughness. IEEE Trans. Geosci. Remote Sens. 1998, 36, 691-695.
24. Hallikanen, M.T.; Ulaby, F.T.; Dobson, M.C.; El-Rayes, M.; Wu, L.; Microwave dielectric behavior of Wet Soil- Part I: Empirical Models and Experimental Observations. IEEE Trans. Geosci. Remote Sens. 1985, GE-23, 25-34.
25. Sihvola, A. Electromagnetic mixing formulas and applications. IEEE Electromagnetic Waves Series 47. IEEE: London, 1999.
26. Schneeberger, K.; Schwank, M.; Stamm, C.; De Rosnay, P.; Matzler, C.; Fluhler, H. Topsoil Structure Influencing Soil Water Retrieval by Microwave Radiometry. Vad. Zone J. 2004, 3, 1169–1179.
27. Birchak, J.C.; Gardner, J.; Hipp, Victor, J. High dielectric constant microwave probes for sensing soil moisture. Proc. IEEE 1974, 62, 93–98.
28. Taconet, O.; Vidal-Madjar, D.; Emblanch, C.; Normand, M. Taking into account vegetation effects to estimate soil moisture from C-band radar measurements. Remote Sens. Environ. 1996, 56, 52-56.
29. Weimann, A.; Von Schonermark, M.; Schumann, A.; Jorm, P.; Gunter, R. Soil moisture estimation with ERS-1 SAR in the East German loess soil area. Int. J. Remote Sens. 1998, 19, 237-243.
30. Zribi, M.; Baghdadi, N.; Holah, N.; Fafin, O. New methodology for soil surface moisture estimation and its application to ENVISAT-ASAR multi-incidence data inversion. Remote Sens. Environ. 2005, 96, 485-496.
© 2008 by the authors; licensee Molecular Diversity Preservation International, Basel, Switzerland. This article is an open-access article distributed under the terms and conditions of the Creative Commons Attribution license (http://creativecommons.org/licenses/by/3.0/).