HAL Id: hal-01692652
https://hal.archives-ouvertes.fr/hal-01692652
Submitted on 12 Feb 2018
HAL is a multi-disciplinary open access
archive for the deposit and dissemination of
sci-entific research documents, whether they are
pub-lished or not. The documents may come from
teaching and research institutions in France or
abroad, or from public or private research centers.
L’archive ouverte pluridisciplinaire HAL, est
destinée au dépôt et à la diffusion de documents
scientifiques de niveau recherche, publiés ou non,
émanant des établissements d’enseignement et de
recherche français ou étrangers, des laboratoires
publics ou privés.
Pathways to Deep Decarbonization in France
Sandrine Mathy, Patrick Criqui, Jean Charles Hourcade
To cite this version:
Sandrine Mathy, Patrick Criqui, Jean Charles Hourcade. Pathways to Deep Decarbonization in
France. [Research Report] IDDRI (Institute for Sustainable Development and International
Rela-tions ); Sustainable Development SoluRela-tions Network (SDSN). 2015, pp.60. �hal-01692652�
deep decarbonization
pathways to
in France
Publishers : Teresa Ribera, Jeffrey Sachs
Managing editors : Henri Waisman, Laura Segafredo, Roberta Pierfederici
Deep Decarbonization Pathways Project
The Deep Decarbonization Pathways Project (DDPP), an initiative of the Sustainable Develop-ment Solutions Network (SDSN) and the Institute for Sustainable DevelopDevelop-ment and International Relations (IDDRI), aims to demonstrate how countries can transform their energy systems by 2050 in order to achieve a low-carbon economy and significantly reduce the global risk of catastrophic climate change. Built upon a rigorous accounting of national circumstances, the DDPP defines transparent pathways supporting the decarbonization of energy systems while respecting the specifics of national political economy and the fulfillment of domestic devel-opment priorities. The project currently comprises 16 Country Research Teams, composed of leading research institutions from countries representing about 70% of global GHG emissions and at very different stages of development. These 16 countries are: Australia, Brazil, Canada, China, France, Germany, India, Indonesia, Italy, Japan, Mexico, Russia, South Africa, South Korea, the United Kingdom, and the United States.Published by Sustainable Development Solutions Network (SDSN) and Institute for Sustainable Development and International Relations (IDDRI)
The full report is available at deepdecarbonization.org
Disclaimer
This report was written by a group of independent experts who have not been nominated by their governments. Any views expressed in this report do not necessarily reflect the views of any government or organization, agency or program of the United Nations.
Copyright © 2015 SDSN - IDDRI
This copyrighted material is not for commercial use or dissemination (print or electronic). For personal, corporate or public policy research, or educational purposes, proper credit (bibliographical reference and/or corresponding URL) should always be included.
Cite this report as
EDDEN is a joint research unit of the French Centre National de la Recherche Scientifique (CNRS) and Grenoble University (UGA). EDDEN main activity is oriented towards economic research on energy and environment, either from an academic or applied economics perspective. Main research areas cover i) international energy markets and access to energy resources, ii) economic analysis of climate and energy policies, and iii) organization of networks industries -- gas and electricity -- and new technological systems (smart grids). EDDEN has a rich record of research in European research programs, particularly through the development and use of energy and climate scenarios with the POLES energy model.
The international research center on environment and development (Cired) was founded in 1973 by Professor Ignacy Sachs. It is today a joint venture between the French Centre National de la Recherche Scientifique (CNRS) and four other institutions (ENPC, EHESS, AGroParisTech and CIRAD). Research programs focus on the relationships between environment, natural resources and development, with focus on three key domains: energy, urban infrastructure, and agriculture and forestry---which imposes a constant dialogue between social sciences, natural sciences and engineering knowledge. To do so, the research team is pluridisciplinary, with people from diverse intellectual back-grounds, and Cired strives to preserve a good articulation between forward-looking modeling — viewed as a tool to integrate knowledge stemming from many disciplines — the economic analysis of policy tools in various institutional contexts and deliberation processes.
C I R E D
The Institute for Sustainable Development and International Relations (IDDRI) is a non-profit policy research insti-tute based in Paris. Its objective is to determine and share the keys for analyzing and understanding strategic issues linked to sustainable development from a global perspective. IDDRI helps stakeholders in deliberating on global governance of the major issues of common interest: action to attenuate climate change, to protect biodiversity, to enhance food security and to manage urbanization, and also takes part in efforts to reframe development pathways.
The Sustainable Development Solutions Network (SDSN) was commissioned by UN Secretary-General Ban Ki-moon to mobilize scientific and technical expertise from academia, civil society, and the private sector to support of prac-tical problem solving for sustainable development at local, national, and global scales. The SDSN operates national and regional networks of knowledge institutions, solution-focused thematic groups, and is building SDSNedu, an online university for sustainable development.
Acknowledgements
The authors of the report wish to acknowledge the funding provided by Chil-dren’s Investment Fund Foundation (CIFF) to enable our full engagement in the DDPP initiative. We would also like to thank the DDPP secretariat at IDDRI, notably Henri Waisman, for providing comments and suggestions for improvements to early drafts, Michel Colombier for very useful discussions and Ivan Pharabod for designing the report. Many thanks also to Odile Blanchard, Céline Rival and Danièle Revel.
Mathy S., Criqui P., Hourcade JC. (2015) Pathways to Deep Decarbonization in 2050 in France. The French report of the Deep Decarbonization Pathways Project of the Sustainable Development Solutions Network and the Institute for Sustainable Development and International Relations.
Country report authors
Patrick Criqui, Sandrine Mathy (EDDEN),
Jean-Charles Hourcade (CIRED)
EDDEN - CIRED
Executive summary
31. The New French Energy Policy:
From National Debate to the law on Energy Transition for Green Growth
51.1. A new framework for French long term energy policy 5
1.2. The Diversity and Efficiency Scenarios: Their content and uncertainties 7
2. Two Alternative Strategies for Deep Decarbonization:
A Detailed Analysis
122.1. The Modeling Framework 12
2.2. A Detailed Comparison of Alternative Pathways 15
2.3. The Macro-Economic Impacts and Social Dimensions of the Energy Transition 26
3. Decarbonization and Green Growth:
Towards a dynamic management of the energy transition
313.1. Robust Strategies, Resilient Systems, and Policy Informed by a Learning Process 31 3.2. Path Dependency and Irreversibility in a Sequential Approach: A Two-Stage Analysis of
Decarbonization Pathways to 2030 and 2050 33
3.3. Building Robust Energy-Transition Strategies and Dynamic Management 39
4. Triggering a Transition To a Deep Decarbonization Pathway
in an Adverse Context: Macroeconomic insights
404.1. An “Acceptable” Policies and Measures (APM) Scenario 40 4.2. The P&M Scenario Plus a Carbon Tax: Still a ‘triggering’ phase problem? 41 4.3. The P&M Scenario Plus a Carbon Tax, Financial Device, and Infrastructures Policies: A
question of timing 43
5. Conclusion
44Annex
46Standardized DDPP graphics for France scenarios
49FR – Efficiency 50 FR – Diversity 52
Contents
deep
decarbonization
pathways to
in France
Executive summary
In 2012, a National Debate on Energy Transitionde-fined two main pillars for energy transition in France: the Factor Four (F4) – a 75% reduction in GHG emis-sions in 2050 (compared to 1990) – and reducing the share of nuclear power in the electricity mix (from 75% in 2015 to 50% in 2025), without further indication of the long-term role of nuclear energy. The Nation-al Debate Council of 2013 Nation-also identified two main structural features that would characterize France’s energy-transition pathways:
ythe level of energy demand reduction in 2050, compared to 2010, and
ythe level of diversification of the energy supply. This permitted delineating four scenarios, or pathways, which provide a rather complete mapping of France’s possible energy futures.
The law on Energy Transition for Green Growth, adopted in July 2015 is grounded on the target of a 50% reduc-tion of total final energy demand by 2050. It appears highly consistent with an Efficiency or EFF-type pathway (Table 1). The EFF pathway’s crucial feature is indeed this very ambitious target of reducing demand. It supposes a 2% annual reduction in per-capita final energy consump-tion for France until 2050, the most ambitious rate among all decarbonization pathways analyzed in the Deep Decar-bonization Pathways Project. This scenario entails:
yovercoming the energy-efficiency gap in all sectors, but particularly in the thermal retrofit of the entire stock of existing buildings,
yvery ambitious changes in transport behavior, to
sta-bilize individual mobility and goods transport,
y technology changes aimed at decarbonizing the en-tire car fleet, and
ya surge in the use of variable renewable energy (VRE), so that they account for up to 50% of power generation. If this ambitious target of halving energy demand proved impossible to achieve, other pathways should be consid-ered. Maintaining the emissions-abatement targets for 2050 would then entail a higher supply of decarbonized energy, which would reorient the strategy on the
Diversi-fication or DIV pathway. This, in turn, would raise another
set of challenges: developing new nuclear plants con-sistent with Post-Fukushima safety standards at a com-petitive cost; making carbon capture and storage (CCS) technology available to industry; and the socio-technical possibility of producing very high amounts of bioenergy.
EFF and DIV pathways are then further analyzed
(Section 2). A set of climate policy options, by sector, consistent with the peculiarities of both pathways, are then implemented. This is done within the computable general-equilibrium (CGE) model Imaclim-R France, to assess the economic impacts of each pathway. The size of the carbon tax required to reach the F4 objec-tive in each pathway amounts to 360 €/tCO2 in EFF in 2050, and 280 €/tCO2 in 2050 in DIV. A carbon tax would raise revenues amounting to €15bn (in DIV) or €20bn (in
EFF) immediately after its introduction, and increasing
until 2050 in spite of the gradual decline in emissions, to reach €30bn in both scenarios (i.e. 1% of GDP). Aggregate cumulative investments are similar in both 1
Table 1 : Four future pathways for low-carbon energy transition in France
Diversification Supply-side mix
Priority to one source of energy Final reduction
in energy demand in 2050, compared with 2010
-20% Diversity (DIV)50% nuclear in electricity after 2025 40% renewables in electricity mix in 2050
Decarbonization (DEC)
75% nuclear in the electricity mix on the whole period 20% renewables in electricity mix in 2050
-50% Effi ciency (EFF)Decrease to 25% nuclear in 2050 70% renewables in electricity mix in 2050
Sobriety (SOB)
Phase-out of nuclear by 2050
Executive summary
scenarios but the DIV scenario would mainly rely on in-vestments for decarbonized supply in the energy indus-try, whereas the EFF scenario places a larger share of the burden of investment decisions on end-users. In both cases, the drop in energy consumption, and the growth in non-fossil energy sources, would substantially improve France’s energy trade balance from its current level of imports at 3% of GDP – an amount roughly equal to France’s external trade deficit.
Household energy spending in the EFF scenario is halved in 2050 compared to 2010, despite the increase in investment for thermal retrofits, as a result of substantial energy savings in homes and changing mobility behavior patterns. In the
DIV scenario, the household energy budget is reduced only
by a quarter. The EFF scenario would drive annual economic growth 0.1% higher than DIV over the entire period, leading to a GDP 2.4% higher by 2050. This difference is mainly the result of the differences in household energy budgets and government consumption, which are transferred to other consumption, inducing more economic activity and more domestic production. Between 300,000 and 600,000 ad-ditional jobs would thus be created under the EFF scenario compared to the DIV scenario, mainly in the service sector, as a result of this “induced employment” phenomenon. The report defines the scenarios, analyzes the obsta-cles to be overcome and the measures to be deployed and finally assesses the macro-economic impacts. To-gether, these factors clearly illustrate the magnitude of the uncertainties weighing on the energy transition. In section 3, a sequential two-stage analysis of the EFF and
DIV pathways is conducted, taking into account the most
uncertain dimension of each pathway, and the required adjustment of the strategy if:
yEFF fails to implement an ambitious energy savings
program; or
yDIV finally cannot rely on the development of a new generation of nuclear power plants.
The analysis shows that the EFF strategy is apparently more robust, since it reduces the need for decarbonized energy, and leaves more room for maneuver if demand-re-duction policies fail to perform as well as expected.
Furthermore, the analysis pleads in favor of setting up an institutional management system for low-carbon energy transition, comprising:
yimperatives, i.e. bringing together objectives which must be achieved regardless of which strategy is cho-sen (though insufficient in themselves to achieve the Factor Four target) ;
yshort-term goals consistent with the long-term ob-jective, but to be periodically reconsidered. The ener-gy-transition management system should thus entail setting up a permanent monitoring system, the check-ing of progress annually, and providcheck-ing feedback for dynamically managing the transition process. As part of this approach, the transition strategy would be reg-ularly reviewed and adapted roughly every five years, in pursuit of adaptive short-term policies consistent with the long-term strategy.
Section 4 focuses on triggering the energy transition, in a macroeconomic context dominated by short-term imbal-ances. Energy transition policies can indeed lead to higher growth and a lower unemployment rate in the medium to long term. But even with very optimistic assumptions about the penetration of energy efficiency and low carbon op-tions, the triggering of a low-carbon energy transition might be inhibited by the initial adjustment costs. These adjust-ment costs can be overcome only though a complex set of measures which encompass energy regulation measures on the demand and supply side, new patterns of development for urban and transportation infrastructures, a carbon tax, and a successful negotiation on recycling the revenues from this tax. Finally, the full deployment of the transition will require new financial devices to drastically decrease the risks to investors in low-carbon technologies and to redirect savings towards sustainable low-carbon projects.
A final conclusion is perhaps that a deep decarbonization pathway involves a profound modification of the social contract established at a time of cheap fossil fuels. Such a transition cannot be disconnected from the country’s overall development strategy, and to succeed, will be conditional to France’s ability to mobilize around reforms which, taken together, may define a new social contract.
The New French Energy Policy
1
The New French Energy Policy: From National
Debate to the law on Energy Transition for
Green Growth
1.1
A new framework for French long
term energy policy
France’s passage in 2015 of, the law on Energy Transition for Green Growth, represents the cul-mination of a process launched at the end of 2012 by the National Debate on Energy Transition. The debate over how to lower carbon emissions gradually identified the broad lines, and then the details, of what could be the ‘French way’ toward energy transition. The transition concept itself has a long history in France, with roots in projects designed to achieve more energy inde-pendence after the oil crises of the 1970s. The 1992 Rio UN Conference on Environment and Development and the Kyoto Protocol, ratified in 2005, led policymakers to a commitment to define new, lower-carbon energy policies aimed at reducing emissions by the energy sector. Initial mentions began in 2003 of the need to reduce emissions by a “Factor of four” by 2050 – or F4. This F4 target was officially introduced in 2005, in the law that set France’s energy policy guidelines, called in French the POPE law, for Programmation et Orientation de la Politique Energétique. Since then, F4 has been the focal point of France’s energy policy.
1.1.1
The National Debate on Energy
Transition in 2013
In 2013, when the Council of the National Debate on Energy Transition was convened, its Working Group on Pathways and Scenarios based its work
on two main pillars: the F4 target for emissions in 2050, and reducing the share of nuclear power in the electricity mix. The first had already, albeit gradually, become a key plank of energy and cli-mate policy in France. The latter, however, had only recently entered broad public discussion. In-deed, the discussion on diversifying the electric-ity mix, and reducing the share of nuclear power in electricity generation to 50% by 2025, dated only to the 2012 presidential election campaign. It is important to note that the 2025 objective has not been accompanied by an indication of what long-term role would be played by nuclear generation; all options remained open. The process that was set up subsequently was rather unusual, breaking new ground in energy policymaking in France. The terms of the debate were not established from the outset by a polit-ical or administrative body, but were the result of a broad consultation among various groups of stakeholders including experts, business repre-sentatives, and civil society. Furthermore, the de-bate’s aim was to define and discuss not one but several scenarios, or contrasting pathways. This began with the launching of a far-reaching inven-tory of different outlooks on France’s long-term energy prospects, including scenarios produced by civil society (non-profits, NGOs, research centers, etc.). In all, 16 scenarios were selected, represent-ing contrastrepresent-ing visions of the transition1, but all displaying a sufficient level of internal coherence and relevance with respect to the two pillars, F4 emissions targets for 2050, and reducing the share of nuclear power in the electricity mix.
1
1 For example, preliminary analysis revealed huge differences, with electricity consumption varying between 280 and 840 TWh in 2050, compared with 450 TWh at present.
The New French Energy Policy
The national debate process was designed as an exercise in deliberative democracy, but given the diversity of the 16 scenarios’ starting points, they could not serve as the vehicle for direct input or discussions among the participants to the National Council of the Transition (environmental NGOs, other NGOs, employers, trade-unions, Parlia-ment, local authorities and government). Instead, they needed to conduct analyses and discussions around a smaller number of visions. ‘Families’ of energy scenarios, were thus identified, grouping the 16 scenarios into four ‘trajectories’ or ‘pathways.’
1.1.2
Four contrasting energy
trajectories for France
These four possible energy futures were all com-pliant with the two-fold framing pillars or goals (F4 and 50% nuclear share in electricity mix in 2025, with one exception, discussed below), but very different in their structures and socio-eco-nomic implications2. Two essential indicators distinguish these pathways from one another
(Table 2): the level of demand, as measured by the final energy-demand reduction by 2050 (ei-ther 50% or 20%); and the energy supply mix, as measured by the relative weight of nuclear power and renewable energy sources in the electricity generation mix.
The four pathways or trajectories delineate a very broad range, and provide a good mapping of France’s possible energy futures. Setting aside the hypothesis that a major, game-changing, technological rupture could occur, it is hard to imagine a future outcome completely at odds with all four of these pathways. At one extreme,
Sobriety (inspired by Negawatt3) is very close in its principles to the new German model of
Energiewende (energy transition), with a
nu-clear phase-out. At the other extreme,
Decar-bonization (inspired by Negatep) corresponds
to a continuation of the old French model, in which nuclear power predominates4. Between the two, Efficiency is very close to the scenarios elaborated by France’s Environment and Energy Management Agency (Ademe)5. And Diversity
2 For more detailed information, see
http://webissimo.developpement-durable.gouv.fr/IMG/pdf/tude_Trajectoires_DNTE_cle74f7d5.pdf
3 Association négaWatt, Manifeste négaWatt, Réussir la transition énergétique, Thierry Salomon, Marc Jedliczka, Yves Marignac, 2012
4 Sauvons le Climat, Diviser par quatre les rejets de CO2 dus à l’énergie : le scénario Negatep. 5 ADEME, Contribution de l’ADEME à l’élaboration de visions énergétiques 2030 2050, Synthèse. 2
Table 2 : Four future pathways for low carbon energy transition in France
Diversifi cation Energy Supply-Side Mix
Priority to one source
Final energy- demand reduction in 2050, compared to 2010
-20%
1. DIVERSITY (DIV)
Strong reduction in consumption comes at a cost Share of nuclear power in the electricity mix stabilizes at 50% after 2025
40% share of renewables in the electricity mix in 2050
2. DECARBONIZATION (DEC)
Strong reduction in consumption comes at a cost Nuclear power retains its 75% share in the electricity mix Renewables are limited at 20% in the electricity mix after 2020
-50%
3. EFFICIENCY (EFF)
Cut in consumption through use of best techn ologies Share of nuclear in the electricity mix decreases after 2025 to 25% in 2050
70% share of renewables in the electricity mix in 2050
4. SOBRIETY* (SOB)
Major changes in consumer behavior Complete phase-out of nuclear power by 2050
Almost 90% share of renewables in electricity mix in 2050
The New French Energy Policy
draws on one of the three scenarios produced by the National Alliance for the Coordination of Energy-Research6, which adopts a deliberately balanced position between the various forms of leverage and sources of low-carbon energy.
1.1.3
Quantitative targets in the law on
Energy Transition
This scenario analysis was a major input for the design of the law on Energy Transition and Green Growth. Indeed, although it does not explicitly re-fer to the pathways selected by the energy transi-tion debate, it is clearly consistent with the
Efficien-cy pathway, based on the Ademe scenario, which
meets or is close to the law’s quantitative targets. The law sets the following preliminary targets:
yCut greenhouse gas emissions by 40% by 2030 and 75% by 2050, compared with 1990.
yCut final energy consumption by 50% by 2050, compared with 2012.
yCut fossil energy consumption by 30% by 2030 compared with 2012.
yRaise the share of renewables in overall con-sumption to 23% by 2020, and 32% by 2030, with sectoral targets of 38% for heating, 15% for fuel and 40% for electricity.
yReduce the share of nuclear power in overall electricity generation to 50% by 2025.
ySet additional targets for 500,000 thermal re-habilitation projects per year, starting in 2017, 7 million loading docks for electric vehicles by 2030, and 1,500 bio-digesters over the next three years.
So the course has been set and the target sce-nario has been documented. However, this does not prove the social or technical feasibility of
this scenario. A particularly high level of un-certainty, notably, surrounds the feasibility of halving energy consumption between now and 2050. This uncertainty suggests that managing the energy transition should involve a dynamic learning process, taking account of the results obtained and of the difficulties encountered in the deployment of the various policies. The F4 target will not be dropped, but the routes to achieving it will probably have to be adjusted over time. There is reason to think the likeliest pathway will result from some cross-breeding of the first-best Efficiency scenario with rival sce-narios, in particular Diversity (DIV). The Diversity pathway achieves the main targets differently: with less demand reduction, and more decarbon-ized supply. DIV seems to represent the likeliest alternative option, if energy demand reductions in the EFF scenario, do not reach a 2% annual reduction rate7. The DIV and EFF strategies are thus presented and discussed below.
1.2
The Diversity and Efficiency
Scenarios: Their content and
uncertainties
The various pathways to the energy transition, entailing the substantial de-carbonization of France’s energy system by 2050, have been iden-tified. They all involve overcoming challenges which will require suitable public policies. The different challenges to be overcome, which weigh on the likelihood of a successful transition, are the main causes of uncertainty. We begin by identi-fying the uncertainties weighing on a successful transition via the Efficiency (EFF) pathway. EFF seems to be most consistent with the law, and it 6 ANCRE, Scénarios de l’ANCRE pour la transition énergétique, Rapport 2013. http://www.allianceenergie.fr/
page000100dc.asp?card=985
7 SOB could also be considered as an alternative to EFF scenario within the framework of a decision of nuclear phase out which is not currently under discussion. On the contrary, DEC is really contrasted to EFF scenario on both pillars of decarbonization: supply side mix and final energy demand reduction. DEC is also not consistent with the objective of reducing the nuclear share in the electricity mix in 2025.
The New French Energy Policy
is also the only pathway to tackle the most inertial sectors, opening a wider range of options. Yet, it also presents several main foreseeable challenges and potential difficulties.
Foremost among them is the ambitiousness of halving energy demand in 35 years. If it proved impossible to achieve the ambitious target of halving energy demand, maintaining the 2050 emissions-abatement targets would entail a greater supply of decarbonized energy. This, in turn, would necessitate keeping nuclear power output at a higher level, as in the DIV pathway, and raise another set of uncertainties.
1.2.1
The Efficiency scenario: How far
can demand be reduced?
The very ambitious demand-reduction target in the Efficiency scenario is its crucial feature. It supposes a 2% annual reduction in per-capita final energy consumption in France until 2050, i.e. the most ambitious rate among all the de-carbonization pathways analyzed by the Deep Decarbonization Pathways Project. This, while
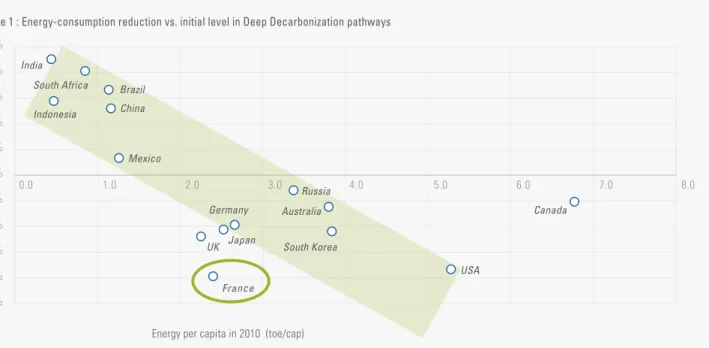
France already has a low level of energy con-sumption, making further improvements appear even more challenging (Figure 1).
Overcoming the energy-efficiency gap in the thermal retrofit of buildings
Among the key challenges the EFF scenario would raise on the demand side, one can note the need to carry out the deep thermal retrofitting of almost all existing buildings. The number of dwellings to be heavily rehabilitated each year would need to increase steeply, to reach 600,000 to 800,000 homes a year, compared to less than 150,000 light rehabilitations of dwellings a year today. Experience shows that thermal retrofit of buildings is often justified when doing a standard economic calculation, yet thermal retrofitting is often diffi-cult to trigger in real life. The reasons include sub-stantial transaction costs, difficulties in accessing funding, and the short payback time – consequent-ly, the high implicit discount rates – requested by building owners to retrofit. The ‘landlord-tenant dilemma’ is also a major issue: the landlord is sup-posed to commission the thermal retrofit, but he
Figure 1 : Energy-consumption reduction vs. initial level in Deep Decarbonization pathways
Energy per capita in 2010 (toe/cap)
Australia Brazil Canada China France Germany India Indonesia
Japan South Korea Mexico Russia South Africa UK USA -2.5% -2.0% -1.5% -1.0% -0.5% 0.0% 0.5% 1.0% 1.5% 2.0% 2.5% 0.0 1.0 2.0 3.0 4.0 5.0 6.0 7.0 8.0
The New French Energy Policy
does not pay for energy consumption and thus has limited incentive to invest in the property’s energy efficiency. All these factors contribute to the ‘en-ergy-efficiency gap’, a familiar problem identified since the energy crises of the 1970s. While the investment cost of a deep retrofit will be recov-ered through annual savings over the lifetime of the building, owners usually require much shorter payback times, most often 3 to 5 years.
Various types of policies may be deployed to narrow the gap between collective and individual rationality: subsidies to reduce the cost of invest-ment, such as tax credits; or increases in energy prices through environmental taxes. The subsidy option may be hampered by the constraints of public finance, while the tax option is certainly worth considering, but inevitably has an impact on household budgets, particularly for the least well-off. It should therefore be supplemented by structural policies designed to extend the time-frame of the decision (i.e. to lower the discount rate): the provision of suitable funding packages, which would reduce the uncertainties and vari-ous transaction costs each project entails. Any scenario that, as Efficiency does, requires a substantial drop in energy demand, will need the capacity to gradually ramp up deep thermal retrofit programs for building stock. Yet doing so successfully will depend, to a large extent, on the government’s ability to frame policies: articulating energy prices, providing suitable funding, lowering transaction costs, and sup-porting an adequate business structure to make the retrofitting operations happen at such large scale. Particular attention should also be paid to vocational training to enable the acquisition and dissemination of required skills.
Transport: changes in behavior and technology The Efficiency scenario also sets ambitious targets for cutting energy demand in the trans-port sector. Doing so would involve changes in mobility practices, technology, and
infrastruc-ture. Regarding mobility behavior, the scenario assumes that the current plateau in individual mobility (kilometers per person and per annum) will continue, with mobility steadying by 2030, and ultimately dropping by 20% by 2050 as a consequence of the reorganization of urban systems to limit commuting and promote public transportation.
This scenario is also counting on major chang-es in automobile technology, including the al-most-complete disappearance of conventional, petroleum-powered internal combustion en-gines. By 2050, the scenario assumes the fleet would consist mainly of electric, hybrid-electric, or natural-gas vehicles.
The adoption of electric vehicles has for sev-eral years been identified as a key factor of decarbonization for France. Various car manu-facturers have developed electric vehicles and an electric-car sharing service has operated in Paris since 2012. Planning for the installation of electric car infrastructure and charging ter-minals is among the aims of the law on Energy Transition for Green Growth. However in 2014, sales of electric vehicles only accounted for a small market share, with 10,000 vehicles out of a total of 1.8 million autos registered. At 2015 oil prices, the economic fundamentals of electric vehicles are frail: with an initial extra investment cost of €8,000-10,000 over a conventional car and annual energy savings of about €1,000, by using electricity instead of gasoline, the payback period is at best 8 years. This is probably insufficient in view of the observed consumer behavior, and the corresponding implicit discount rates as seen in the energy-efficiency-gap discussion, above. France’s recent introduction of a €6,000 incen-tive (rising to €10,000 in some cases) for electric vehicle purchasers cuts most of the initial extra cost and may help to stimulate sales, but it may also endangers public finances in case of rapid take-off of electrical vehicles. A substantial and
The New French Energy Policy
lasting reduction in the payback period would thus require both technical advances and/or a steep rise in gasoline prices through the intro-duction of a carbon tax.
Constraints on scaling up Variable Renewable Energy
One of the characteristics of the Efficiency scenar-io is the importance given to the development of renewable energy sources, in particular variable renewable energy (VRE) sources – i.e. solar and wind. The increase in use of VRE, central to the EFF scenario, mirrors the diminishing share of nuclear power in the electricity mix that should drop to 50% by 2025 and to 25% in 2050. In this sce-nario, renewable energy sources account for 70% of electricity generation in 2050, of which 55% is derived from Variable Renewable Energy sourc-es. Whereas overall electricity production would decrease slightly8, installed capacities would al-most double compared with 2010, due to the lower load factor of variable sources. Variable Renewable Energy sources would then represent installed capacity on a par with the current level for all generating technologies.
This development of the non-dispatchable sources raises a series of specific problems re-garding grid development and management. Even at relatively low VRE market shares – less than 30% – the network incurs various system costs: first, for connecting new and more wide-ly dispersed generating plants; second, to build up reserve capacity (as a backup, in the event of a sudden variation in the VRE generation regime); third, to re-optimize the power plant fleet and its management, to minimize ramping costs. All these changes to existing electricity
systems must allow for the proper integration of next-generation resources into the infrastruc-ture, so as to guarantee the stability of the net-work and minimize the risks of blackout. Increasing the share of VRE in the power genera-tion mix poses other types of problems. These grow out of the structural mismatch, at certain times of year, between the grid demands and the power supplied by VRE sources. At times, VRE produces a massive surplus. Research carried out in Germany suggests that, with current demand profiles, when VRE account for more than 40% of output, signif-icant surplus production starts occurring9. Similar research in France confirms the threshold of 40% above which significant surplus production starts appearing10. Large unused production would of course hamper the cost-effectiveness of VRE. Several types of solution are currently under con-sideration to remedy the mismatch of supply and demand, in systems where VRE accounts for over one-third of total generation. Matching supply and demand can be improved either through ex-tensive regional supergrids, or smartgrids bringing more flexibility in demand and a better adjust-ment on local networks. Mass electricity storage is also an option. For the time being, storage would mainly rely on hydraulic pumping stations and secondarily batteries. Finally, power to gas options, i.e. converting surplus electricity into hydrogen or methane gas may also bring a solu-tion. A new study performed for the ADEME, the French Agency for Energy Efficiency, indicates that a 100% renewable power supply, based on the regional complementarity of resources, might be manageable, under conditions of low and flexible demand and assuming favorable developments in mass energy storage11.
8 The decrease occurs in spite of opposite forces on electricity demand: decrease thanks to efficiency but increase because of electrification of end-uses (electric vehicle particularly).
9 Wagner, A., 2014. Residual demand modeling and application to electricity pricing. The Energy Journal, 35(2),45–73. 10 D. Grand, C. Le Brun, R. Vidil, Transition énergétique et mix électrique : les énergies renouvelables peuvent- elles
compenser une réduction du nucléaire ? Revue de l’Energie, 619, Mai-Juin 2014.
The New French Energy Policy
Solutions are many, but for different reasons – re-lating to technology, economics, or physical po-tential – none of them represents a comprehen-sive and risk-free answer. The development of VRE to levels above 40% of total electricity generation is consequently subject to serious uncertainties. It represents one of the most important challenges to be addressed in the energy transition.
1.2.2
An Alternative Scenario:
Diversity, or the search for a larger
decarbonized supply
The alternative scenarios must cope with other forms of uncertainty. The Diversity scenario (DIV) would involve a less drastic reduction in demand, compensated for by a greater supply of decarbon-ized energies. At stake here is securing a larger de-carbonized energy supply, primarily from three very different sources: third-generation nuclear power plants, biomass energy, and urban heat networks. Challenges for scenarios with a significant new nuclear contribution
France has a large fleet of nuclear power plants, but aging, with most of the capacity installed between 1980 and 2000. Assuming a 35-to-40-year service life, this would mean the old-est plants should be dismantled by 2015-2020. This fits in with some of the priorities of France’s nuclear policy, which stipulates that decom-missioning of the oldest plants should start by 2017. Assuming that the average service life of second-generation plants (built from 1980 to 2000) can be extended to 45 years, and that decommissioning makes allowance for each plant’s characteristics, enabling the process to be smoothed out, then the 50% nuclear power threshold would be crossed by 2028. This would be three years later than the target set by the Law on Energy Transition. But from then onwards, the
decommissioning of old capacity would contin-ue, and new third-generation plants should have to begin going on line.
On the basis of the above assumption, and due to the long lead-time in the nuclear industry, the building of new reactors would need to start in the early-2020s, following on the first European Pressurized Reactor (EPR) to be built in France at Flamanville. Designing these future projects would have to start immediately. Were that to occur, the main questions relate to the form and siting of such plants, the requested technical and safety standards, and their final cost.
While there has been an increase of over 50% in the cost of nuclear power plants since the first industrial reactors, the analysis of the cost of the various types of second-generation reactors has shown that four main factors explain this phenomenon12:
yThe increased size of nuclear plants, which in turn impacts the scale and duration of construction.
yRising labor costs in the nuclear sector, out-stripping average inflation.
yThe absence of learning effects in the nuclear industry, although some gains were registered in the course of developing different types of second-generation plants.
yHigher nuclear safety standards, with higher costs correlated with more stringent safety requirements.
The building of Finland and France’s first EPRs in the 2000s drew fresh attention to the press-ing question of rispress-ing nuclear plant construction costs. Both projects have taken much longer than planned. The total cost of the Flamanville invest-ment is estimated at €10.5 billion, equivalent to nearly €6,500 per MWe. This is twice the total cost, including interim interest, of France’s last two second-generation reactors. There has been no decision yet on when construction will start in the United Kingdom. It looks as if only the two 12 Lévêque, F. (2014). The Economics and Uncertainties of Nuclear Power. Cambridge University Press.
Two Alternative Strategies for Deep Decarbonization
EPRs being built in China are likely to meet their initial targets, partly thanks to different rules in managing this type of major project.
The increasing size and complexity, a factor in the second-generation reactors’ steadily rising costs now appears to be impacting third-gen-eration EPR reactors, too. These difficulties will have to be overcome. They also come in addition to the commonly raised issues of waste manage-ment and social acceptability.
The role of biomass in decarbonizing the energy sector
All the transition scenarios depend on a signifi-cantly higher contribution by biomass energy. Compared with current volumes, of about 10 Mtoe, the various scenarios project a threefold increase in biomass-generated inputs. However each scenario highlights a different energy carrier. Each option assumes that various obstacles can be overcome. For developing wood on a large scale, the main difficulty is achieving an ade-quate supply as forest land ownership is frag-mented, hampering long-term exploitation of
the resource. The main difficulty in developing of second and third-generation liquid biofuels is that it is conditioned on overcoming the techno-logical obstacles holding back radical innovation in thermal or biological transformation process-es. To achieve a quick uptake of the different bioenergy options, various technical, industrial, and professional nodes need to be deployed along the industry value chain.
Lastly, growth in the use of biomass raises the question of how much land would be required. Mainland France extends over 550,000 sq km; farmland takes up 110,000 sq km or 60% of arable land, and forest a further 150,000 sq km. Under the Diversity scenario, 20,000 sq km would be re-quired for dedicated energy crops (switchgrass on farmland; short-rotation plantations harvesting on woodland). A further 31,000 sq km would be used to grow first-generation biofuel feedstock (starch-es, sugars, vegetabl(starch-es, for ethanol and esters), or to capitalize on agricultural by-products and wastes. Even under the least ambitious scenario, this would entail using almost 9% of the land area of mainland France to grow energy feedstock.
2
Two Alternative Strategies for Deep
Decarbonization: A Detailed Analysis
In this section, we represent the EFF(Effici-cency) and the DIV (Diversity) decarbonization
strategies in each sector (Table 3) with the Imaclim-R France model. Imaclim-R France is a computable general equilibrium model that quantitatively represents the interrelated technical and economic impacts of different energy scenarios, as an aid to policy reform and design (see section 2.1). The model allows for the consistent analysis of how changes
in technological systems and economic con-straints (such as funding, evolution of prices or of the economic agents’ behavior) impact various measures’ effectiveness.
2.1
The Modeling Framework
Imaclim-R-France is13 a dynamic computable general equilibrium (CGE) model belonging to the Imaclim family of models developed at
2
13 The economy is broken down into 13 sectors: energy (crude oil, refined oil, gas, coal, electricity), transport (road transport of goods, shipping by sea and inland waters, air transport, collective transport for passengers), construction, energy-intensive industry, agriculture and services.
Two Alternative Strategies for Deep Decarbonization
CIRED14. It is a hybrid model which represents, year by year from 2004 to 2050, simultaneous changes in technology systems and the economy (Figure 2). Imaclim-R uses a recursive architec-ture to represent both the long-term growth
en-gine (demographic growth and labor productivi-ty) and the various forms of short-term frictions affecting the technico-economic adjustments (imperfect expectations, incomplete use of pro-duction factors, inertia at various levels – equip-3
Table 3: Description of main sectoral indicators of strategies in EFF and DIV
Programs and strategies
Sector EFF DIV
Residential –
existing buildings About 600,000 retrofi ts per year on average, and retrofi tting of the entire stock of existing buildings between 2010 and 2050. Average of 350,000 retrofi ts per year on average, retrofi tting 55% of the stock of existing buildings between 2010 and 2050. Service 23 M sqm retrofi tted each year (100% of the stock between 2010
and 2050). 15 M sq m retrofi tted each year (60% of the stock between 2010 and 2050). Freight transport Increase in quantity of t.km until 2030 and stabilization in 2050 at
the level of 2010 Increase of the quantity of t.km in 2050 by 55%/2010, i.e. contin-uation of current trends in the evolution of tonnes.km. Passenger transport Stabilization of the quantity of pass.km in 2050/2010 (i.e. a 15%
decrease of the per capita mobility). Increase (following current trend) of the demand for individual mobility (+ 25%/2010 in 2050).
Source: From Carbone 4, 2014. Etude des 4 trajectoires du DNTE
14 Crassous, R., Hourcade, J.-C., Sassi, O., 2006. Endogenous structural change and climate targets : modeling experiments with Imaclim-R. Energy Journal. Special Issue on the Innovation Modeling Comparison Project. Sassi, O., Crassous, R., Hourcade, J.-C., Gitz, V., Waisman, H., Guivarch, C., 2010. Imaclim-R : a modelling framework to simulate sustainable development pathways. International Journal of Global Environmental Issues. Special Issue on Models for Sustainable Development for Resolving Global Environmental Issues. 10(1/2): 5–24.
Waisman, H., Guivarch, C., Grazi, F. Hourcade, J.C., 2012. The Imaclim-R model : infrastructures, technical inertia and the costs of low carbon futures under imperfect foresight, Climatic Change, 114(1).
Figure 2: The recursive and modular structure of the IMACLIM-R model
Static Equilibrium (t) under constraints TIME PATH Industry ... Electricity Oil Transport Static Equilibrium (t+1) under updated constraints
Economic signals
(prices, quantites, Investments) Updated parameters(technical coefficients, population, productivity) Bottom-up sub-models
Two Alternative Strategies for Deep Decarbonization
ment, technology, preferences, trade, or capital flows). Economic growth is thus described as a succession of static equilibriums, representing for each year the equilibrium of economic flows (production, consumption, international trade) under fixed technical parameters. The dynamic is represented by sector-specific models reflecting shifts in technology and stocks of production factors (capital, labor, natural resources), thus fueling changes in technical parameters between each static equilibrium.
At each date, the static equilibrium is con-strained by the characteristics of installed equipment and technologies, as well as by the imperfect allocation of investments between sectors: for example, surplus production ca-pacity in some sectors and under-caca-pacity in others. In such a framework, the model can represent, among others, the effect of tension on prices and volume, unemployment due to insufficient flexibility in the labor market, distortions caused by economic signals (pre-viously existing taxes) or agents’ behaviors (as represented by behavioral routines).
The dynamics of the economy are governed by endogenous modelling of capital accumulation and technical change. Capital accumulation is represented through firms’ investment, house-holds’ savings, and international capital flows. The cross-sector distribution of investments is governed by investors’ expectations about sectors’ profitability, under imperfect foresight and technical conditions as described in sec-tor-specific reduced forms of technology-rich models. Imperfect foresight is a consequence of uncertainty about future relative prices, final demand and investments profitability, other non-energy prices (land and real estate) and non-economic determinants of public deci-sions in transportation and urban planning. At
a given date, agents have limited information about the future, and shape their expectations on the basis of past and current trends (adap-tive expectations). Under such semi-myopic foresight, installed capital resulting from past investment decisions may not be adapted to future economic settings. However, the cap-ital stock cannot be replaced quickly due to inertias, which act as constraints on investors’ adaptability to varying economic conditions (activity levels and prices).
Energy flows are represented in the model both in value and physical quantities, enabling the respective roles of each energy sector to be isolated, as well as their interaction with the rest of the economy. The model uses physical variables (number of motor vehicles, collective dwellings or individual houses, annual energy efficiency of technologies, etc.) allowing for the integration of sector-specific data related to how economic incentives impact final demand and technology systems. This also facilitates the dialogue with non-modelers.
The agents represented displayed specific pat-terns of behavior in the dynamic modules. In the residential sector, the model represents investments in thermal retrofitting and in new heating equipment. Dwelling owners decide to invest in a retrofitting action if the invest-ment is profitable. In the model, the return on investment for retrofitting actions takes into account the investment cost for retrofitting according to the objective in energy consump-tion, resulting energy savings discounted over the equipment lifetime and barriers to energy efficiency in the form of intangible costs15. For the electricity sector, the model represents the development of additional capacities with a wide range of technology (coal and gas with or without CCS, nuclear, solar, wind, biomass, 15 Giraudet, L.-G., Guivarch, C., Quirion P., 2012. Exploring the potential for energy conservation in French households
Two Alternative Strategies for Deep Decarbonization
and hydro) and an hourly load profile16. Spatial mobility and modal-shares of transport are the result of a maximization of the utility function, subject to the dual constraint of income and time-budget17 in order to capture the connec-tions between final demand, infrastructures, and equipment availability18. Freight demand is obtained by aggregating demand for goods transport in each productive sector. In other sectors, autonomous technical progress is cali-brated on ongoing trends. Variations in energy prices – potentially including a carbon tax – induce additional gains in energy efficiency and energy substitution, under the assumption of imperfect foresight regarding energy prices. The model thus shows the impact of climate policy instruments – carbon taxation, incen-tives for the thermal retrofit, energy efficiency regulation for equipment, or transport-infra-structure policies – on agents’ decisions and behaviors. Incentive policies are directly inte-grated in investment costs and energy prices, while the energy-efficiency coefficients of the various generations of capital goods include the effects of regulation.
2.2
A Detailed Comparison of
Alternative Pathways
The following sub-section describes sector-specif-ic or transversal strategies, polsector-specif-icies, and measures for either the EFF or DIV scenario. The selection of the particular policies and measures considered is based on an extensive review of the literature, focusing on sector-specific studies of policies that drive energy dynamics.
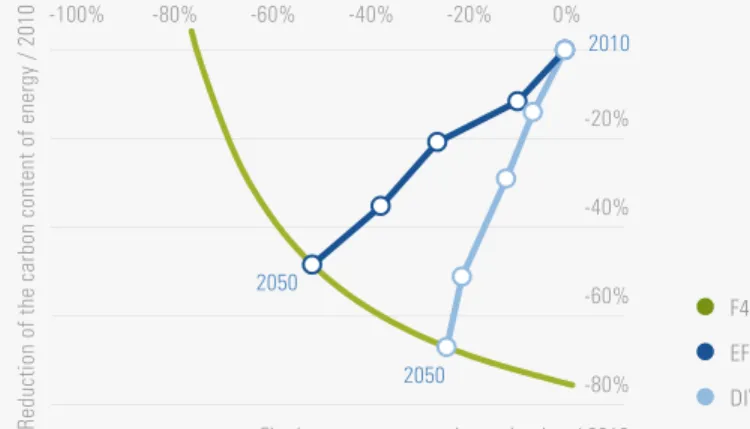
The pathways resulting from the EFF and DIV sce-narios are shown in Figure 3. It plots the reduc-tion of final energy consumpreduc-tion (x-axis) against the decarbonization of final energy 2010 (y-axis), both compared to 2010 levels. In this representa-tion, all the pairs (final energy consumption; car-bon content of energy) that achieve the F4 target are marked with the green line, representing the F4 isoquant. The points above the isoquant fail to achieve the F4 target, whereas those below exceed it.
In this graphical representation, the almost im-mediate divergence between the EFF and DIV strategies appears clearly, and leads to very dif-ferent respective roles for the two parameters in reaching the F4 target. EFF yields a 50% reduction in demand, coupled with a 48% drop in the
car-2010 2050 2050 F4 EFF DIV -80% -60% -40% -20% -100% -80% -60% -40% -20% 0%
Reduction of the carbon content of energy / 2010 Final energy consumption reduction / 2010
Figure 3: DIV and EFF pathways, according to demand reduction and energy-decarbonization on 2010
NB: the dots on the pathways mark decades 2020, 2030, 2040 and 2050
16 Bibas, R., Mathy, S., 2011. Dynamiques d’investissement et de maîtrise de la courbe de charge dans le système électrique français, presented at La journée de la chaire modélisation prospective 2011 Prospective pour les enjeux Energie-Climat, October 11th, Jardin Tropical, CIRED, Paris, France.
17 Zahavi, Y., Talvitie, A., 1980. Regularities in Travel Time and Money Expenditures. Transportation Research Record. 750, pp. 13-19.
18 Waisman, H, Guivarch, C., Lecocq, F, 2012. The transportation sector and low-carbon growth pathways. Climate Policy. 13(1):107-130.
Two Alternative Strategies for Deep Decarbonization
bon content of energy. DIV, by contrast, has lower demand-reduction (24%) and so would need to achieve greater energy-decarbonization (67%) to make for it. This level of decarbonization in DIV is particularly ambitious, given that it applies to final consumption that is around 40 Mtoe higher.
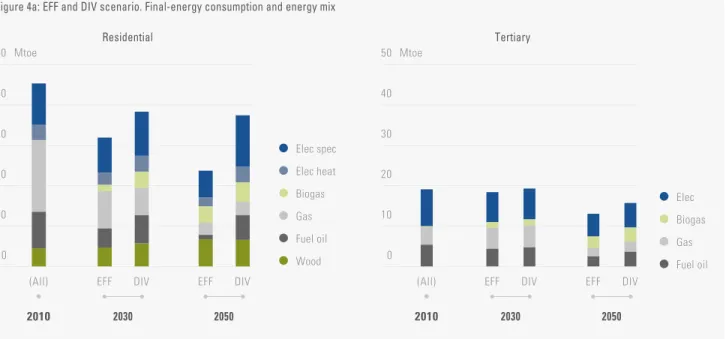
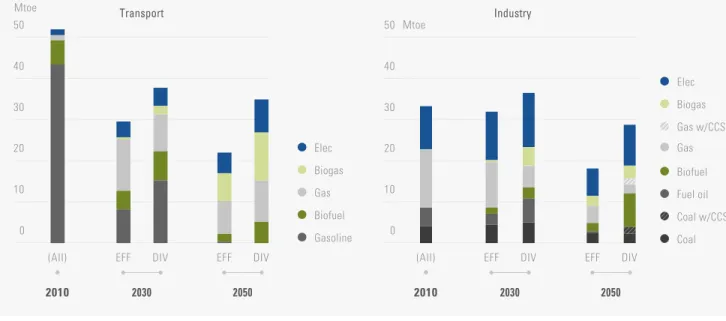
Figure 4 shows, for the EFF and DIV scenarios, the changes in sectoral energy mixes for residential housing, tertiary sector, transport, industry, ag-gregate final demand, and electricity generation. In the following, we examine in greater detail the sectoral measures considered in each scenario. Running a simulation of the DIV and EFF policies and measures using the Imaclim-R France model, we will consider the consequences for energy con-sumption, energy mix, and greenhouse-gas emis-sions (CO2 from energy and industrial processes).
2.2.1
Introducing a Carbon Tax
Both the EFF and the DIV scenarios presuppose the introduction of a carbon tax, which is levied on all sectors, and assume that economic agents will accurately anticipate its future increase. Tax revenues are supposed to be refunded annual-ly to households as a lump sum19. The carbon tax comes on top of specific policies and meas-ures introduced in each scenario and its level is computed in order to comply with the Factor 4 objective (Figure 5).
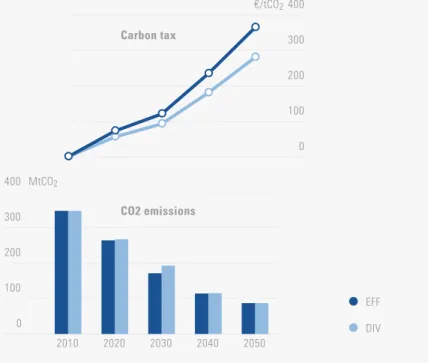
In the EFF scenario, the carbon tax would reach €120 per ton of CO2 in 2030 and €360 in 2050, compared with resp. €90 and €280 per ton of CO2 in the DIV scenario20. During the first years, the carbon tax would increase
2010 2010 Elec Biogas Gas Fuel oil Elec spec Elec heat Biogas Gas Fuel oil Wood DIV EFF 2050 DIV EFF 2030 (All) DIV EFF 2050 DIV EFF 2030 (All) 0 10 20 30 40 50 0 10 20 30 40 50 Mtoe Mtoe Residential Tertiary
Figure 4a: EFF and DIV scenario. Final-energy consumption and energy mix
19 Other assumptions could have been made: either recycling carbon tax revenues through subsidies on energy efficiency or renewables, or more particularly through an alleviation of labor charges. This last option will be discussed in the last section concerning the macroeconomic features of energy transition.
20 These values are very close to recommendations in expert reports (Quinet 2009, 2013; Rocard 2009). The experts who drafted the Quinet report in 2009 (La valeur tutélaire du carbone, Rapport de la commission présidée par Alain Quinet. La documentation française, Rapport n°16, 424 pp ) recommended a carbon tax set at a rate of €32/t CO2 in 2010, rising to €56 in 2020, €100 in 2030 and between €200 and €350 in 2050. These values correspond to the implicit value of the constraints for reducing CO2 emissions entailed by the targets for 2020 and 2050.
Two Alternative Strategies for Deep Decarbonization
only slowly, in both scenarios, to avoid heavily penalizing households equipped with ener-gy-intensive technology or organizations that cannot be changed overnight (e.g., long com-muting distances due to residential choices). On the other hand, the aim is for households
and economic sectors to anticipate the pro-gressive nature of the tax, so they shift in-vestment towards technology, equipment, and organizations with low energy consumption and greenhouse gas emissions. In particular, it is important to change people’s decisions on
2010 2010 TWh Mtoe Elec Biogas Gas Gas w/CCS Biofuel Oil Wood Coal Other renewables Solar PV Wind Nuclear Natural gas Coal (All) 2030 EFF DIV 2050
EFF DIV (All)
2030 EFF DIV 2050 EFF DIV Coal w/CCS 0 20 40 60 80 100 120 140 160 0 100 200 300 400 500 600 Power generation
Final energy consumption
Figure 4c: EFF and DIV scenario. Final-energy consumption and energy mix
2010 2010 Mtoe Mtoe Elec Biogas Gas Biofuel Gasoline Elec Biogas Gas w/CCS Gas Fuel oil Biofuel Coal Coal w/CCS (All) 2030 EFF DIV 2050
EFF DIV (All)
2030 EFF DIV 2050 EFF DIV 0 10 20 30 40 50 0 10 20 30 40 50 Transport Industry
Two Alternative Strategies for Deep Decarbonization
where to dwell, to reduce in the power sector the distance travelled between home and work or to encourage choosing homes close to col-lective transport infrastructure.
2.2.2
The Thermal Retrofit Challenge
in the Residential Sector
The residential and service sectors consumed in total 68 Mtoe, accounting for 43% of final-en-ergy consumption in France in 2010, and 26% of energy-related CO2 emissions. Between 1990 and 2010, their final-energy consumption increased by slightly more than 15%, although emissions were up only slightly (by 3%) because higher energy demand has been mainly driven by electricity. In 2015, building stock comprises about 30 million dwellings. Some 70% of the building stock that will exist in 2050 has already been built. About 300,000 dwellings are built a year, and only 30,000 are demolished.
Ambitious thermal regulations have been in-troduced for new buildings since the Grenelle de l’Environnement in 2007. Regulations were introduced requiring new buildings to comply with low-energy standards at 50 kWh/sqm/year, which represent a substantial cut in energy con-sumption compared with the previous thermal regulations. By 2020, the new positive-energy buildings should be producing more energy than they consume. There remains, however, uncer-tainty about new buildings’ energy consumption because of the question of the degree of their compliance with thermal regulations. In the sce-narios we describe, the positive-energy-building thermal regulation is supposed to be really ef-fective after 2025.
But the main challenge in attempting to achieve the cuts in energy consumption projected for 2050 is to improve the energy performance of existing buildings. The existing building stock mainly consists of dwellings with low-grade energy labels. France’s first thermal regulation was introduced in 1975 and 55% of the 2010 building stock are older than that. Average fi-nal-energy consumption in existing dwellings is 190 kWh per sqm, with thermal energy (heating and hot water) accounting for nearly 80% of energy consumption.
In the residential sector, the challenge for the
EFF pathway is to push through an ambitious
thermal-retrofit program to enhance the energy performance of the entire existing building stock. To achieve this, financial incentives would be introduced in the form of subsidies or tax credits for high-performance materials and equipment (boilers), coupled with interest-free ‘eco-loans’ for retrofit work, to bring dwellings into line with top-grade energy labels.
The sum of incentives represent an annual av-erage addition of € 2.5 billion to the govern-ment budget. Schemes providing for financial engineering to contain the risks entailed thermal retrofit operations (failure to meet
energy-ef- EFF DIV €/tCO2 0 100 200 300 400 0 100 200 300 400 2010 2020 2030 2040 2050 MtCO2 CO2 emissions Carbon tax
Two Alternative Strategies for Deep Decarbonization
ficiency targets once completed, cost over-runs) would also be deployed. These financial mechanisms would include third-party funding schemes, energy-performance contracts, and guarantee funds for collective dwellings, among others. These mechanisms would be designed to limit the risk-aversion holding back such work. As such, they would reduce the implicit discount rate for property owners faced with the decision to retrofit or not.
These mechanisms – financial and non-financial – would increase the acceptability of retrofit for property owners, by bringing the private discount rate (which sometimes exceeds 20% per an-num21) closer to the social discount rate (about 4% per annum). Some observers nevertheless
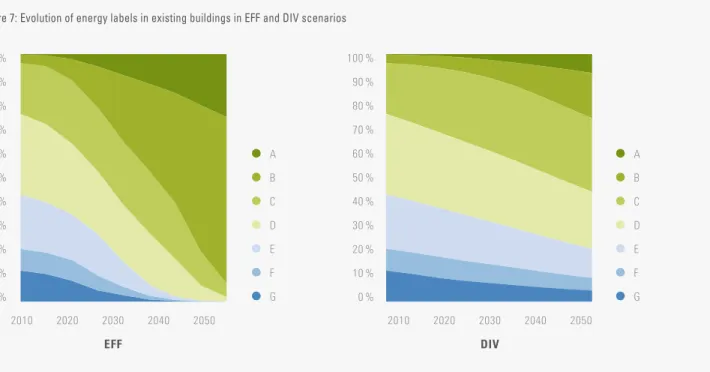
ar-gue that incentives alone will not be sufficient to bring about thermal retrofit of the entire building stock22. The scenario consequently assumes that compulsory retrofit measures would be enforced, in order to achieve an average of 570,000 high-grade A and B label23 (with energy consumption below 90 kWh/sqm/year) thermal retrofits per annum (Figure 6).
In the DIV pathway, the same financial and non-financial incentives would be deployed as in the EFF pathway, but without the back-up of any compulsory measures, leading to a substantially lower number of annual thermal retrofits: around 350,000 each year in total, but with only 200,000 each year being high-grade retrofits.
C energy label A and B energy labels 0 100,000 200,000 300,000 400,000 500,000 600,000 700,000 800,000 900,000 1,000,000
Figure 6: Number of thermal retrofits per year by post-retrofit energy grade
DIV EFF 2010-2020 DIV EFF 2020-2030 DIV EFF 2030-2040 DIV EFF 2040-2050
21 The average discount rate for investments in energy efficiency was estimated to be equal to 20% by Train (1985). Train, K., 1985, “Discount rates in consumer’s energy-related decisions: a review of the literature”, Energy 10(12): 1243-1253
22 Giraudet, L.-G., C. Guivarch, P. Quirion, 2011, “Comparing and combining energy saving policies : will proposed residential sector policies meet French official targets ?”, The Energy Journal, 32(SI1):213-242
23 France introduced energy labels for buildings in 2006, with a seven-tier ranking running from A for the best performance to G to the least satisfactory, with regard to a building’s energy consumption. Energy labels A to G refer to the following level of energy consumption: A: <50 KWh/sqm/year; B: from 51 to 90 KWh/sqm/year, C: from 91 to 150 KWh/sqm/year, D: from 151 to 230 KWh/sqm/year, E from 231 to 330 KWh/sqm/year, F from 331 to 450 KWh/sqm/year and G >450 KWh/sqm/year.
Two Alternative Strategies for Deep Decarbonization
The results for the EFF scenario also show high market penetration by dwellings with A or B en-ergy labels, to account for 90% of stock by 2050 (Figure 7). In contrast, with the DIV scenario such dwellings would only account for 25% of stock, C-grade dwellings would represent 30% of the total, and lower grades would continue to exist, contrary to EFF.
Furthermore, consumer behavior regarding electricity consumption is also a major concern because of its current steep upward trend, driven by the emergence of new devices and uses. Equipment per household is a concern, as is the level of use of the equipment. Both scenarios integrate comparable gains in energy efficiency, but the EFF scenario is more opti-mistic regarding shifts in patterns of consumer behavior (i.e. less equipment per household and lower level of utilization of the equip-ment). EFF thus yields a 28% reduction in
overall specific-electricity consumption by 2050, compared with 2010, in contrast to a 45% increase in such consumption under the
DIV scenario.
2.2.3
Policies and Measures in the
Service Sector
The service sector represents one-third of build-ing floor space, with 620 million sq m. It has an average energy consumption of 245 kWh per sq m (versus 190 kWh per sq m for residential prop-erty). This final energy consumption is largely due to specific end-uses of electrical equipment. Heating and sanitary hot water represent only 50% of energy use (compared with 80% in res-idential buildings)24.
As it does with residential buildings, the EFF scenario provides for a much more ambitious
G F E D C B A G F E D C B A
Figure 7: Evolution of energy labels in existing buildings in EFF and DIV scenarios
100 % 90 % 80 % 70 % 60 % 50 % 40 % 30 % 20 % 10 % 0 % 100 % 90 % 80 % 70 % 60 % 50 % 40 % 30 % 20 % 10 % 0 % 2010 2020 2030 2040 2050 2010 2020 2030 2040 2050 EFF DIV
24 This average conceals large disparities in the consumption of service properties, due to very diverse end-uses: on average catering premises (hotels and restaurants) register unit consumption 2.7 times higher than educational buildings.
Two Alternative Strategies for Deep Decarbonization
thermal-retrofit program than the DIV scenario. Under EFF, 21 billion sq m would be retrofitted, yielding a 55% gain in energy efficiency, com-pared to 15 billion sq m for the DIV scenario, with only a 45% gain in energy efficiency. EFF also considers specific efficiency measures for electric appliances, such as more ambitious regulation, than DIV.
2.2.4
Passenger Transport
Since 1990, per capita mobility has increased on average by 0.7% each year, reaching 985 billion passenger-kilometers in 2012. As a result, de-mand for passenger transport in France has been growing 1.2% annually, faster than the population (growing 0.5% a year). However since the 2000s, per capita mobility has flat-tened out at roughly 15,000 km per year. The private car is still the preferred mode of transport thanks to its high level of conveni-ence. It represents more than 80% of mobility for France as a whole. Since 1990, the impact of increasing personal transport (up 30%) on energy consumption has been partly compen-sated by a 15% gain in the energy efficiency of road transport achieved, despite the low rate of renewal of the fleet, thanks to the intro-duction of stringent norms for new vehicles. Average fleet emissions were 169 g CO2 /km in 2010. European Union directives have set targets for reducing emissions to 130 gCO2/ km by 2015 and 95 gCO2/km by 2020 for new sales.
The future trends for individual mobility will depend on a combination of several factors: regional development and the relative position of centers of employment and housing; relative expenditure on road and collective transport infrastructure; and changes in patterns of mo-bility such as car sharing, remote working or teleconferencing.
The EFF scenario assumes that regional de-velopment and infrastructure spending will enable rail transport to grow significantly, alongside public transport in urban areas. There would nevertheless be no sudden shift in the relative positions of residential and business centers. Average commuting distances would not grow any longer; it is assumed that daily travel times would gradually flatten out. At the same time, incentives to encourage remote working, car-sharing, and a service economy (in particular car-clubs) would limit the distance travelled by private cars. These trends are made possible by the spread of digital technology. As a result, growth in individual mobility using private cars would be significantly limited in EFF, yielding ground to an increase in the modal share of collective means of transport, for urban and long-distance journeys, and an increase in soft modes (walking and cycling) in cities. The modal share of air transport would fall due to the intro-duction of taxation on aviation fuel, reflecting its environmental impacts, coupled with an end to exemption from the tax on petroleum products and the roll-out of competitive long-distance collective transport systems.
Individual ownership of motor vehicles would also decline in EFF, due to rising fuel prices pushed up by a carbon tax. By 2050, sales of conventional vehicles would have been partly replaced by electric and hybrid vehicles and partly by natural gas vehicles, a fuel with a low carbon content with use of biogas. This technology mix delivers a choice of vehicles consistent with the diversity of transport de-mand (long versus short distance, urban versus rural). Correlated with the drop in individual mobility, and changes in the corresponding habits and the relation to private cars, this scenario foresees a significant drop in the number of new vehicles purchased every year. The DIV scenario, by contrast, assumes that it will remain difficult to change travel behaviors.