C
C
H
H
E
E
M
M
I
I
C
C
A
A
L
L
E
E
N
N
G
G
I
I
N
N
E
E
E
E
R
R
I
I
N
N
G
G
T
T
R
R
A
A
N
N
S
S
A
A
C
C
T
T
I
I
O
O
N
N
S
S
VOL. 29, 2012
A publication of
The Italian Association of Chemical Engineering Online at: www.aidic.it/cet
Guest Editors: Petar Sabev Varbanov, Hon Loong Lam, Jiří Jaromír Klemeš Copyright © 2012, AIDIC Servizi S.r.l.,
ISBN 978-88-95608-20-4; ISSN 1974-9791 DOI: 10.3303/CET1229149
Analysis of the Predictive Models of Oil and Gas
Transportation Ducts' Rehabilitation
Noureddine Abdelbaki*,
Elahmoun Bouali,
Mohamed Gaceb,
Mourad Bettayeb
University Mohamed Bougara, Boumerdes, Faculty of Hydrocarbons and Chemistry Independence Street, Laboratory of Reliability and Equipment,. 35000, Algeria
lfep@umbb.dz
The actions of the various phenomena of corrosion, mechanical constraints and others, contribute to the degradation of hydrocarbons transportation ducts. The combinations of these phenomena accelerate pipe ageing, and this results in the increase of the frequency of leaks interventions and pipe ruptures. The only way to struggle against the ageing of oil transportation pipelines is the rehabilitation. This will allow the re-servicing of pipes whose resistance characteristics are degraded. One of the major difficulties, during the conception of a pipeline rehabilitation program, is the determination of the specific sections to rehabilitate. Indeed if there is any real risk not to do enough rehabilitation in the one hand, there is a risk to bad rehabilitation on the other. The decision to continue to maintain, renovate or replace some degraded sections of a pipeline is not an easy task, and requires development of forecasting models that will enable decision-makers to take the right decisions on the middle and long term. In this context, this study is devoted to analysis of problems associated with statistical exploitation of controls and repair files of aged pipes, establishing action plans and controlling the ageing of hydrocarbons transportation pipelines.
1. Introduction
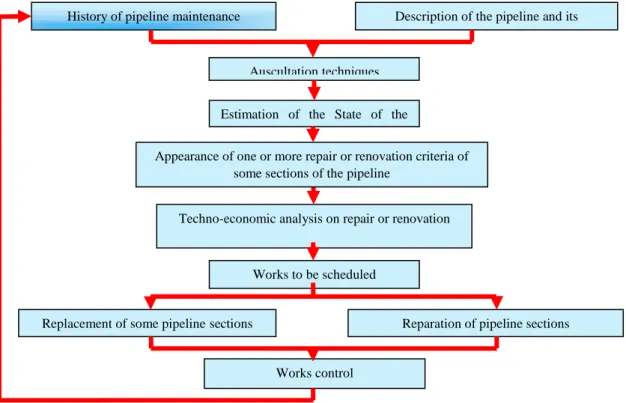
Currently the age of much of hydrocarbons transport networks in the world have exceeded the duration of service targeted during their conception, which is 40 y. In view of the environmental concerns about leaks and pipeline ruptures and the high costs of repairs or renovations, the retention of ageing pipelines in service, has become a growing concern for operators and poses real technical and economical challenges. The management of maintenance and rehabilitation of ageing pipelines requires the development or the design of approaches whose rationality is based on the optimization of the costs of maintenance, inspection, repairs and renovations. The management of the maintenance of ageing pipes, is a complex task, figure1. It consists in data acquisition and processing, pipelines state evaluation, modelling of their behaviour and of the effect of different possible in-service keeping strategies, and definition and choice of the most suitable strategy. Repair or renewal interventions on highly degraded pipeline components are then integrated into the annual programming procedures of the works or in the middle or long term forecasts given the overall state of the existing pipelines network and the importance of each pipeline in the network.
Ensuring security, reliability and extended life of pipelines at reduced costs, is the fundamental purpose of the ageing of the hydrocarbon transportation pipelines control. To achieve such a goal, it is necessary to develop pipeline state assessment models and technologies, including non-destructive
History of pipeline maintenance Description of the pipeline and its environment
Techno-economic analysis on repair or renovation
Works to be scheduled
Reparation of pipeline sections Replacement of some pipelinesections
Works control Auscultation techniques
Estimation of the State of the pipeline
Appearance of one or more repair or renovation criteria of some sections of the pipeline
control methods (Stephane, 2007), pipeline residual life degradation prediction models and finally maintenance optimization models.
Prediction of residual life, of time until rehabilitation or replacement of a component of ageing pipelines, involves the consideration of a set of criteria, including the specific conditions of maximum acceptable degradation that ensures the safety and usefulness of the conduct, costs relating to all possible maintenance inspection and rehabilitation strategies, including the ”do nothing” option.
A large number of control tools of hydrocarbon transportation ageing pipelines may be provided by the reliability theory (Avent and Jesen, 1999; Rausaud and Hoyland , 2004), which permits to establish the relationship between the loads exerted on the pipelines and ageing, and to integrate the history of pipelines state inspections. Failures of hydrocarbon transportation pipelines cause repair intervention costs, and indirect costs such as fixed costs and lost profit margin. To act quickly when they occur and to avoid them, it is necessary to model the life of pipeline components. The idea of this work is to make a small point about a few methods relating to these issues, and seek efficiency and better understand to these problems.
Figure 1. Steps of a maintenance policy approach of ageing pipelines
2. Analysis of the models
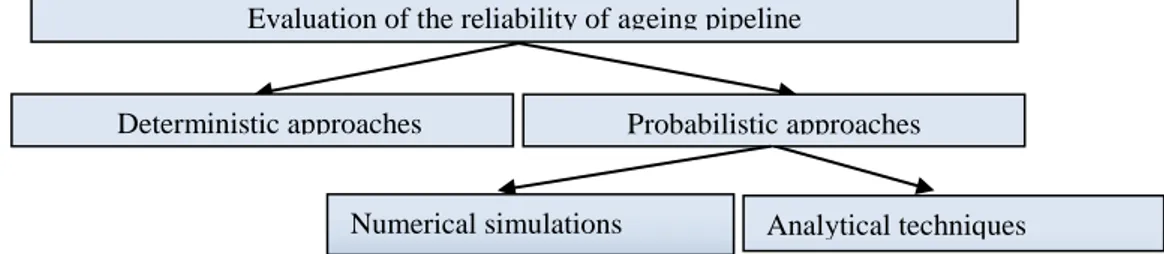
To “a priori” access the pipeline behaviour in its environment in terms of probability of occurrence: default probability at every instant, probability of being in a degradation state given in terms of time, we resort to modelling, Figure 2. The effectiveness of the decisions in maintenance depends on the quality of the model representing the pipeline in question. The models are supplemented by information on the current status of the pipeline after each inspection and maintenance action. The reliability of oil transportation pipelines is largely conditioned by the characteristics of each pipeline, to its operating conditions, and to its degradation environment. The reliability of the pipelines is sensitive to the loading rate, to the mode of operation, to the stresses, to failure modes considered, and to maintenance policies (Proccacia and Morilhat, 1996).
The pipelines degradation mechanisms of such as corrosion, fatigue, vibrations and other stresses, create wear phenomena and therefore the aged pipeline. This leads to the conclusion that the failure rate depends on the factors of influence which are in turn function of time. Statistical analysis enable to conduct reliability studies without prior knowledge of the complex relationships that bind the influencing factors to failure rates (Coccoza, 1997)
.
In this context a few models are considered below.Figure 2. Ageing pipeline reliability assessment technique
2.1 Cox Model
One of the most used models is the Cox proportional hazards model or (PHM) (Chen and Little, 1999)
.
In the context of our study the PHM, links the failure rate λ (t) of a pipeline component in known degradation state with respect to a reference state. It then allows data analysis to measure quantitatively, the relative importance of the influential factors on the behaviour of pipeline in operation. The Semi parametric model of the PHM, also allows to evaluate the relative importance of the factors on the pipeline failure behaviour, such as service pressure and temperature, the chemical composition of pipeline sections steel, the pipeline surrounding environment, the transported substance properties and others. In this case, the rate of pipeline failure is presented in the form:
t
,
z
0
t
g
z
(1)Where: λ(t,z) is the pipeline failure rate, function of time “t” and the state “z” of influential factors. λ0(t) - Pipeline failure base rates, function of time only
g (z) - influence function , which depends on the state of the factors only
The base failure rate λ0(t) is modelled by the two parameters Waybill law.
With regard to the problems related to missing values and pipeline state error measures, one refers to the many works developed in this respect by Dafni and Tsiatis; Hu, Tsiatis and Davidian; Wulfsohn and Tsiatis (Tsiatis et al., 1998).
2.2 Gamma process
Modelling of the pipeline ageing mechanisms of the by the gamma process is a promising route. On the one hand this process is better suited to the slow, continuous and progressive nature of pipelines degradation process and on the other hand the characteristics of the gamma process such as the independence of increments, allow the formulation of stationarity assumptions (or non-stationarity) and also on the average trend in degradations evolution (Lannoy and Proccacia, 2005). The identification of the model is done a priori from the results of the pipelines degradation state inspections and associated inspections dates. To reconstruct directly exploitable increases data with the gamma process, it should be taken as a hypothesis that the degradation mechanism of the considered pipeline begins as soon as it is commissioned.
2.3 Markovian and semi-Markovian Processes and Bayesian approaches
One of the simplest approaches is to confine oneself to the hypothesis that operating pipeline components pass through a limited number of states with constant probabilities and without taking repairs into account.
Deterministic approaches Probabilistic approaches
Numerical simulations
Evaluation of the reliability of ageing pipeline
In this case the modelling is done by Markov process. The simplicity of this model, can justify its application for modelling of the pipeline youth period. For the ageing period the more justifiable models are those where the time spent in a state and the durations between states are represented by a normal or Weibull type law. Among these models the Weibull-Markov model and the semi-Markov process are cited. In the latter case the behaviour of the pipeline is described by successive states with increasing degradation and each state is characterized by its degradation and the costs of maintenance for this State. In hydrocarbons transporting pipelines exploitation practice, is favoured the models that incorporate information, not only on the pipeline state, but also on the exploitation regime and the service pressure in particular. Bayesian approaches to respond well to these preoccupations (Becker and Naim, 1999).
3. Evaluation of the effects of periodic inspections and of the pipeline age on the repairs volume
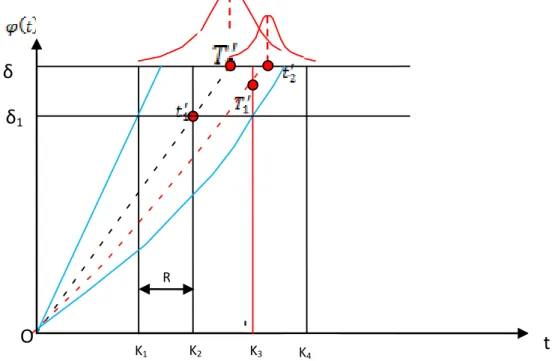
The maintenance strategy of ageing pipelines, defines the set of decision rules, which establish the sequence of maintenance actions to be undertaken on the basis of their level of degradation and acceptable thresholds for their operation (Vrouwenvelder, 1994). Such a strategy must be defined taking into account all significant influential factors on pipelines service durability.. This task is complex. This is why the Monte-Carlo simulation is subsequently used, while describing a method for the calculation of maintenance indicators such as the evolution of the repairs and failures frequencies as a function of the pipeline state inspections periodicity and residual life. Data from feedback of experiments related to same steel pipelines and operating in similar conditions is used. From these data, the mathematical expectation function of degradations (loss of metal) is identified and those of the squared deviations to the left and to the right: and which determine the area of possible variations of the random pipeline degradation process. For the description of this process, a third degree polynomial is used. Pipeline boundary states are defined by degradation thresholds and .
δ
2I
K
1K
2K
3δ
1O
K
4t
R
R [y] Tr [ y ea rs ] Nu m b er o f su m m a ry in ter v en tio n s Nu m b er o f p re v en tiv e rep air s Nu m b er o f cu rativ e rep air s R (years) R [y] Tr [y ] Tr [ y ] 10 15 20 25 30 0 10 15 20 25 30 0 10 15 20 25 30 0 1 2 3 4 5 1 2 3 4 5 5 4 3 2 1
Figure4.(a) Influence of inspection frequency (R) and residual life (Tr) on the number of curative repairs
Figure4.(b) Influence of inspection frequency (R) and residual life (Tr) on the number of preventive repairs
Figure4.(c) Estimated summary number of refits as a function of the inspections regime and pipeline residual life
The process of occurrence of limit States is illustrated in Figure 3, where periodic pipeline inspections are considered as a filter. The probability of crossing this filter (threshold ) vary with the nature of the process and the density of the filter (frequency of inspections). There is interest in the frequencies of the intersections of thresholds and by the function , taking into account the functions
and and the inspections frequency R.
4. Results
This study is devoted to 40" diameter X60 steel pipeline in operation, in the ageing phase. For different strategies and by repeated experiments, according to an appropriate algorithm, interactions between volumes of preventative and curative repairs, periodic inspections, and pipeline residual life are assessed. The results are presented on the Figures 4 a, b, c. The frequency of inspections of the pipeline considered corresponding to a minimum number of interventions is estimated to be 3.5 y.
5. Conclusion
Due to the availability of reliable sensors and the rapid development of non-destructive control technology, control of ageing hydrocarbons transportation pipelines based on reliability tools is promising. The integration of the results of inspections carried out regularly in pipelines behavior models improves their accuracy, and finds its impact on the effectiveness of the preventive maintenance actions, whose priorities will be given to the pipelines sections which are in the worst State. Methods based on degradation, such as continuous degradation method and the method of degradation data analysis, find a wide application in the search for control of hydrocarbons transportation pipelines ageing.
References
Avent T., Jesen U.,1999. Stochastic models in reliability., Applications of mathematics: stochastic modelling and applied probability series, Vol. 41. Springer-Verlag, New York, USA.
Becker A., Naim P., 1999, Bayesian networks (in French), Eyrolles, Paris, France.
Chen H., Little J., 1999. Proportional hazards regression with missing covariates. Journal of the American Statistical Association, 94(447), 896-908.
Coccoza-Thivent C., 1997. Stochastic processes and systems reliability, Mathematics and Applications (in French), Vol. 28, Springer, Berlin, Germany.
Lannoy A., Proccacia H., 2005. Evaluation and maintenance of industrial equipment (in French), Lavoasier, Paris, France.
Procaccia H., Morilhat P., 1996. Reliability of Structures in Industrial Plants - Theory and Application of Probabilistic Mechanics (in French), Eyrolles, 94, Paris, France.
Rausaud R., Hoyland A., 2004. System reliability theory models, statistical methods and applications, 2nd Ed. Wiley, New Jersey, USA.
Stephane S., 2007. Line inspection of pipelines (in French), Lavoisier, Paris, France.
Tsiatis A., Hu P., Davidian M., 1998. Estimating the parameters in the Cox model when covariate variables are measured with error, Biometrics, 54(4), 1407-1419.
Vrouwenvelder, A. 1994. Inspection and maintenance strategies, Heron 39(2), Delft University of technology, Delft, The Netherlands.