FOCUS THEME
The value of RFID for RTI management
Alexander Ilic&Jason W. P. Ng&Paul Bowman&Thorsten Staake
Received: 7 December 2008 / Accepted: 2 June 2009 / Published online: 8 July 2009 # Institute of Information Management, University of St. Gallen 2009
Abstract Returnable transport items (RTIs) are key elements for enabling a smooth flow of goods throughout supply chains. Despite their importance, RTIs can be prone to high loss and breakage rates. Today’s RTI management processes are rather inefficient and are based on estimates about when, where and how RTIs are utilised. This limited visibility inevitably causes the involved parties to feel less responsible for the proper management of RTIs. As a consequence, inefficiencies created by a single party can result in a significant cost burden for the whole supply chain. The goal of this paper is therefore to explore the impact of increased asset visibility on the RTI management process. We describe a solution based on Radio Frequency Identification (RFID) technology and quantify its financial impact from each individual stakeholder’s perspective. Our findings suggest that RFID can provide a powerful means to counter inefficiencies in the RTI management process and improve the overall effectiveness of the RTI supply chain network. Keywords RTI management . RFID
JEL D82 . L91 . M150 . C630
Introduction
Practical relevance and problem statement
Reusable Transport Items (RTIs) such as pallets or reusable crates constitute the key ingredients for efficient logistic operations and the protection of goods during transport, storage and handling. One of the most widely used and important RTI types is wooden pallets. The global pool size of wooden pallets is estimated at 4 billion pallets with over 400 million new pallets produced every year (Ray et al. 2006). Logistic operations heavily depend on the availability of pallets, as they ensure that goods can be easily moved, stacked, transported and integrated into sophisticated fully automated storage and conveyor systems. To ensure smooth operation, multiple companies often share a common pool of pallets, which is managed by an RTI pool operator.
Despite the importance of RTIs for daily operations, pallets are prone to high loss rates (as a result of shrinkage) and are often subject to breakage. Two independent surveys conducted in BRIDGE 2007 and Aberdeen Group 2004 have found that the average loss rate for the pallets is around 9–10% annually. Besides losses, the RTI industry faces the problem that on average 9% of the assets are subject to breakage every year (BRIDGE2007) and might need to be repaired. The key problem in RTI management is that it is often not known, at any specific point in time, where the individual RTIs are and in what condition they are in. This limited visibility creates the tendency for people and organisations to feel less responsible for the proper management of RTIs. As a consequence, unnecessary costs resulting from high loss rates, breakages and unavailability DOI 10.1007/s12525-009-0011-5
Responsible editor: Frédéric Thiesse A. Ilic (*)
ETH Zurich,
SEC E7, Scheuchzerstrasse 7, 8092 Zurich, Switzerland e-mail: [email protected] J. W. P. Ng
:
P. Bowman BT Research,Ipswich IP5 3RE, United Kingdom T. Staake
ETH Zurich,
SEC E6, Scheuchzerstrasse 7, Zurich 8092, Switzerland
of RTIs are generated which have a negative impact on the overall performance of the whole supply chain.
In order to improve the situation, RTI visibility and a proper management approach is needed to increase process efficiency and enhance RTI control. Technologi-cal solutions such as Radio Frequency IDentification (RFID) are reported to deliver efficient identification and tracking solutions (LogicaCMG2004) which could lead to improved visibility, more efficient processes and a higher turnover. In fact, RFID has already been successfully deployed for some closed-loop and high-value RTI applications such as container management in the auto-motive industry. However, the application of RFID for efficient inter-organisational management of high volumes and low value RTIs (such as pallets in the RTI industry) imposes a different set of challenges and has yet to be explored. The goal of this paper is therefore to investigate the impact of RFID technology on the RTI management in this context. Our key contributions are (1) a description of a solution based on RFID technology and (2) the quantification of the financial impact from each individual stakeholder’s perspective.
Research question and methodology
We aim to answer the following research question: What is the impact of RFID technology on inter- organisational RTI pool management processes? To answer this research question, we will use a combined case study and simulation approach. The advantage of this multi-method study is that each approach can be used in a complementary way to address the qualitative and quantitative aspects of supply chain management research (Hellström and Nilsson2006). Our case study is based on research work conducted with a major pool operator, a large FMCG (Fast Moving Consumer Goods) manufacturer and a key supermarket
retailer. We focus explicitly on the use of wooden pallets in the retail industry with a geographical focus within Europe. Data was collated using a semi-structured interview process drawing on a prepared set of open questions. Potential effects of RFID technology on the RTI management process and on the individual stakeholders were elicited from existing RTI literature and discussed in several meetings with the employees (mainly logistic managers, CIOs and CEOs) of participating companies. Based on the case study and the cost parameter estimates, we have built a simulation model to quantify the impact as well as to assess the robustness of RFID technology on RTI management.
The paper is structured as follows. First, we will give an overview about related work and then outline the technological background for the application of RFID technology in RTI management. Next, we will present the results and findings of our case study. Finally, we will quantify the outcome of the simulation analyses and conclude our study.
Related work
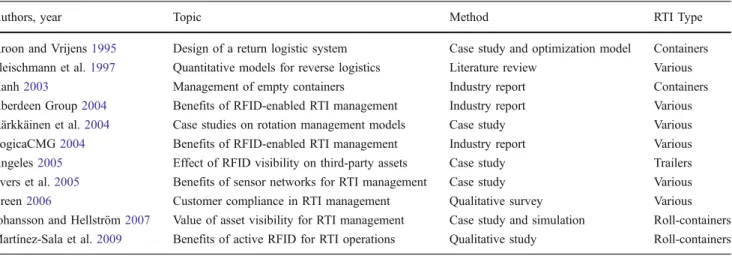
An overview of articles in the field of RTI management from practice and academia is listed in Table 1. Besides qualitative practitioner reports (e.g., Aberdeen Group2004; LogicaCMG 2004) only a few scholarly publications exist that quantify the effect of RFID-based visibility in the RTI industry. Angeles2005investigated a retail RTI case study in which RFID technology was implemented to reduce shipment delays with rented RTI assets. The results showed that as much as 80% of detention and demurrage charges could be reduced through RTI visibility. As one of the first studies, Johansson and Hellström 2007, have highlighted the relevance of RTI losses in conjunction with RTI visibility. They conducted a case study with high-value
Table 1 Overview of related work in the field of RTI management
Authors, year Topic Method RTI Type
Kroon and Vrijens1995 Design of a return logistic system Case study and optimization model Containers Fleischmann et al.1997 Quantitative models for reverse logistics Literature review Various
Hanh2003 Management of empty containers Industry report Containers
Aberdeen Group2004 Benefits of RFID-enabled RTI management Industry report Various Kärkkäinen et al.2004 Case studies on rotation management models Case study Various
LogicaCMG2004 Benefits of RFID-enabled RTI management Industry report Various
Angeles2005 Effect of RFID visibility on third-party assets Case study Trailers
Evers et al.2005 Benefits of sensor networks for RTI management Case study Various
Breen2006 Customer compliance in RTI management Qualitative survey Various
Johansson and Hellström2007 Value of asset visibility for RTI management Case study and simulation Roll-containers Martínez-Sala et al.2009 Benefits of active RFID for RTI operations Qualitative study Roll-containers
roll-cages and showed that a cost reduction of 34% was possible as a result of enhanced RTI visibility. One of their key conclusions is that further research is required for assessing the effect of asset visibility in a large-scale RTI pooling system.
Background
In order to counter the previously described problems in RTI management, a technology is required that delivers identification and tracking capabilities in order to increase the visibility of RTI items. A basic technology for tracking, which has been in use for decades, is the barcoding system. However, a more advanced technology for serial-level identification and tracking is RFID technology. RFID has the distinct advantage of providing (1) automatic identifi-cation capabilities that do not require a line of sight, (2) high read rates suited for industry-scale operations and (3) standards for managing tracking data.
Given that RTIs need to be managed while they are in circulation among several different companies, it is therefore necessary to capture the data in a consistent manner throughout the entire supply chain. The EPC-global network standards (EPCEPC-global 2007) combine RFID tags, tag reader technology and the associated middleware which together caters for the needs of identification, data capture and data exchange in a stand-ardised process.
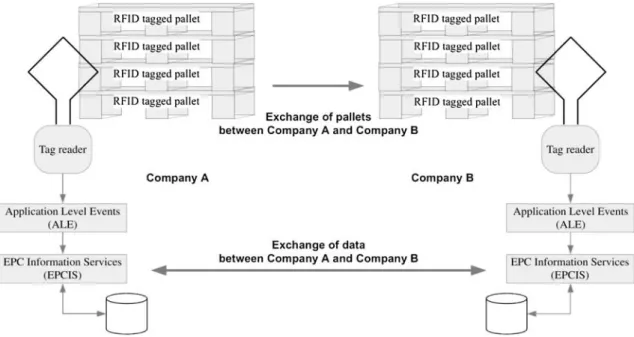
Figure 1shows the basic components of an EPCglobal network implementation for capturing the individual
GRAI (Global Returnable Asset Identifier) of the pallets as they leave one company and arrive at another. At each strategic point of the supply chain network (where there is loading, unloading or counting of pallets), there will be a pre-installed RFID read-point (i.e. an RFID reader with a suitable aerial). With that, whenever an RFID-enabled pallet is within the range of a read-point, a read event would hence be generated recording the location, time-stamp and GRAI of the pallet. For example, (1) an RFID reader could be mounted on a forklift truck which is capable of reading the pallets’ RFID tags as they are being loaded or unloaded from a vehicle, or, (2) the RFID tagged pallets on a moving vehicle could be read simultaneously as they pass through an RFID enabled portal located at the various supply chain facilities. These approaches could, as such, bring about a high level of automation with regards to the management of RTIs in the supply chains.
Case study
This case study focuses on a typical RTI scenario in the retail industry. An FMCG manufacturer rents pallets from a pool operator. The manufacturer places goods on the pallets and ships them to a retailer. After the goods are removed from the pallets, the empty pallets are collected by the pool operator and prepared for subsequent hire. Although all parties are responsible for the overall efficiency of the RTI management process, generally only the manufacturer is charged for the costs of the pallet rental by the pool
Fig. 1 Movement of RFID tagged pallets and exchange of data (components represent typical parts of an RFID system ranging from a database of events to a tag reader with an antenna)
operator. The retailer is, however, indirectly affected because the manufacturer can incorporate these costs into the selling price of the goods. In the following, we will describe, in greater detail, the parties involved in the RTI process together with their roles, properties and typical problems pertaining to the management of RTIs. Next, we will outline the RTI management model as it is today, its key issues and potential improvement areas as a result of RFID technology.
Key RTI stakeholders RTI pool operator
The RTI pool operator offers what they term a one-way trip which includes a full-service for their wooden pallets, rather than the more basic exchange process. They also manage all the information relating to the pallet movements for their customers. The pool operator is responsible for supplying the FMCG manufacturer with sufficient empty pallets as well as recovering pallets which have been moved to an agreed drop-point for collection. Once collected and returned to a regional depot, the pallets are then passed to a sorting or grading process. Repairs are also carried out, where necessary, before they are made available for subsequent hire.
The network of depots and customer sites for the RTI pool operator under study is as follows:
& 500 customers across 8 countries & 2,000 customer sites
& 57 depots for the distribution, reception, sorting and maintenance of pallets
& 20,000 drop-points which are mapped to respective customer locations
The operator has a total stock of about 12 million pallets which can generate approximately 48 million pallet movements annually. Note that all of its operations are currently outsourced to third party companies. The operator can hence be regarded as being an information business that simply owns the pallets, handles the data for the customers and makes purchases of new pallets as and when required.
Fast moving consumer goods manufacturer
The FMCG manufacturer is a representative example of a large multinational organisation that not only owns several brands but also handles a diverse range of products. Their prime need of the pallets is for the transferral of goods at the end of the production lines from the various factory sites. Palleted goods are then stored at one of the manufacturer’s major distribution centres before
down-streaming them through the supply chain to their custom-ers’ warehouses or distribution centres.
Note that that the pool operator has no knowledge of when the pallets are being used by the manufacturer and is only advised when a quantity of pallets has left for the customer/retailer sites. The operator recognised the fact that without a unique identifier associated with each pallet, it would be difficult to introduce significant efficiency to the current processes. The manufacturer has also recognised that there would be a benefit in having a reliable and automated means of counting pallets at strategic points and knowing which type of platform (shelf-ready unit, pallet, etc) the goods had been stacked on.
Supermarket retailer
The supermarket retailer in this study has an extensive chain of large, medium and small stores. The larger stores have a significant volume of goods arriving and as such the recovery of pallets by the pool provider is generally not an issue. The pool provider will also have some insight as to when there is a sufficient quantity to justify the transport. The smaller stores, on the other hand, will receive comparatively fewer pallets and might not merit a regular collection when the relative costs are taken into consideration.
The date by which the pallets leave the manufacturer’s distribution centres effectively marks the end of the hire period. When the pallets arrive at the retailer’s sites they are credited to the retailer’s account although, in practice, they do not normally incur charges for the pallets in their possession. When the retailer frees up the pallets, they are then set aside for collection by the pool operator. Major retailers will generally know the flow-through of the pallets and have an appropriate arrangement with the pool operator for their periodic collection. However, not all of the retailers will have an arrangement or account with the pool operator. In such cases, pallets might be handled on an exchange basis; for example, if 20 loaded pallets are delivered, 20 empty pallets will be taken back in exchange. Although there are collaborative arrangements in place between the pool operator and the retailer, there is no guarantee that there will be any timely return of the pallets. In addition, it is difficult to accurately estimate the quantity of pallets that are held by the retailer at each of their locations.
RTI management model
A representative RTI flow process, based on the above study, is as depicted in Fig. 2. It outlines a single cycle of pallet movement from the manufacturer to the retailer before it is returned back to the operator. In the following
sections, we will detail the five constitutional elements (delivery, use, collection, maintenance and management) that are fundamental to a typical RTI flow process. Delivery of empty RTIs
The RTI pool operator must always ensure that it has adequate empty RTIs to be delivered to the FMCG manufacturer in order for them to store and send goods along the supply chain. The key issue here is therefore to determine when and how many pallets are needed to be delivered to the appropriate FMCG manufacturer’s location(s).
In the above case study, the RTI pool operator has based its delivery planning on orders and forecasts of the FMCG manufacturer. Historical data analysis has also been used to cope with seasonality patterns or promotional periods. But as the RTI pool operator has no timely information about the pallets that are shipped out from the manufacturing site, the actual inventory of the FMCG manufacturer’s RTI stock is thus often unknown. As a result, and in combination with demand amplification or other unexpected events, the RTI pool operator is required to increase the buffer stock, which consequently leads to an increase in its locked-up capital. With RFID technology, the current practice can be improved in the following way. By having automatic RFID reads of outgoing and incoming pallets (e.g., via RFID readers deployed at the dock doors), timely information of the manufacturer’s actual RTI stock can be made available.
Thus, instead of relying on (sometimes too late) orders from the FMCG manufacturer, the RTI pool operator can optimise and automate the manufacturer’s replenishment process based on the actual RTI stock data. Moreover, as the level is much more reliable and closer to actual consumer demand, problems such as the bullwhip effect can be eliminated; and through the increased visibility of RTIs in the supply chain, the flow of RTIs also becomes more predictable. ln addition, with the availability of the dynamic RTI stock and movement data, the load utilisations of the delivery vehicles can be improved and any unnecessary ‘emergency purchases’ of RTIs can be avoided.
Use of (loaded) RTIs
At the FMCG manufacturer’s site, the empty RTIs are loaded with goods and shipped onwards to the downstream supply chain. During this period, the RTI pool operator has limited control over its RIls, and generally has no or fairly limited knowledge about the whereabouts and condition of the RTIs. As a result of this lack of RTI visibility, there are typically two main problems faced by the RTI pool operator: & Damage of RTIs: One of the key reasons why all the
pallets are returned to a depot is so that they can be sorted, checked and repaired as necessary. This is because, at times, there can be up to 20–30% of pallets that are damaged per cycle and most of these require repair. Without any unique serial identification associ-ated with the pallets, it is also impractical to trace the Fig. 2 Typical RTI process flow (boxes represent supply chain parties and arrows represent logistic flows of RTIs)
source of the damaged pallets to the originator since most of the empty pallets are accumulated from a number of different drop-points.
& Loss of RTIs: lt is estimated that the loss of RTIs for certain drop-points can be as high as 50%. Without any track & trace capability, it is also difficult to identify any systematic losses within the supply chain. Ihe issue of pallet losses can be the result of a number of factors. Some of these are: (1) the pallet count at the end customer/drop-point can be inaccurate, (2) there is no contractual agreement with regards to the drop-points and so reliance on collaboration is often required, (3) there can be unrecorded pallet movements between drop-points or (4) the pallets might have been reused for other purposes.
With RFlD technology, the current practice can be improved in the following way. For clarity, Fig. 3 depicts the three domain boundaries describing the responsibilities and interests of the various key stakeholders involved in the RTI management process. lt should be noted that each domain can contain a single node or multiple nodes pertaining to the stakeholder. For instance, the manufacturer can have either a single factory site or a network of interconnected sites where the pallets are transferred and moved about. But what is fundamental to the figure is the transition from one region to the adjacent region as this effectively marks the boundaries of responsibility and interests as well as the charging process. With the set-up of RFID readers, clear accountability can hence be established at each of the domains. Figure 3 denotes the minimum set of points (i.e. a set of three inbound RFID read points or a set of three outbound RFID read points) for any form of automation using RFID; but this relies on the adjacent parties being willing to share their data. To resolve this, a minimum set of six inbound and outbound read
points could be employed simultaneously to create data independencies between the domains. Additional RFID read points set up within the regions could also add greater scope for optimisation (e.g., highlighting areas of excessive dwell times) and augment a better track and trace capability by using the GRAIs associated with the RTIs.
Collection of empty RTIs
The collection of empty pallets is a rather complex process. The RTI pool operator needs to know when and where to collect the pallets. The key challenge is to optimise the collection runs so that logistic costs are minimised and that the RTI pool operator’s buffer stock is adequate.
The current practice to initiate the collection is as follows: (1) the supply chain parties declare when RTIs are ready for collection or (2) the RTI pool operator carries out ‘best guess’ collection runs. The problem with the declaration by the supply chain parties is that the incentive for timely and accurate reporting is fairly low. For instance, a retail store might just declare the collection of RTIs if they take up excess space and hence need to be removed immediately. However, collections from some of the smaller drop-points are in most cases not economically feasible. Thus, the RTI pool operator often has to pay a so-called‘retail fee’ to allow the retailer to move its RTIs to a bigger drop point (e.g., a distribution centre), so that they can be collected more efficiently by the RTI pool operator. Apart from that, if a multiple drop-point collection run is conducted, it is also no longer possible to determine which pallets are originally issued to which FMCG manufacturer and thus the invoicing process is often slowed down or requires corrections.
With RFID technology, the current practice can be improved in the following way. Due to automatic RTI identification and notification upon reaching a drop point, the RTI pool operator can better schedule and collate its collection trips. Besides collection route optimisation, it can also provide decision support to determine whether it is economically feasible to pay the retail fee or to collect the RTIs themselves. The unique identification of each RTI can also ensure clear accountability of each of the pallets and help in evaluating the number of outstanding RTIs held by each stakeholder accurately. In addition, the invoicing can also be performed in a faster way and individual penalties (due to, for instance, lengthy dwell-times) can be accounted for properly.
Maintenance of RTIs
All returned empty pallets are counted and graded in order to ascertain whether repairs are needed or if any additional pallets need to be purchased. The key question is how to Fig. 3 The three domains of responsibility and interest for RTI
efficiently count, grade and sort the pallets upon receipt and determine corresponding repair actions accordingly.
The current practice is highly manual, time-consuming and error prone. The condition of the pallets, which normally arrive in bulk, is dependent on the way they have been used and the customers that have been using them. None of this information can currently be ascertained with any certainty as there is no easy means of determining (1) the product that has been associated with the pallets and (2) where the pallets might have been used or stored. For example, if a pallet has been used to transport packets of dry foodstuff or cardboard packaging material, then the pallet is likely to have been stored in a clean and dry condition. However, if a pallet has been used to transport items that are inherently heavy or stored outdoors, then there is a high probability that the pallet might have sustained damage or be wet and dirty. In fact, it is common for a large percentage of wooden pallets to require maintenance, as a result of either protruding nail heads or broken component parts which need to be replaced.
With RFID technology, the current practice can be improved in the following way. Pallets can be counted in an efficient manner due to automatic read count and identification. The grading and sorting operation can also be upgraded to a semi-automatic process. Assets, based on their previous usage and age, can be identified quickly and the manual grading process can be augmented with detailed product lifecycle information. In summary, RFID can help to automate and speed up maintenance decisions and its corresponding actions. Such efficiency can result in a quicker update of the usable RTI stock count and thus help to minimise the RTI pool operator’s buffer stocks or emergency purchases.
RTI information management
The RTI information management is primarily concerned with the tracking and tracing of where the pallets currently are and the detection and identification of the status they are in. This process is heavily information-driven and is key to proper stock management and control and in determining if any additional purchases of RTIs are required. The main role here is to try to optimise (i.e. reduce) the cycle times of RTIs so as to maximise the utilisation of the RTI stock capacity.
Existing management processes simply rely on the exchange of information detailing the quantity, location and time data. This information is transmitted using a variety of means (e.g., phone, email, etc) but is not in real-time and is often received after several days or even weeks following a movement of pallets. With the current system, errors are difficult to correct and pallet counts are often imprecise. The result is that a degree of approxi-mation has to be included in initial contracts and requires
monitoring over a period of time to ensure that the charges are equitable. All pallet movements are declared using a variety of messaging formats and email which simply indicate the volume moved and their destination drop-point. These declarations are made weekly or monthly and can often have a delay of about a month. This delay is primarily due to the fact that more immediate declarations might contain errors and, with the current management systems, correcting erroneous declarations is prohibitively expensive. Typically, the data stored on their IT systems is about 13+ days old and this hence also hinders the arrangements for any timely collection of pallets. Consequently, collections are nor-mally arranged manually and at times ad hoc third-party logistics are employed to facilitate the transportation.
With RFID technology, the current practice can be improved in the following way. Automatic data identification and data acquisition can eliminate any errors as a result of manual data entry. All pallet movement data can be captured with a finer granularity and any prediction/analysis can be performed using a more reliable and accurate dataset. Stand-ardised (e.g., EPCIS— EPC Information Service) event data can also help to avoid ambiguous data representations and the need to constantly adapt to different data formats. As RFID event data is dedicated specifically for tracking item move-ment data, unnecessary dependencies due to, for instance, extraction of data from invoices or other transactional related documents such as Advanced Shipping Notices (ASN) are removed. Hence, costly data acquisition processes across multiple mediums can be avoided and data can be made available in a timely manner for optimising stock and replenishment decisions.
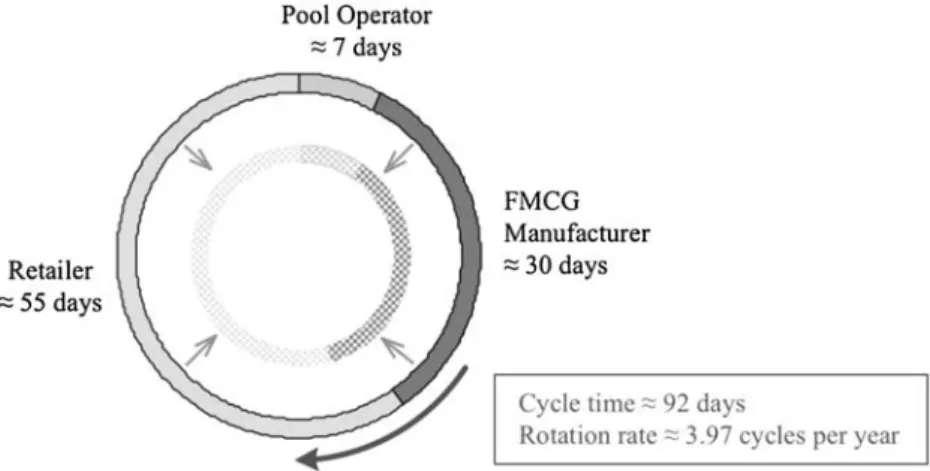
Another important aspect is the impact of RFID on rotation rate. Rotation rate is a critical business metric in the RTI industry and is calculated based on the average round trip time of an asset. The time taken for a typical pallet round trip at the various key stages is as illustrated in Fig. 4. Its detailed round-trip data is not available but it is known that there are variations in cycle times between (1) the different individual stakeholders and (2) the type of goods that are loaded onto the pallets. Nevertheless, the given data in the figure, as derived from our case study, provides an indication of the mean duration at each stage; but no distributions around the means are available. As can be seen from the figure, unnecessary delays along the round trip can be removed to reduce the cycle time significantly. To be conservative in our analysis, we have only assumed a rotation rate improvement from a non-RFID scenario to a RFID scenario to be about 3.97 to 4.62 cycles per year respectively. This is mainly attributed to replacing the manual data acquisition process (which currently creates a 13+ day delay in the cycle time) with a timely RFID-based information sharing system.
Cost and benefit analysis Rental cost model
The costs that are charged to customers are currently based on an individual single-trip fee plus the pool operator’s gross margin. The trip fee is based on the previous year’s historical pallet movement data (e.g., rotation rate, loss rate, repair rate). As explained in the
previous section, RFID has an impact on several of the cost parameters. For our cost benefit analysis, we will use the cost calculation structure of the pool operator in our case study with parameters as described in Table 2. We will also use additional parameters as listed in Table3 to model the RFID impact over the existing cost structure and parameters.
The trip fee is calculated based on the following formula: Trip free¼CACCT 365 LT |fflfflfflffl{zfflfflfflffl} Asset costs þ C|fflfflfflfflfflfflffl{zfflfflfflfflfflfflffl}DCþ CCC Logistic costs þ C|fflfflfflfflfflfflfflfflfflfflfflfflfflfflfflfflffl{zfflfflfflfflfflfflfflfflfflfflfflfflfflfflfflfflffl}SCþ BR CRCþ COM Maintenance costs þ LR C|fflfflfflfflfflfflfflfflfflfflfflfflfflfflfflfflfflfflffl{zfflfflfflfflfflfflfflfflfflfflfflfflfflfflfflfflfflfflffl}ð ACþ CTCþ CDCÞ Loss costs þ |ffl{zffl}CDM RTI Mgmt: costs
When using the base case values of Table 2 and Table3, the trip fee is found to amount to 2.70€ for the non-RFID scenario and 2.10€ for the RFID scenario. The reduction of 22% in the trip fee is in line with the results reported by Angeles 2005, who has also ascertained similar significant reduction in rental fees as a result of RFID technology.
Sensitivity analysis
The results in the above cost model analysis have indicated that RFID has a considerable potential to lower the costs in a RTI rental system. This finding is, however, based on the above tabulated set of base case parameter value settings derived from the experts in the field. To be objective, we
Description Variable Base case value Range (min/max)
RTI asset costs [€] CAC 10.00 8.00–12.00
Life-time RTI asset [years] LT 10 8–10
Cycle timea[days] CT 92 74–110
Delivery costs [€/rotation] CDC 0.69 0.55–0.83
Collection costs [€/rotation] CCC 0.17 0.14–0.20
Sorting costs [€/rotation] CSC 0.38 0.30–0.46
Repair costs [€/repair] CRC 2.00 1.60–2.40
Other maintenance costs [€/rotation] COM 0.08 0.06–0.10
RTI data management costs [€/rotation] CDM 0.64 0.51–0.77
Breakage rate [%/rotation] BR 3.00 2.40–3.60
Loss rate [%/rotation] LR 4.00 3.20–4.80
Table 2 Simulation parameters and the selected value ranges for our case study
a
Cycle time¼ Working daysRotation rate; as-suming 365 working days per year in our simulation study. Fig. 4 Reduction in cycle time for increased RTI utilisation
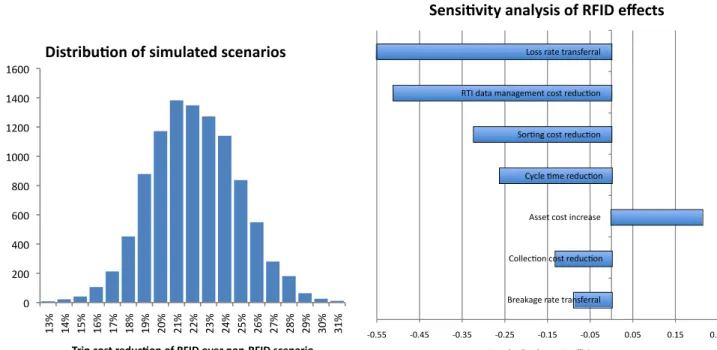
have thus conducted a Monte Carlo simulation study to assess the sensitivity of the results. As our tabulated data only provides an indication of the base case value and ranges of the parameters, we have chosen triangular distributions, which are commonly used in Monte Carlo simulations, for modelling uncertainties in the input parameters. Based on the parameter ranges as specified in Table2and Table3, 10,000 randomly instantiated scenarios were simulated to compare and contrast the performance of the non-RFID and the RFID scenarios. The outcome of the study is as depicted in Fig.5. As shown in the left figure, the trip fee cost reduction in our case study is seen to be rather robust to the variations in the input parameters. Its mean value is about 22.1%; and with 99% confidence, the cost reduction is greater than 15%. It is also observed, from the right figure, that the main factors contributing to the trip fee cost reduction stems from the transferral of loss costs and the cost reductions in RTI data management. Surpris-ingly, the RFID tag costs (asset cost increase) seem to play a minor role in the present case study.
Investment cost assessment
The sensitivity analysis has explored the reliability of the results in different scenario settings as well as analysing the sensitivity of the various key impact factors. While the previous investigation is aimed primarily at the trip fee cost model and its resulting cost reductions, we will now assess the total financial impact by examining the case from each of the individual stakeholder perspectives. The investment aspects required for the RFID infrastructure will also be accounted for in this assessment.
Pool operator perspective With RFID, the pool operator has the potential to apportion the main financial risks (loss and breakage) more accurately between the relevant parties. Parties that manage their RTIs carefully can benefit from significant trip fee reductions and allowing them to be more competitive. The effect from an RTI asset investment perspective is outlined in Table 4. Due to an improved utilisation of the assets, the reduced cycle time in the RFID
Fig. 5 Results of 10,000 randomly instantiated simulation scenario runs
Description Impact on variablea Base case value Range (min/max)
Asset cost increase (RFID tag) [€] C’AC=CAC+X 1.00 0.50–10.00
Cycle time reduction [days] CT’=CT-X 13 0–30
Collection cost reduction [%] C’CC=CCC(1-X) 15 0–30
Sorting cost reduction [%] C’SC=CSC(1-X) 15 0–30
RTI data management cost reduction [%] C’DM=CDM(1-X) 15 0–30
Breakage rate transferral [%] BR’=BR (1-X) 80 60–100
Loss rate transferral [%] LR’=LR (1-X) 80 60–100
Table 3 RFID impacts on sim-ulation parameters with base case and min/max values based on interviews
a
where X is the impact variable brought about by the introduc-tion of RFID technology
scenario can lead to a reduction of about 14.1% in the pool operator’s overall RTI stock size. This translates to a total RTI asset investment reduction of about 6.7 € million (−5.5%). Of course, the pool operator has to put in additional investments for the RFID infrastructure. When taking into account the capital expenditures of 342,000 € for equipping all the 57 depots with RFID readers and costs for RFID software and training of 200,000 €, it hence becomes obvious that the investment needed at the pool operators’ sites is considerably smaller in comparison to the savings that can be achieved from the stock size reduction. However, in our present case study, the pool operator already has an RTI stock size of 12 million assets and thus faces considerable adoption challenges. For instance, it is difficult to equip all of its RTIs at once with RFID tags while still maintaining normal operation. The stepwise introduction of RFID with a mixture of RFID and non-RFID RTI assets is likely to incur additional costs which have not been considered in this present study.
FMCG manufacturer and retailer perspective One of the key advantages of RFID technology is that clear account-ability can be established and thus costs for breakages or losses can be billed separately. Table5compares the effects of RFID from a manufacturer’s perspectives in a typical FMCG setting (5 manufacturing sites, 100,000 trips per year). By using estimated loss and breakage rates, we have made a distinction between a bad, average and good customer of s RTI pool operator. As the actual pool operator’s sales margin is confidential and the trip fee is negotiated with each individual customer, we simply
assume a margin surcharge of 0.30 € per trip. The results show net cost savings of 6.6% or even 15.1% for the average and good customer respectively. The bad customer in the RFID scenario is worse off and would pay 1.8% more as compared to the non-RFID scenario. As high loss and breakage rates are often tied to inefficient processes, the bad customer thus has an incentive to focus on its weak points. In order to improve the competitiveness of the whole supply chain, the pool operator might offer training or specific starting points for improving these inefficien-cies. The additional costs incurred in the RFID scenario due to the deployment of RFID readers is estimated to be about 10,000 €/site. Thus, for the good customer, the additional investment is already amortised within the first year. Considering that manufacturers will deploy RFID infra-structures to improve their stock management and product traceability rather than solely for RTI management, the RFID-based RTI application can be seen as a value-add to their existing processes.
Although the retailer is no direct customer of the pool operator, the implications are similar to the ones for the FMCG manufacturer. The reason is that the costs for RTI handling are incorporated into the purchasing costs of the manufacturer. Once the technology is in place, several flexible billing models can now be made possible. For instance, the retailer could be billed for each damaged or lost pallet within his domain of responsibility. Or, due to automatic identification of the RTIs, the retailer could be required to pay a deposit for each individual pallet on receipt and get the deposit back if the pallet is still in a good condition upon collection.
Description No RFID RFID Change
Sold trips per year [#] 48,000,000 48,000,000
Rotation rate [# trips/asset] 3.97 4.62 +16.5%
Number of RTI assets [#] 12,098,630 10,389,041 −14.1%
Purchasing costs per asset [€] 10 11 +10%
Total RTI asset investment [€] 120,986,301 114,279,452 5.5%
Table 4 Impact of RFID on RTI asset investment
Description Bad customer Average customer Good customer
Loss rate [%/trip] 6.0 4.0 2.0
Breakage rate [%/trip] 5.0 3.0 1.0
Breakage and loss costs caused [€] 65,450 40,070 14,690
Trip costs with RFID [€] 240,000 240,000 240,000
Net trip costs with RFID [€] 305,450 280,070 254,690
Net trip costs without RFID [€] 300,000 300,000 300,000
Net change for customer +1.8% −6.6% −15.1%
Table 5 Financial impact as-sessment by customer type for 100,000 trips per year
Conclusions
This paper has explored, for the first time, the impact of RFID technology on a high-volume and low-value RTI management model. By using a representative case study in the retail industry, we have shown how RFID can change existing RTI management processes and how it can make the management of RTIs more efficient. By quantifying the impact from a financial perspective, it is apparent that significant cost savings of about 22% in the trip fee and 5.5% in the asset investment can be achieved as a result of RFID technology. The former is mainly due to factors such as the transferral of loss costs and the cost reductions in RTI data management; and the latter is primarily due to the improvement in the overall RTI cycle time. In addition, our study has also found that, with the increased RTI visibility and measurability, customers with high loss or breakage rates have a clear incentive to avoid unnecessary penalties brought about by their poor processes. As a consequence, the problems of asymmetric information can be reduced and the whole system becomes more efficient. In this aspect, the RTI pool operator can play an important role in the whole RTI management processes. Being an informa-tion management entity, it can help in analysing, diagnosing and optimising the RTI flow movements in the entire distribution network. Not only that, it can also act as the central coordinator in initiating improvements among the various key stakeholders, which can hence lead to an increase in the overall effectiveness of the RTI supply chain network.
Because we limited our scope to a renting model for high volume, low value RTIs (pallets) in the FMCG industry, future research should explore the applicability to different supply chain structures, RTI types, industries, and business models. Since every simulation model is a simplification of the real world, trials and real world deployments should be used to verify the actual value in practice. In this context, a particular challenge is the transition from a non-RFID to a RFID-based management model. It is quite cost-intensive and time-consuming for a pool operator to equip a whole existing pallet pool with RFID transponders. Finally, we see several promising research opportunities in the optimal design of contracts based on the dramatically improved loss and breakage visibility. In this sense, RFID can have a truly
transforma-tional effect on the RTI industry and enable unprecedented efficiency gains for RTI management.
References
Aberdeen Group. (2004). RFID-enabled logistics asset management benchmark report. Boston: Aberdeen Group.
Angeles, R. (2005). Rfid technologies: supply-chain applications and implementation issues. Information Systems Management, 22(1), 51–65.
Breen, L. (2006). Give me back my empties or else! A preliminary analysis of customer compliance in reverse logistics practices (UK). Management Research News, 29(9), 532–551.
BRIDGE. (2007). Returnable transport items: The market for EPCglobal applications. Brussels: Building Radio frequency IDentification solutions for the Global Environment.
EPCglobal. (2007). Architecture framework v. 1.2. Brussels: EPCglo-bal.
Evers, L., Bijl, M. J. J., Marin-Perianua, M., Marin-Perianu, R., & Havinga, P. J. M. (2005). Wireless sensor networks and beyond: A case study on transport and logistics. Paper presented at the International Workshop on Wireless Ad-Hoc N.
Fleischmann, M., Bloemhof-Ruwaard, J. M., Dekker, R., van der Laan, E., van Nunen, J. A. E. E., & Van Wassenhove, L. N. (1997). Quantitative models for reverse logistics: a review. European Journal of Operational Research, 103(1), 1–17. Hanh, L. (2003). The logistics of empty cargo containers in the
Southern California region. Los Angeles: University of Southern California.
Hellström, D., & Nilsson, F. (2006). Combining case study and simulation methods in supply chain management research. Paper presented at the Proceedings of the 15th Annual IPSERA Conference.
Johansson, O., & Hellström, D. (2007). The effect of asset visibility on managing returnable transport items. International Journal of Physical Distribution & Logistics Management, 37(10), 799– 815.
Kärkkäinen, M., Ala-Risku, T., & Herold, M. (2004). Managing the rotation of reusable transport packaging-a multiple case study. Paper presented at the Thirteenth International Working Seminar on Production Economics, Igls, Austria.
Kroon, L., & Vrijens, G. (1995). Returnable containers: an example of reverse logistics. International journal of physical distribution and logistics management, 25, 56–56.
LogicaCMG. (2004). RFID benchmark study– making waves: RFID adoption in returnable packaging. Hoofddorp: LogicaCMG. Martínez-Sala, A. S., Egea-López, E., Sánchez, F., &
García-Haro, J. (2009). Tracking of Returnable Packaging and Transport Units with active RFID in the grocery supply chain. Computers in Industry, 60(3), 161–171.
Ray, C. D., Zuo, X., Michael, J. H., & Wiedenbeck, J. K. (2006). The lean index: operational “lean” metrics for the wood products industry. Wood and Fiber Science, 38(2), 238–255.