Original article
Rates and e ffi ciencies of reactions of ruminal biohydrogenation of linoleic acid according to pH
and polyunsaturated fatty acids concentrations*
Annabelle T roegeler -M eynadier
a**, Lydie B ret -B ennis
b,
F. E njalbert
aaDépartement Elevage et Produits, Laboratoire d’Alimentation, École Nationale Vétérinaire, 31076 Toulouse, France
bDépartement des Sciences Biologiques et Fonctionnelles (UMR 1225), École Nationale Vétérinaire, 23 chemin des Capelles, BP 87614, 31076 Toulouse, France
(Received 22 February 2006; accepted 25 September 2006)
Abstract –Data from a previous study about the effects of pH and of linolenic acid (C18:3n-3) and linoleic acid (C18:2n-6) concentrations on C18:2n-6 biohydrogenation in ruminal cultures were used to calculate the rates and efficiencies of the three reactions of C18:2n-6 biohydrogenation (isomerisation of C18:2n-6 to CLA; reduction of CLA totrans-octadecenoic acids; reduction of trans-octadecenoic acids to stearic acid). First, low pH was confirmed to inhibit isomerisation and was shown to inhibit the second reduction, leading to an accumulation of vaccenic acid. This later effect had only been observed in some in vivo studies using high concentrate diets, because in in vitro experiments, the very low pH frequently used depresses isomerisation which consequently generates very low amount of substrates for reductions whose variations become difficult to ascer- tain. Second, C18:2n-6 at high concentration was confirmed to saturate its own isomerisation and the increase of CLA production due to high initial C18:2n-6 was shown to inhibit the two subsequent reductions. Third, C18:3n-3 at high concentrations was confirmed to inhibit C18:2n-6 isomerisa- tion. Moreover, the second reduction was shown to be saturated, probably by alltrans-octadecenoic acids intermediates of C18:2n-6 and C18:3n-3 biohydrogenation, leading to an accumulation of trans-octadecenoic acids, especially vaccenic acid. This fatty acid is partly desaturated into CLA in the mammary gland, which explains the synergy between C18:2n-6 and C18:3n-3 for milk CLA noticed by others in vivo. This approach helped explain the actions of pH and of C18:2n-6 and C18:3n-3 concentrations on C18:2n-6 biohydrogenation and allows some explanations about differ- ences noticed between studies.
rumen/biohydrogenation/reactions/efficiency/rate/CLA
* Raw data, without enzymatic calculation, were already published in a previous article: Troegeler- Meynadier A, Nicot MC, Bayourthe C, Moncoulon R, Enjalbert F. Effects of pH and concentrations of linoleic and linolenic acids on extent and intermediates of ruminal biohydrogenation in vitro. J Dairy Sci 2003, 86: 4054–4063.
** Corresponding author: a.troegeler@envt.fr
Article published by EDP Sciences and available at http://www.edpsciences.org/rndorhttp://dx.doi.org/10.1051/rnd:2006046
1. INTRODUCTION
Conjugated Linoleic Acid (CLA) is a collective term for positional and geomet- ric isomers of linoleic acid (C18:2n-6) with conjugated double bonds. Among them, cis9,trans11-CLA andtrans10,cis12-CLA present some health benefits in a number of animals models [1, 2]. The first studies car- ried out on humans seemed to indicate that CLA would also be effective on humans’
health, but the results are still controver- sial [2].
In dairy milk, CLA has two origins.
A minor source of CLA is the micro- bial ruminal biohydrogenation (BH) of C18:2n-6 [3, 4]. However most of the CLA in milk originates from mammary desaturation oftrans11-octadecenoic acid (trans11-C18:1), also called vaccenic acid, to cis9,trans11-CLA [5]. This fatty acid is another intermediate of ruminal BH of C18:2n-6, and an intermediate of rumi- nal BH of linolenic acid (C18:3n-3) too.
As a consequence, the factors affecting C18:2n-6 BH would be able to modulate the contents of CLA andtrans11-C18:1 in the rumen, and subsequently the content of CLA in milk. Ruminal pH and PUFA amounts are known to significantly affect C18:2n-6 BH [6].
The C18:2n-6 BH is divided into three steps [4]: first an isomerisation, mediated by several isomerases that produce differ- ent CLA isomers [3], then a first reduction producingtrans-octadecenoic acids (trans- C18:1), and a second reduction produc- ing stearic acid (C18:0). In our in vitro study [6] and in other in vitro studies [7, 8]
low pH led to a decrease of CLA and trans11-C18:1 production in the rumen.
However, in some in vivo studies [9, 10], using high concentrate diets favouring a low pH in the rumen, CLA and trans11- C18:1 increased in duodenal content and in milk, contradicting other in vitro stud- ies. The addition of greater quantities of C18:2n-6 led to an increase of CLA and
trans11-C18:1 productions in all studies, but a lot of hypotheses of mode of action have been proposed: inhibition [11, 12] or saturation [6] of the isomerase, or inhi- bition of the reductases [3, 13, 14]. The addition of high quantities of C18:3n-3 did not lead to an increase of CLA nortrans11- C18:1 in our in vitro study [6], but in vivo a ration rich in linseed oil significantly en- hances CLA andtrans11-C18:1 content in milk [15, 16].
The purpose of this paper was to de- termine the actions of pH and PUFA on the three reactions of C18:2n-6 BH, and their consequences on the CLA and trans11-C18:1 productions in the rumen.
Data obtained from a previous in vitro study about effects of pH (6.0 vs. 7.0) and PUFA (C18:2n-6 and C18:3n-3) amounts on C18:2n-6 BH had been analysed with a first order kinetics approach [6]; this assumes that the rates of reactions are constant over time, which means that sub- strates and products have no effect on the three reactions of C18:2 BH. In the present paper, the rates and the efficiencies of the three steps of C18:2n-6 BH were calcu- lated, which allows investigations on pos- sible effects of substrates or BH products.
2. MATERIALS AND METHODS 2.1. In vitro cultures
In vitro cultures were described in a previous paper [6]. Three in vitro ex- periments were conducted using ruminal cultures to investigate the effects of pH and of C18:2n-6 and C18:3n-3 concentrations on C18:2n-6 BH. A first experiment (Experiment 1) examined the effect of pH on C18:2n-6 BH. A second experiment (Experiment 2) studied the effects of the initial concentration of C18:2n-6 on its own BH. A last experiment (Experiment 3) explored the effects of a high initial con- centration of C18:3n-3 on C18:2n-6 BH.
In Experiment 1, 100 mg of soybean oil
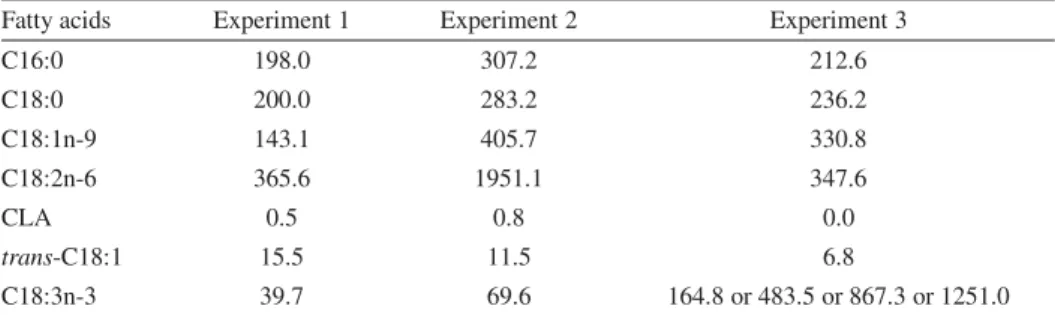
Table I.Initial concentrations (mg.L−1) of palmitic acid (C16:0) and fatty acids with eighteen car- bons in the media.
Fatty acids Experiment 1 Experiment 2 Experiment 3
C16:0 198.0 307.2 212.6
C18:0 200.0 283.2 236.2
C18:1n-9 143.1 405.7 330.8
C18:2n-6 365.6 1951.1 347.6
CLA 0.5 0.8 0.0
trans-C18:1 15.5 11.5 6.8
C18:3n-3 39.7 69.6 164.8 or 483.5 or 867.3 or 1251.0
(365.6 mg.L−1 of C18:2n-6 in culture) were incubated for 2, 4, 8, 16 or 24 h with a low (6.0; LpH) or a high (7.0; HpH) pH.
The buffer solutions were based on phos- phate and bicarbonate: HpH=23.89 g.L−1 of Na2HPO4,12H2O + 9.24 g.L−1 of Na2HCO3, and LpH = 8.72 g.L−1 KH2PO4 + 0.93 g.L−1 Na2HPO4,12H2O +2.31 g.L−1Na2HCO3. In Experiment 2, cultures were incubated for 2, 4, 8, 16 or 24 h with a bicarbonate buffer (pH 7.0;
19.5 g.L−1 Na2HPO4,2H2O+ 9.24 g.L−1 Na2HCO3) and with 451.2 g of grape seed oil representing 300 mg of added C18:2n- 6 (1951.1 mg.L−1). In Experiment 3, cultures were incubated for 6 h with a bicarbonate buffer (pH 7.0; 19.5 g.L−1 Na2HPO4,2H2O+9.24 g.L−1 Na2HCO3) and with 10, 60, 120, 180 mg of added C18:3n-3 (respectively 164.8, 483.5, 867.3 and 1251.0 mg.L−1 in culture), and a constant addition of other fatty acids (FA) including C18:2n-6. For this last experiment oil mixtures (canola, linseed, olive, soybean, grapeseed, tripalmitin) added with (Sigma-Aldrich Chimie, St- Quentin-Fallavier, France) and tristearin (ICN Biomedicals Inc., Orsay, France) were used. The Table I presented the initial concentrations of the principal FA in the media.
Incubations were realized in a waterbath rotary shaker (Aquatron; Infors AG, 4103 Bottmingen, Germany). Ruminal fluid was
Table II.Ingredients and chemical composition of the blend received by fistulated dairy cows.
Ingredients %/M
Maize silage 65.9
Barley straw 15.8
Wheat 4.6
Soja meal 11.3
Minerals and vitamins* 2.4 Chemical composition g.kg−1DM
Crude protein 105
Fat 43
NDF 450
ADF 262
Strarch 211
* 5% P, 14% Ca, 6% Na, 4 g of Zn.kg−1, 3,2 g of Mn.kg−1, 3 g of Fe.kg−1, 0,8 g of Cu.kg−1, 250 800 IU of vitamin A.kg−1, 62 700 UI of vitamin D3.kg−1, 112 UI of vitamin E.kg−1.
obtained from 2 fistulated dry cows receiv- ing 8.5 kg DM of a blend of maize silage and concentrates (Tab. II), plus orchard- grass hay ad libitum. One liter of ruminal fluid was taken from each cow with a vac- uum pump one hour after feeding, and strained through a metal sieve (1.6 mm mesh). The ruminal fluids obtained from the two cows were mixed in a bottle, and transferred (30 min) to the laboratory in anaerobic conditions at 39◦C.
Eighty millilitres of strained ruminal fluid were incubated in 250 mL erlenmeyer flasks containing the added fat, 3 g of de- hydrated alfalfa and 80 mL of a buffer solution. All buffer solutions were pre- warmed at 39◦C and saturated with CO2
when containing bicarbonate. The filled flasks were gassed with CO2and placed in a waterbath rotary shaker (Aquatron, Infors AG, 4103 Bottmingen, Germany) at 39◦C.
They were closed in order to clear out fer- mentation gas without entrance of oxygen, and stirred at 130 rpm, in the dark.
In the three experiments, six replicates, in two or three series of incubations, were realized for each initial concentration of C18:2n-6 or C18:3n-3, each pH, and each incubation time. Incubations were stopped by placing the flasks into iced water, and pH was measured, and the contents of the flasks were immediately frozen. Then, they were freeze-dried (Virtis Freezemo- bile 25; Virtis, Gardiner, NY), weighed, ground and homogenized in a ball mill (Dangoumau, Prolabo, Nogent-sur-Marne, France), and kept at –18◦C until analysis.
2.2. Fatty acids analysis
The FA of residues of incubations were extracted and methylated with the one-step procedure of Sukhija and Palmquist [17], after addition of nonadecanoic acid as an internal standard. This method is known to underestimate cis9,trans11-CLA and trans10,cis12-CLA, so that the results pre- sented in this article can only be used for comparisons within the present exper- iment.
The FA methyl ester were then quanti- fied by GC (Agilent 6890N, equipped with a model 7683 auto injector, Network GC System, Palo Alto, California, USA). The column was a fused silica capillary (CP- Sil88, 100 m × 0.25 mm ID, 0.20 μm film thickness; Chrompack-Varian, Mid- dleburg, Netherlands). Analysis was made
using the method described by Enjalbert et al. [18].
2.3. Calculations and statistics
Concentrations of FA were expressed in mg.L−1. The isomers of CLA and trans-C18:1 measured were respectively the cis9,trans11-CLA and trans10,cis12- CLA, referred as CLA, and the trans11- C18:1 and trans10-C18:1, referred as trans-C18:1. Although about 3% of oleic acid can be isomerised totrans-C18:1 [19–
21], all disappeared oleic acid was consid- ered to be converted to C18:0.
The global rate of a reaction results from the disappearance rate of the sub- strate or the production rate of the product.
Consequently, the rates (mg/L/h) of the three BH reactions (v1, v2, v3) were esti- mated for the different incubation periods by the following formulas:
v1=([C18:2n-6]i– [C18:2n-6]t)/Δt, where [C18:2n-6]iand [C18:2n-6]trepre- sented the concentration of C18:2n-6 at the beginning and at the end of the incubation periodΔt, respectively.
v2=([C18:2n-6]i– [C18:2n-6]t+ [CLA]i– [CLA]t)/Δt
where [CLA]iand [CLA]trepresented the concentration of CLA at the beginning and at the end of the incubation periodΔt, re- spectively.
For Experiments 1 and 2 the C18:3n- 3 initially present was low compared to that of C18:2n-6 (Tab. I): 38% of C18:2 vs. 4.1% of C18:3 for Experiment 1 and 64.4% C18:2 vs. 2.3% of C18:3 for Ex- periment 2 (percentages reported to C16+ C18). As a consequence, for these two ex- periments trans-C18:1 assayed (trans11- C18:1 andtrans10-C18:1) was considered as produced only from C18:2n-6 BH, and v3was estimated as follows:
v3=([C18:2n-6]i– [C18:2n-6]t
+[CLA]i– [CLA]t+[trans-C18:1]i – [trans-C18:1]t)/Δt
where [trans-C18:1]i and [trans-C18:1]t represented the concentration of trans- C18:1 at the beginning and at the end of the incubation periodΔt, respectively.
For the Experiment 3, where the produc- tion oftrans-C18:1 from C18:3n-3 could no more be neglected,v3was estimated as followed:
v3=([C18:0]t– [C18:0]i)/Δt where [C18:0]i and [C18:0]t represented the concentration of C18:0 at the begin- ning and at the end of the incubation period Δt, respectively. These calculations did not allow an estimation of thev3 of C18:2n-6 BH, but a global estimation of thev3of the oleic acid, C18:2n-6 and C18:3n-3 BH.
The efficiency of the reaction (E) was estimated by the concentration of substrate disappeared during the incubation period (Δt) divided by the total amounts of sub- strate available for the reaction considered.
The efficiency of the reaction 1 was:
E1=([C18:2n-6]i– [C18:2n-6]t)/ [C18:2n-6]i.
For the reaction 2, the efficiency was:
E2=([C18:2n-6]i– [C18:2n-6]t+ [CLA]i– [CLA]t)/
([C18:2n-6]i– [C18:2n-6]t+[CLA]i) where ([C18:2n-6]i – [C18:2n-6]t + [CLA]i) represented the total concentra- tion of CLA available for the enzyme during the incubation period.
The efficiency of the third reaction was:
E3=([C18:2n-6]i– [C18:2n-6]t
+[CLA]i– [CLA]t+[trans-C18:1]i – [trans-C18:1]t)/([C18:2n-6]i – [C18:2n-6]t+[CLA]i– [CLA]t +[trans-C18:1]i)
where ([C18:2n-6]i – [C18:2n-6]t + [CLA]i – [CLA]t + [trans-C18:1]i)
represented the total concentration of trans-C18:1 available for the enzyme dur- ing the incubation period. This calculation was only possible for Experiments 1 and 2, since we could not estimate the part of the trans-C18:1 from C18:3n-3 available for the enzyme in the Experiment 3.
Rates and efficiencies were analysed by the General Linear Model of SYSTAT fol- lowed by a pairwise comparison (Tukey test) when more than two treatments were compared (Experiment 3).
3. RESULTS
3.1. Influence of pH on linoleic acid biohydrogenation (Experiment 1) The results are shown in Table III, and the Figure 1 presents the evolution of the pH in the media according to the buffer used. Globally, except 2 h incubations, the rates of the reactions decreased with the duration of incubation, the efficiency of the isomerisation increased and the efficien- cies of the reductions were slightly higher for the 4 h incubations than for 8 h ones, and thereafter increased. For the 2 h incu- bations, the rates and the efficiencies of the three reactions were extremely high. The rates of the three reactions of BH were sig- nificantly decreased by low pH. There was also a significant decrease of C18:2n-6 iso- merisation efficiency with LpH buffer for all incubation times considered. The effi- ciency of the second reaction (reduction of CLA), for all incubation periods and with both buffer, was over 0.90, however this efficiency was significantly greater for 4 h incubation and tended to be greater for 8 h of incubation with LpH buffer than with HpH buffer. LpH buffer decreased the efficiency of the third reaction (reduction oftrans-C18:1) too, but this decrease was only significant for 16 and 24 h of incuba- tion.
Table III.Influence of pH on rate (v, mg/L/h) and efficiency (E) of each reaction of linoleic acid biohydrogenation: isomerisation (v1;E1), first reduction (v2;E2), second reduction (v3;E3), for 4, 8, 16 or 24 h incubations with LpH or HpH buffer*.
Incubation period, h 0–2 0–4 0–8 0–16 0–24
v1 LpH
HpH SEM P
157.62 159.21 0.516 0.06
18.52 30.85 1.324
< 0.01
18.76 31.08 1.068
< 0.01
14.68 19.66 0.296
< 0.01
10.39 13.56 0.146
< 0.01
E1 LpH
HpH SEM P
0.86 0.87 0.003 0.06
0.20 0.34 0.014
< 0.01 0.41 0.68 0.023
< 0.01 0.65 0.86 0.013
< 0.01 0.68 0.89 0.010
< 0.01
v2 LpH
HpH SEM P
157.51 158.89 0.499 0.08
18.35 28.11 1.090
< 0.01
17.41 27.82 0.796
< 0.01
13.84 18.28 0.264
< 0.01 9.79 12.77 0.137
< 0.01
E2 LpH
HpH SEM P
1.00 1.00 0.001 0.21
0.99 0.91 0.013 0.00
0.92 0.90 0.012 0.06
0.93 0.93 0.005 0.86
0.94 0.94 0.004 0.86
v3 LpH
HpH SEM P
163.06 164.08 0.592 0.25
11.38 18.34 1.270
< 0.01
9.17 16.42 0.631
< 0.01
8.03 12.26 0.384
< 0.01
6.11 8.75 0.147
< 0.01
E3 LpH
HpH SEM P
0.99 0.99 0.001 0.17
0.50 0.57 0.043 0.23
0.47 0.55 0.027 0.06
0.54 0.64 0.019 0.01
0.59 0.65 0.013
< 0.01
* LpH, low pH buffer (pH=6.0); HpH, high pH buffer (pH=7.0).
Figure 1.Evolution of pH during in vitro incu- bations with a low pH () or a high pHbuffer.
3.2. Influence of a high linoleic acid amount on its own
biohydrogenation (Experiment 2) The final concentrations of C18:2n-6 and of its BH intermediates, the rates and the efficiencies of the three reactions of C18:2n-6 BH when C18:2n-6 was added in higher quantities, are presented in Ta- ble IV. The final concentration of C18:2n-6 decreased with the duration of incubation, while the final concentration of C18:0 in- creased. The final concentration of CLA increased with the incubation period until 1 h, and was lowered for 2 h of incubation.
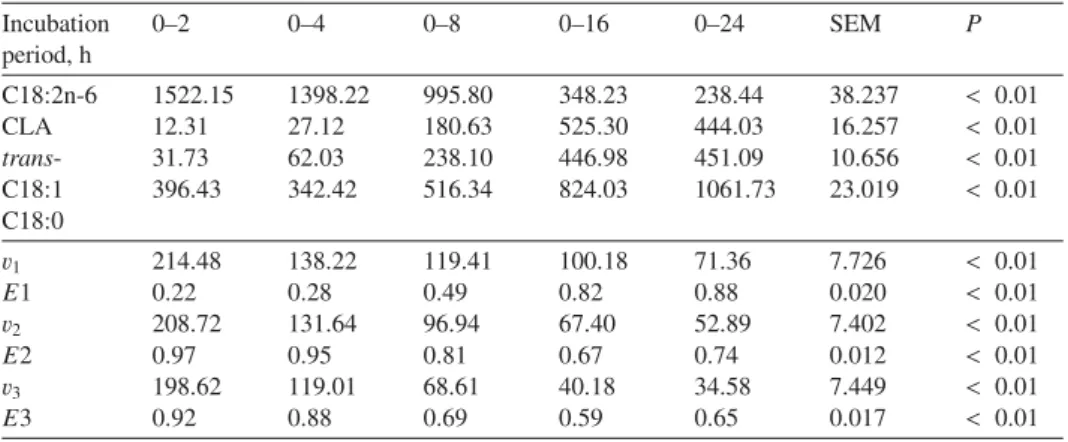
Table IV.Evolution with incubation time of concentrations (mg.L−1) of intermediates of linoleic acid biohydrogenation, and of the rate (v, mg/L/h) and efficiency (E) of each reaction of linoleic acid biohydrogenation: isomerisation (v1;E1), first reduction (v2;E2), second reduction (v3;E3), for 4, 8, 16 or 24 h incubations with 300 mg linoleic acid added per 160 mL flask.
Incubation period, h
0–2 0–4 0–8 0–16 0–24 SEM P
C18:2n-6 CLA trans- C18:1 C18:0
1522.15 12.31 31.73 396.43
1398.22 27.12 62.03 342.42
995.80 180.63 238.10 516.34
348.23 525.30 446.98 824.03
238.44 444.03 451.09 1061.73
38.237 16.257 10.656 23.019
< 0.01
< 0.01
< 0.01
< 0.01 v1
E1 v2
E2 v3 E3
214.48 0.22 208.72 0.97 198.62 0.92
138.22 0.28 131.64 0.95 119.01 0.88
119.41 0.49 96.94 0.81 68.61 0.69
100.18 0.82 67.40 0.67 40.18 0.59
71.36 0.88 52.89 0.74 34.58 0.65
7.726 0.020 7.402 0.012 7.449 0.017
< 0.01
< 0.01
< 0.01
< 0.01
< 0.01
< 0.01
The final concentration oftrans-C18:1 in- creased with the incubation period until 1 h, and then stagnated for 2 h of in- cubation. The rates of the three reactions decreased with the duration of incubations, with extremely high values for 2 h incu- bations. With the incubation duration, the efficiency of the first reaction (isomerisa- tion) increased but the efficiencies of both reductions decreased until 16 h of incuba- tion and thereafter increased for 24 h of incubation.
3.3. Influence of linolenic acid amount on linoleic acid biohydrogenation (Experiment 3)
The rates and efficiencies of the three reactions of C18:2n-6 BH, according to different C18:3n-3 amounts added in cul- tures, are presented in Table V. The rate and the efficiency of the first reaction de- creased when C18:3n-3 amount increased.
The rate of the second reaction decreased too and significantly until 120 mg C18:3n- 3 added, but the efficiency remained un- changed, showing no action of C18:3n-3 on this reaction. The rate of the third reac-
tion significantly differed between 10LNA and 120LNA, and between 10LNA and 180LNA.
4. DISCUSSION
4.1. Influence of pH on linoleic acid biohydrogenation (Experiment 1) The rates of reaction decreased with incubation duration because of the exhaus- tion of their respective substrates, leading to an amelioration of their efficiency. For 2 h incubations the rates and the efficien- cies of the three reactions were maximal probably because the pH was still above 6, even for LpH cultures (Fig. 1). For this same period the concentration of C18:2n-6 was also maximal so that there was not in- hibition of the three reactions of C18:2 BH by C18:2 itself. The decrease of the rate and the efficiency of isomerisation with LpH buffer reflected an inhibition of iso- merisation by low pH, and the tendency obtained for 2 h incubations, when LpH was still above 6, showed that this inhi- bition was efficient under a pH of 6. The results showed that the decrease of the
Table V.Influence of linolenic acid content on rate (v, mg/L/h) and efficiency (E) of reactions of linoleic acid biohydrogenation: isomerisation (v1;E1), first reduction (v2;E2), second reduction (v3), for 6 h incubations with 10 (10LNA), 60 (60LNA), 120 (120LNA) or 180 (180LNA) mg of C18:3n-3 per 160 mL flask.
10LNA 60LNA 120LNA 180LNA SEM
v1
E1 v2 E2 v3
32.01a 0.55a 27.94a 0.87 25.62a
28.94b 0.50b 25.05b 0.88 30.34ab
26.61b,c 0.46b,c 22.60c 0.85 32.93b
24.79c 0.43c 21.21c 0.86 31.85b
0.738 0.013 0.617 0.009 1.314
a,b,cMeans in the same row with unlike superscripts significantly differ (P<0.05).
rate of the second reaction was simply the consequence of the inhibition of the iso- merisation, generating very few substrates for the second reaction, since the efficiency of this reaction did not differ according to pH. This could explain why efficiency was greater with LpH buffer than with HpH buffer for the 4 and 8 h cultures: the low amount of CLA produced from C18:2n-6 at low pH was immediately reduced into trans-C18:1. Afterward, the CLA produc- tion rate decreased for the two types of cultures, and was low so that they were no more efficiency difference. The decrease of the rate of the third reaction was not simply the consequence of the inhibition of the isomerisation, but the reduction of trans-C18:1 into C18:0 was also directly inhibited by low pH, since its efficiency decreased with LpH buffer, and this in- hibition was for a pH under 6, since no inhibition was observed for the 2 h incu- bations.
In our previous study [6] as in other in vitro studies [7, 8] the low pH led to an inhibition of BH, with a decrease of CLA andtrans-C18:1, only suggesting an inhibition of the isomerase. By con- trast, numerous in vivo studies [9, 10, 22]
reported a higher concentration of CLA and trans-C18:1 in milk and duodenum of cows receiving a high concentrate diet in comparison to cows receiving a high forage diet. In Kalsheur et al. [9] and Piper-
ova et al. [10] studies, the low fibre diet induced a 5.83 ruminal pH and high con- centrations of C18:2n-6, trans-C18:1 and CLA in the duodenal flows, suggested a global inhibition of C18:2n-6 BH. In this same study, the addition of sodium bi- carbonate to this low fibre diet increased the ruminal pH to 6.02 and lowered the duodenal flows of C18:2n-6,trans-C18:1 and CLA, underlying a complete BH. The C18:2n-6 accumulations at pH 5.83 could be explained by an inhibition of the iso- merase, and the accumulations of trans- C18:1 and CLA suggesting a possible inhi- bition of the two reductions due to the low pH in this in vivo study.
In the in vitro studies [6–8], the inhibi- tion of the reductions was probably hidden by a drastic inhibition of the isomerase due to the low pH (under 5.5) resulting from the accumulation of volatile fatty acids in a closed media. Indeed, the concentrations of substrates available for the reductions were so low that their inhibition could not be de- tected by observing only the evolution of the concentrations of BH intermediates, as in our first study [6]. In the in vivo studies, the pH decrease was lower for a few hours, allowing the detection of the inhibitions of the three reactions: more substrates could be produced from isomerisation so that their accumulations could be detectable.
In the present study, the calculation of the reactions efficiencies was able to
highlight the inhibition of the second re- duction for incubation times over 4 h, when the pH decreased from 5.66 (8 h) to 5.37 (24 h). So the inhibition of the second re- ductase began for a pH between 5.92 and 5.66. Comparatively, isomerase was inhib- ited by higher value of pH, since for 2 h incubations there was already a tendency (P = 0.055) toward a lower rate and a lower efficiency of this reaction for LpH than for HpH cultures, respectively at pH 6.07 and 6.72. On the other hand our study did not show any effect on the first re- duction whose inhibition could have led to a CLA accumulation. Nevertheless, this inhibition of the second reduction, convert- ingtrans-C18:1 into C18:0 could lead to an accumulation oftrans-C18:1. Then, the partial desaturation oftrans11-C18:1 into CLA in the mammary gland could explain the increase of CLA and trans-C18:1 in the milk of cows receiving a high concen- trate ration [9, 10, 22]. Low pH could act directly on the activity of the enzyme or on the bacteria population, by decreasing its growth, leading to an inhibition of the iso- merisation and of the second reduction of the C18:2 BH (Fig. 2).
Another difference between our in vitro results [6] and the in vivo duodenal content measures [9, 10] was the quantity of added fat. We added 100 mg of soybean oil in 0.16 L ruminal cultures (0.41 g of C18:2n- 6 added per L) and Kalsheur et al. [9] used 500 g of C18:2n-6 per day and per cow (5.00 g of C18:2n-6 added per L, consider- ing 100 L of ruminal fluid per cow), which was very important and could also have acted on the three BH reactions.
4.2. Influence of a high linoleic acid amount on its own
biohydrogenation (Experiment 2) The decrease of the rates of isomerisa- tion and both reductions with time could be due to an inhibition by products of
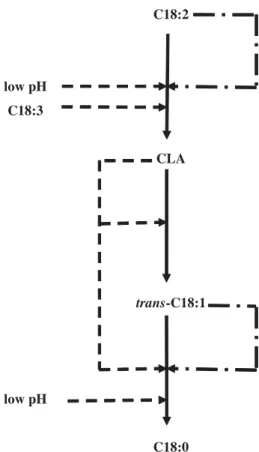
Figure 2. Proposed ways of inhibition
( ) and saturation ( ) ef-
fects of low pH, C18:2n-6, C18:3n-3 and their biohydrogenation intermediates on C18:2n-6 biohydrogenation.
BH, whose concentrations increased, not by C18:2n-6 itself, whose concentration decreased with time (Tab. IV). For the first reaction, the efficiency increased over time, showing that no inhibition was ex- ercised by products. Nevertheless, for 2, 4 and 8 h incubations, low isomerisation effi- ciencies associated with high isomerisation rates underlined a lack of activation of the reaction by its substrate, and perhaps a sat- uration of the reaction capacity by high C18:2n-6 concentration. Indeed the rate of the isomerisation was represented by the quantity of C18:2n-6 disappeared in the
media, and so even if this rate was high the quantity of C18:2n-6 disappeared dur- ing 2, 4, or 8 h, was low compared to that initially present in the media. That’s why the efficiency of the reaction was low for these cultures.
The efficiencies of both reductions also decreased, showing an inhibition of these reactions mainly for 16 h of incubation.
The efficiencies of both reductions were then greater for 24 h of incubation, when trans-C18:1 and C18:0 continued to ac- cumulate in the flasks, and when CLA concentration began to decrease (Tab. IV), suggesting that high CLA concentrations could inhibit both reductions.
A number of studies [3, 11, 13] have already shown that high quantities of C18:2n-6 led to an incomplete BH, and dif- ferent hypothesis were proposed to explain this phenomenon. Kepler and Tove [12]
hypothesized an inhibition of the isomeri- sation step by C18:2n-6 itself, which is consistent with our results showing that ef- ficiency of isomerisation was lower at the beginning of the reaction, when C18:2n-6 concentration was maximal. On the other hand, Beam et al. [11] hypothesized an in- hibition by the products of BH, which was in agreement with the decrease of isomeri- sation rate when BH products accumulated in the present study. The calculation of both efficiency and rate showed that iso- merisation is not inhibited, but is only satu- rated by higher concentrations of C18:2n-6 (Fig. 2), which confirms our previous hy- pothesis [6].
The inhibition of the second reductase by higher concentrations of C18:2n-6 has already been shown and described as being direct [14] and probably irreversible [13], or due to a competitive inhibition between all C18:1 [3]. In this study, the opposite patterns of the two reductases efficien- cies and the CLA concentration suggested an inhibition of the two reductases by CLA (Fig. 2). The higher concentrations of C18:2n-6 led to a higher CLA accu-
mulation, which could secondly highly in- hibit reductases. Kim et al. [23] already showed that CLA could inhibit Butyriv- ibrio fibrisolvens pure cultures. However a direct effect of CLA on enzymes could also be hypothesized: an inhibition by ex- cess of substrate for the first reductase, and a competitive inhibition withtrans-C18:1 for the second reductase. Furthermore, a low specificity of the second reductase could also explain the competitive inhi- bitions between C18:1 isomers for their reduction into C18:0, as hypothesized by Griinari and Bauman [3]. So, the synergy for CLA production in milk between addi- tion of C18:2n-6 and C18:3n-3 noticed in vivo [15, 16], could in part result from the trans11-C18:1 produced from C18:2n-6+ C18:3n-3, and in part from the saturation of the second reductase by alltrans-C18:1 intermediates produced from C18:2n-6 and C18:3n-3 BH (Fig. 2).
4.3. Influence of linolenic acid amount on linoleic acid biohydrogenation (Experiment 3)
Addition of C18:3n-3 decreased C18:2n-6 isomerisation rate and efficiency, showing an inhibition of this reaction. The decrease of CLA reduction rate with the addition of C18:3n-3 without effect on its efficiency was due to the less CLA pro- duction from inhibited isomerisation. The unchanged rate of the third reaction, for initial C18:3n-3 concentrations superior or equal to 483.5 mg.L−1 in the flasks, could be due to a saturation of this reaction probably by all trans-C18:1 isomers produced from C18:2n-6 and C18:3n-3, as hypothesised above (Fig. 2). Indeed for 483.5 mg.L−1 or more C18:3n-3 in the media, the quantity oftrans-C18:1 isomers produced from the beginning of the BH was superior to the capacity of the second reductase, which acted always at the same rate, its maximal rate.
In our previous study [6], the inhibition of C18:2n-6 isomerisation by C18:3n-3 was supposed to be a competitive one, since C18:2n-6 and C18:3n-3 are biohy- drogenated by the same bacteria [12], and no effect of C18:3n-3 on CLA or trans- C18:1 (trans11-C18:1 andtrans10-C18:1) concentrations was noticed. This was in agreement with the fact that CLA is not an intermediate of C18:3n-3 BH [3, 12], and with the fact thattrans11-C18:1 and trans10-C18:1 are not the major isomers produced during C18:3n-3 BH, which pro- duces indeedtrans11-C18:1 but also some trans15-C18:1 [19], trans13-C18:1 and trans14-C18:1 [24]. In vivo, the use of linseed oil can enhance CLA amount in milk as efficiently as soybean oil [15, 16], but in these two studies, the most effi- cient ration was that containing the equal amounts of C18:2n-6 and C18:3n-3. This synergy could be explained in part by the amount of trans11-C18:1 produced from C18:3n-3 and desaturated in the mam- mary gland, but also by the saturation of the second reductase leading to a greater accumulation of trans11-C18:1 wherever it originated from C18:2n-6 or C18:3n-3.
Moreover C18:3n-3 BH does not produce CLA, includingtrans10,cis12-CLA, which could inhibit mammary PUFA uptake from blood and desaturation of trans11-C18:1 into CLA in the mammary gland [25]. This probably also contributed to the synergy noticed between C18:2n-6 and C18:3n-3 for enhancing milk CLA [15, 16]. How- ever when C18:3n-3 was added in higher quantities than C18:2n-6, the production of CLA in milk was lower than with soy- bean [15], which can be explained by the inhibition of C18:2n-6 isomerisation.
5. CONCLUSION
In conclusion, this approach ascertained the actions of pH, of C18:2n-6 and of C18:3n-3 concentrations on the steps of
C18:2n-6 BH, and provided some expla- nation about differences noticed between studies, mainly between in vitro and in vivo studies. In particular, the calculation of the efficiency of the reactions was an interesting way to ascertain the effects of studied factors. This calculation confirmed the inhibition of C18:2n-6 isomerisation by low pH, but we could not conclude about a mechanism of action. High con- centrations of C18:3n-3 were also able to inhibit the C18:2n-6 isomerisation, and it was probably a competitive inhibition. Our study showed a saturation of its isomeri- sation by high concentrations of C18:2n-6, suggesting that there were neither an in- hibition nor an activation of the reaction by an excess of its substrate. The calcu- lation of the efficiencies of the reaction mainly allowed the evidence of an inhibi- tion of the second reduction by very low pH (≤ 5.66), which could not be shown by a simple observation of the evolution of the BH intermediates. The inhibition of the two reductions by CLA and the rapid saturation of the second reductase by high quantities oftrans-C18:1 intermediates of PUFA BH, were also demonstrated by the examination in parallel of the evolution of the BH intermediates concentrations and the reaction rates and efficiencies. Figure 2 summarizes these results, which need to be validated in vivo.
REFERENCES
[1] Pariza MW, Park Y, Cook ME. The biolog- ically active isomers of conjugated linoleic acid. Prog Lipid Res 2001, 40: 283–298.
[2] Sebedio JL, Bretillon L, Chardigny JM.
Conjugated linoleic acid (CLA) and func- tional food? OCL 2001, 8: 328–332.
[3] Griinari JM, Bauman DE. Biosynthesis of conjugated linoleic acid and its incorpora- tion into meat and milk in ruminants. In:
Yurawecz MP, Mossoba MM, Kramer JKG, Pariza MW, Nelson GJ (Eds), Advances in Conjugated Linoleic Acid Research, AOCS Press, Champaign, IL, 1999, p 180–200.
[4] Kepler CR, Hirons KP, McNeill JJ, Tove SB. Intermediates and products of the biohy- drogenation of linoleic acid byButyrivibrio fibrisolvens. J Biol Chem 1967, 242: 5686–
5692.
[5] Griinari JM, Corl BA, Lacy SH, Chouinard PY, Nurmela KV, Bauman DE. Conjugated linoleic acid is synthesized endogenously in lactating dairy cows by delta(9)-desaturase. J Nutr 2000, 130: 2285–2291.
[6] Troegeler-Meynadier A, Nicot MC, Bayourthe C, Moncoulon R, Enjalbert F. Effects of pH and concentrations of linoleic and linolenic acids on extent and intermediates of ruminal biohydrogenation in vitro. J Dairy Sci 2003, 86: 4054–4063.
[7] Martin SA, Jenkins TC. Factors affecting conjugated linoleic acid and trans-C18:1 fatty acid production by mixed ruminal bac- teria. J Anim Sci 2002, 80: 3347–3352.
[8] Wang JH, Song MK, Son YS, Chang MB.
Effect of concentrate level on the forma- tion of conjugated linoleic acid andtrans- octadecenoic acid by ruminal bacteria when incubated with oilseeds in vitro. Asian-Aust J Anim Sci 2002, 15: 687–694.
[9] Kalsheur KF, Teter BB, Piperova LS, Erdman RA. Effect of dietary forage concen- tration and buffer addition on duodenal flow oftrans-C18:1 fatty acids and milk fat pro- duction in dairy cows. J Dairy Sci 1997, 80:
2104–2114.
[10] Piperova LS, Sampugna J, Teter BB, Kalsheur KF, Yurawecz MP, Ku Y, Morehouse KM, Erdman RA. Duodenal and milk trans octadecenoic acid and conjugated linoleic acid (CLA) isomers indicate that postabortive synthesis is the predominant source ofcis-9-containing CLA in lactating dairy cows. J Nutr 2002, 132: 1235–1241.
[11] Beam TM, Jenkins TC, Moate PJ, Kohn RA, Palmquist DL. Effects of amount and source of fat on the rates of lipolysis and biohydro- genation of fatty acids in ruminal contents. J Dairy Sci 2000, 83: 2564-2573.
[12] Kepler CR, Tove SB. Biohydrogenation of unsaturated fatty acids: purification and properties of a linoleateΔ12cis-Δ11trans isomerase fromButyrivibrio fibrisolvens. J Biol Chem 1967, 242: 5686–5692.
[13] Harfoot CG, Noble RC, Moore JH. Factors influencing the extent of biohydrogenation of linoleic acid by rumen micro-organisms in vitro. J Sci Food Agric 1973, 24: 961–970.
[14] Polan CE, McNeill JJ, Tove SB.
Biohydrogenation of unsaturated fatty acids by rumen bacteria. J Bacteriol 1964, 88: 1056–1064.
[15] Dhiman TR, Satter LD, Pariza MW, Galli MP, Albright K, Tolosa MX. Conjugated linoleic acid (CLA) content of milk from cows offered diets rich in linoleic and linolenic acid. J Dairy Sci 2000, 83: 1016–
1027.
[16] Lock AL, Garnsworthy PC. Independent ef- fects of dietary linoleic and linolenic fatty acids on the conjugated linoleic acid content of cow’s milk. Anim Sci 2002, 74: 163–176.
[17] Sukhija PS, Palmquist DL. Rapid method for determination of total fatty acid content and composition of feedstuffs and feces. J Agric Food Chem 1988, 36: 1202–1206.
[18] Enjalbert F, Eynard P, Nicot MC, Troegeler- Meynadier A, Bayourthe C, Moncoulon R.
In vitro versus in situ ruminal biohydrogena- tion of unsaturated fatty acids from a raw or extruded mixture of ground canola seed/ canola meal. J Dairy Sci 2003, 86: 1251–
1261.
[19] Loor JJ, Bandara ABPA, Herbein JH.
Characterization of 18:1 and 18:2 isomers produced during microbial biohydrogenation of unsaturated fatty acids from canola and soya bean oil in the rumen of lactating cows.
J Anim Physiol Anim Nutr 2002, 86: 422–
432.
[20] Mosley EE, Powell GL, Riley MB, Jenkins TC. Microbial biohydrogenation of oleic acid totrans isomers in vitro. J Lipid Res 2002, 43: 290–296.
[21] Ward PFV, Scott TW, Dawson RMC. The hy- drogenation of unsaturated fatty acids in the ovine digestive tract. Biochem J 1964, 92:
60–68.
[22] Gaynor PJ, Waldo DR, Capuco AV, Erdman RA, Douglass LW, Teter BB. Milk fat de- pression, the glucogenic theory, andtrans- C18:1 fatty acids. J Dairy Sci 1995, 78:
2008–2015.
[23] Kim YJ, Liu RH, Bond DR, Russell JB. Effect of linoleic acid concentration on conjugated linoleic acid production by Butyrivibrio fibrisolvensA38. Appl Environ Microbiol 2000, 66: 5226–5230.
[24] Loor JJ, Ferlay A, Ollier A, Doreau M, Chilliard Y. Conjugated linoleic acids (CLA),trans fatty acids, and lipid content in milk from Holstein cows fed a high- or low-fiber diet with two levels of linseed oil.
J Anim Sci 2002, 80 (Suppl. 1): 297.
[25] Peterson DG, Baumgard LH, Bauman DE.
Short communication: milk fat response to low doses of trans-10, cis-12 conjugated linoleic acid (CLA). J Dairy Sci 2002, 85:
1764–1766.