Activity-Induced DNA Breaks Govern the
Expression of Neuronal Early-Response Genes
The MIT Faculty has made this article openly available.
Please share
how this access benefits you. Your story matters.
Citation
Madabhushi, Ram et al. “Activity-Induced DNA Breaks Govern the
Expression of Neuronal Early-Response Genes.” Cell 161, 7 (June
2015): 1592–1605 © 2015 Elsevier Inc
As Published
http://dx.doi.org/10.1016/j.cell.2015.05.032
Publisher
Elsevier
Version
Author's final manuscript
Citable link
http://hdl.handle.net/1721.1/111076
Terms of Use
Creative Commons Attribution-NonCommercial-NoDerivs License
Activity-Induced DNA Breaks Govern the Expression of Neuronal
Early-Response Genes
Ram Madabhushi1, Fan Gao1, Andreas R. Pfenning2,3, Ling Pan1, Satoko Yamakawa1, Jinsoo Seo1, Richard Rueda1, Trongha Phan1, Hidekuni Yamakawa1, Ping-Chieh Pao1, Ryan T. Stott1, Elizabeta Gjoneska1,3, Alexi Nott1, Sukhee Cho1, Manolis Kellis2,3, and Li-Huei Tsai1,3,*
1Picower Institute for Learning and Memory, Department of Brain and Cognitive Sciences,
Massachusetts Institute of Technology, Cambridge, MA 02139, USA
2Computer Science and Artificial Intelligence Laboratory, Massachusetts Institute of Technology,
Cambridge, MA 02139, USA
3The Broad Institute of Harvard and MIT, Cambridge, MA 02139, USA
SUMMARY
Neuronal activity causes the rapid expression of immediate early genes that are crucial for experience-driven changes to synapses, learning, and memory. Here, using both molecular and genome-wide next-generation sequencing methods, we report that neuronal activity stimulation triggers the formation of DNA double strand breaks (DSBs) in the promoters of a subset of early-response genes, including Fos, Npas4, and Egr1. Generation of targeted DNA DSBs within Fos and Npas4 promoters is sufficient to induce their expression even in the absence of an external stimulus. Activity-dependent DSB formation is likely mediated by the type II topoisomerase, Topoisomerase IIβ (Topo IIβ), and knockdown of Topo IIβ attenuates both DSB formation and early-response gene expression following neuronal stimulation. Our results suggest that DSB formation is a physiological event that rapidly resolves topological constraints to early-response gene expression in neurons.
Graphical Abstract
*Correspondence: ; Email: [email protected]
ACCESSION NUMBERS
The accession number for the ChIP-seq and RNA-seq data reported in this paper is GEO: GSE61887.
HHS Public Access
Author manuscript
Cell
. Author manuscript; available in PMC 2016 June 18.Published in final edited form as:
Cell. 2015 June 18; 161(7): 1592–1605. doi:10.1016/j.cell.2015.05.032.
A
uthor Man
uscr
ipt
A
uthor Man
uscr
ipt
A
uthor Man
uscr
ipt
A
uthor Man
uscr
ipt
INTRODUCTION
Neurons are endowed with the remarkable ability to sense and process changes in an organism’s external environment. The exposure to a new sensory experience, for instance, profoundly alters the morphology and connectivity of neural circuits, and these changes are thought to be instrumental in the formation of long-lasting memories and adaptive responses (Goelet et al., 1986). The signaling pathways that underlie these experience-dependent changes have been studied extensively and have led to the current orthodoxy that the initiation of new gene transcription programs is crucial for synaptic plasticity.
Neuronal activity-regulated genes are classified into different subgroups based on the latency of their expression following an activity-dependent stimulus. Genes induced in the earliest wave, referred to as early-response genes, are enriched for transcription factors, such as Fos, Npas4, Egr1, and Nr4a1, and their expression occurs independently of de novo protein synthesis (West and Greenberg, 2011). These transcription factors then govern the expression of late-response genes, such as Bdnf, Homer1, Nrn1, and Rgs2, which are induced with relatively slower kinetics. In this way, early-response genes ultimately regulate various synaptogenic processes, including neurite outgrowth, synapse development and maturation, and the balance between excitatory and inhibitory synapses (West and Greenberg, 2011).
The defining characteristic of early-response genes is their rapid and robust expression within minutes after stimulation. A number of molecular features that facilitate this rapid response have been described previously. For instance, even in the absence of an activity-dependent stimulus, the Fos promoter is already bound by the RNA polymerase II (RNAPII) complex and by activity-dependent transcription factors, such as CREB and SRF.
Furthermore, nucleosomes at the Fos promoter already carry chromatin modifications that are permissive for active transcription, including histone H3 trimethylated at lysine 4 (H3K4me3) (Kim et al., 2010). Neuronal activity then variously causes the phosphorylation
A
uthor Man
uscr
ipt
A
uthor Man
uscr
ipt
A
uthor Man
uscr
ipt
A
uthor Man
uscr
ipt
of CREB and the SRF cofactor, ELK1, the recruitment of the histone acetyltransferase, CBP, to the Fos promoter, and CBP and RNAPII recruitment to enhancer elements of activity-regulated genes (West and Greenberg, 2011). Together, these changes orchestrate the expression of neuronal activity-regulated genes.
Despite these details however, the precise nature of the molecular switch that precludes early-response gene expression under basal conditions, as well as the mechanisms that override this impediment in response to neuronal activity sill remain poorly understood. Our findings suggest that the expression of early-response genes is subdued by the imposition of topological constraints and that the rapid resolution of these constraints in response to neuronal activity involves the generation of DNA double strand breaks (DSBs) within their promoters.
RESULTS
Etoposide-Induced DSBs Stimulate the Expression of Early-Response Genes
Our results stemmed from some unexpected observations made while studying the effects of DSB formation in neurons. The accrual of DNA damage has been linked to various
neurological disorders, and we previously described the formation of DNA lesions, particularly DNA DSBs, to be an apical neurotoxic event in several mouse models of neurodegeneration (Dobbin et al., 2013; Kim et al., 2008; Madabhushi et al., 2014; Wang et al., 2013).
With the idea of further characterizing the consequences of DSB formation in neurons, we incubated cultured primary neurons with etoposide for 6 hr and performed gene expression profiling using next-generation RNA-sequencing (RNA-seq). Etoposide is an established inhibitor of topoisomerase II (Topo II) that traps the enzyme in a complex with the cleaved DNA and thereby converts a normal physiological reaction into a potentially toxic DSB. Transcriptomic analysis after etoposide treatment revealed 692 genes that were differentially expressed compared to vehicle-treated controls. Consistent with the expectation that DSBs would interfere with transcription, an overwhelming majority (680 genes) of the
differentially expressed genes were downregulated (Figure 1A and Table S1). Remarkably, however, the 12 genes that were upregulated were enriched for neuronal activity-regulated genes and particularly the so-called early-response genes, such as Fos, FosB, and Npas4— transcription factors that are also rapidly expressed in response to neuronal activity (Figures 1B and 1C).
Based on these observations, we directly assessed the expression of various neuronal activity-regulated genes after etoposide treatment of cultured primary neurons using quantitative real-time PCR (qRT-PCR). Early-response genes, including Fos, FosB, Npas4, and Egr1 were all upregulated within 20 min of treatment with etoposide (Figure 1D). However, other activity-regulated genes, such as Bdnf and Homer1, showed no such increase in either the RNA-seq or the qRT-PCR experiments (Figures 1C and 1D). Thus, etoposide selectively induces a small subset of activity-regulated genes.
A
uthor Man
uscr
ipt
A
uthor Man
uscr
ipt
A
uthor Man
uscr
ipt
A
uthor Man
uscr
ipt
We then evaluated whether etoposide-mediated early-response gene expression is a result of the activation of the DNA damage response. Cultured primary neurons pre-incubated with a specific inhibitor (KU55933; ATMi) against ATM (ataxia telangiectasia mutated) caused a marked reduction in DSB signaling, as indicated by a reduction in the intensity of γH2AX, a marker of DSB signaling (Figure 1E). However, ATM inhibition had no effect on the etoposide-mediated increase in Fos and Npas4 expression (Figure 1E). In addition to this, we tested whether treatment of neurons with other DSB-inducing agents also induced the expression of early-response genes. These agents included the radiomimetic drugs, neocarzinostatin (ncs) and bleomycin (bleo), and the PARP inhibitor, Olaparib (PARPi). Interestingly, none of these drugs recapitulated the effects of etoposide on Fos and Npas4 expression (Figure 1F). Together, our results unexpectedly revealed that Topo II-mediated DSBs stimulate the expression of early-response genes.
Neuronal Activity Results in the Formation of DNA DSBs
Because early-response genes are normally induced in response to stimulation of neuronal activity, we tested whether established paradigms of neuronal stimulation are also associated with DSB production. Brief incubations of cultured primary neurons with potassium chloride (KCl), N-methyl-D-aspartate (NMDA), or bicucullin (bic), all caused a substantial increase in Fos and Npas4 mRNA (Figures S1A and S1B). Interestingly, each of these treatments also caused an increase in the levels of γH2AX, an established marker of DNA DSBs (Figure S1C) (Crowe et al., 2006).
In addition to this, mouse acute hippocampal slices that were either bath-incubated in NMDA solution or subject to theta-burst electrical stimulation also showed increased
γH2AX levels compared to untreated controls (Figures S1D and S1E). To understand
whether DSBs are also formed following neuronal activity in vivo, we subjected wild-type C57BL/6 mice to a training paradigm for contextual fear conditioning, following which we prepared hippocampal lysates and measured γH2AX levels. Similar to our observations with cultured primary neurons and hippocampal slices, elevated γH2AX levels were detectable in hippocampal lysates within 15 min after exposure to the fear-conditioning paradigm (Figure S1F). Moreover, DSB formation has also been reported in other neuronal stimulation paradigms (Suberbielle et al., 2013). Thus, neuronal activity correlates with the formation of DNA DSBs in neurons.
Neuronal Activity-Induced DNA DSBs Form at Specific Locations in the Genome
To further understand the relationship between neuronal activity and DSB formation, we next determined the positions of activity-dependent DSBs on a genome-wide level. DSB formation results in the rapid phosphorylation of the histone variant, H2AX, at Ser139 in the vicinity of DSB sites (Rogakou et al., 1998). The identification of chromatin enriched for
γH2AX can be exploited to derive the locations of DSBs (Iacovoni et al., 2010; Rodriguez et
al., 2012). We therefore stimulated cultured primary neurons by briefly incubating them with 50 µM NMDA and then performed genome-wide γH2AX ChIP-seq.
For an initial assessment of genome-wide γH2AX ChIP-seq signals, we classified genomic regions into 14 distinct chromatin states associated with regulatory regions (promoters,
A
uthor Man
uscr
ipt
A
uthor Man
uscr
ipt
A
uthor Man
uscr
ipt
A
uthor Man
uscr
ipt
enhancers, heterochromatin, etc.) based on available ChIP-seq data of chromatin marks, including H3K36me3, H4K20me1, H3K4me1, H3K27ac, H3K4me3, H3K27me3, and H3K9me3 (Figure S2A) (Ernst et al., 2011; Gjoneska et al., 2015). Correlating the positional information of these chromatin marks with raw γH2AX ChIP-seq signals revealed that the observed increase in γH2AX is confined largely to actively transcribed genes and their downstream regions, but not to enhancers, polycomb repressed regions, or heterochromatin (Figure 2A).
To further characterize the distribution of enriched γH2AX signals within genomic regions, we performed differential peak calling (Experimental Procedures) and observed that γH2AX enrichment following NMDA treatment occurs primarily within gene bodies compared to distal intergenic regions (Figure 2B). Surprisingly, our analysis revealed only 21 regions that were enriched for γH2AX signals in the NMDA-treated samples compared to controls. Twenty of these regions were within genes, whereas one site was detected in intergenic regions (Figure 2C). Remarkably, included within these 21 loci were the early-response genes, Fos, FosB, Npas4, Egr1, Nr4a1, and Nr4a3 (Figure 2C). In addition to the
transcription factors categorized as early-response genes, several other transcription factors, Olig2 and Dlx6os1, as well as several non-coding RNAs, including Malat1, AI854517, and C130071C03Rik were also represented among the loci that showed elevated γH2AX (Figure 2C). Additionally, the loci identified by differential peak calling also displayed the highest
γH2AX intensities in the NMDA-treated samples, but not in vehicle-treated samples (Tables
S2 and S3).
A closer examination of γH2AX distribution at these loci, including at the early-response genes, revealed a peculiar pattern, with γH2AX peaks initiating adjacent to the
transcriptional start site (TSS), spreading into the gene body, and terminating downstream of the 3’UTR (Figure 2D and Figure S2B). In fact, γH2AX peak width was strictly
proportional to gene length (Figure S2C). The only exception to this scenario was the case of Homer1, in which γH2AX signals only spanned across the annotated short isoform of Homer1 (Figure S2B). While the significance of this is presently unclear, it is noteworthy that only the short isoform of Homer1 is regulated by neuronal activity (Sala et al., 2003). In contrast to these early-response genes, none of the other late response genes, including Bdnf, Rgs2, Nrn1, and Gpr3 showed an increase in γH2AX intensity in their vicinity following NMDA treatment (Figure 2D and Figure S2B). Together these results indicate that activity-dependent stimulation of neurons results in the formation of DNA DSBs at very specific locations in the genome, particularly near early-response genes.
Neuronal Activity-Induced DNA DSBs Are Generated by Topoisomerase IIβ
In an effort to determine the mechanisms that underlie the formation of neuronal activity-induced DSBs, we returned to our original observation that etoposide treatment is
specifically able to upregulate the expression of early-response genes (Figure 1F). Etoposide introduces DSBs by targeting Topo II (Vos et al., 2011). Mammalian cells express two distinct isoforms of Topo II, Topo IIα, and Topo IIβ. Topo IIα is mainly expressed in dividing cells, whereas Topo IIβ is robustly expressed in postmitotic cells, including neurons, and is primarily implicated in transcription-related functions (Austin and Marsh,
A
uthor Man
uscr
ipt
A
uthor Man
uscr
ipt
A
uthor Man
uscr
ipt
A
uthor Man
uscr
ipt
1998). Incidentally, Topo IIβ-mediated DSBs were previously shown to be essential for estradiol-stimulated activation of gene expression (Ju et al., 2006). These observations caused us to focus specifically on Topo IIβ.
We began by assessing Topo IIβ binding at various regions of the prototypical early-response gene, Fos, under basal conditions. Topo IIβ ChIP-qPCR indicated negligible binding in the exons of the Fos gene, as well as within the promoters of β-globin and GAPDH (Figure 3A). However, Topo IIβ binding was significantly enriched within the Fos promoter (Figure 3A). Similarly, Topo IIβ binding was also enriched within the Npas4 promoter (Figure 3A). These results suggest that Topo IIβ is bound to the promoters of early-response genes under basal conditions.
The regulatory elements that bind the Fos promoter are well characterized, and additional ChIP experiments revealed that Topo IIβ co-occupies the Fos promoter together with ELK1, as well as the lysine deacetylase, HDAC2 (Figure 3B and Figure S3A). We previously showed that HDAC2 binds to the promoters of several early-response genes and negatively modulates their expression (Guan et al., 2009). While screening for proteins that could potentially regulate HDAC2 binding to these promoters, we separately discovered that the protein, tyrosyl DNA phosphodiesterase 2 (TDP2), binds HDAC2 and is enriched at several early-response gene promoters, including Fos and Npas4, under basal conditions (Figure S3B and data not shown). These results are intriguing because Topo II-mediated DSBs involve the formation of a covalent phosphotyrosyl bond between Topo II and the DNA, and TDP2 specializes in processing these intermediates and in the repair of Topo II-mediated DSBs (Cortes Ledesma et al., 2009).
To test whether Topo IIβ activity could underlie activity-induced DSB formation, we first measured levels of Topo IIβ cleavage complexes following NMDA treatment using an immune complex of enzyme (ICE) assay (Nitiss et al., 2012). As a control, we incubated neurons with etoposide and observed an increase in Topo IIβ covalent complexes (Figure S3C). Interestingly, NMDA treatment also caused an increase in Topo IIβ covalent complexes, indicating that neuronal activity results in Topo IIβ-mediated DNA cleavage (Figure S3C). To further assess how neuronal activity affects Topo IIβ, we
immunoprecipitated Topo IIβ following NMDA treatment of primary neurons and incubated the precipitated Topo IIβ with supercoiled plasmids. Incubation with Topo IIβ caused a potent relaxation of supercoiled plasmids in both NMDA-treated and vehicle-treated samples (Figure 3C). However, plasmids incubated with Topo IIβ from NMDA-treated samples also displayed increased smearing, indicative of fragmented DNA (Figure 3C). These results suggest neuronal activity confers Topo IIβ with an increased propensity to generate DNA breaks.
We next performed DNA cleavage assays in which we incubated purified, recombinant Topo IIβ together with supercoiled plasmids that either contained or lacked the upstream
sequences of the Fos gene. As expected, incubation of supercoiled plasmids with Topo IIβ caused an increase in relaxed (Form II) DNA (Figure 3D). In the presence of etoposide, an increase in linear (Form III) DNA was also detected in plasmids containing Fos upstream sequences. However, the generation of this linear DNA was sharply attenuated when Fos
A
uthor Man
uscr
ipt
A
uthor Man
uscr
ipt
A
uthor Man
uscr
ipt
A
uthor Man
uscr
ipt
upstream sequences were deleted (Figure 3D). Similar results were also observed with plasmids containing Npas4 upstream sequences. Together, these results suggest that Topo IIβ preferentially cleaves the promoters of early-response genes.
Based on Topo IIβ binding in the promoters of early-response genes, we then speculated that if Topo IIβ generates DSBs in these promoters in an activity-dependent manner, that such cleavage should prevent the amplification of these regions using the primers that detect Topo IIβ enrichment (Figure 3E). Control Topo IIβ ChIP experiments following etoposide
treatment of cultured primary neurons revealed a significant reduction in amplification by two distinct primer sets that span the Fos promoter (Figure 3F). Importantly, Topo IIβ ChIP following NMDA treatment also indicated a sharp reduction in the amplification of the Fos promoter regions (Figures 3F and S3D). A similar attenuation in PCR amplification was also observed following ELK1 ChIP in NMDA-treated neurons (Figure 3G). To determine whether activity-induced DNA cleavage occurs at a specific site within the Fos promoter, we repeated the PCR amplification assays after Topo IIβ ChIP using various primer
combinations that spanned the originally identified Topo IIβ binding region within the Fos promoter. However, each region that was showed enriched amplification following Topo IIβ ChIP under basal conditions also showed reduced amplification following NMDA treatment (Figure S3E). Thus, activity-induced DSBs are not site-specific but rather occur broadly within the Fos promoter. Taken together, our results indicate that neuronal activity-induced DSBs occur within the promoters of early-response genes and that these DSBs could result from the activities of Topo IIβ.
Genome-wide Topo IIβ Cleavage Patterns Coincide with Sites of Activity-Induced DNA DSBs
To further examine the connections between Topo IIβ and activity-induced DSBs, we performed Topo IIβ ChIP-seq under basal conditions and following neuronal activity. An analysis of Topo IIβ signals within various genomic regions suggested that under basal conditions, Topo IIβ binding is enriched primarily at and upstream of the TSS of actively transcribed genes, as well as at enhancer elements, but not at heterochromatin or polycomb repressed regions (Figure 4A and Table S4). A comparison with existing datasets of various factors that bind activity-regulated genes (Kim et al., 2010) revealed that Topo IIβ binding is enriched at SRF and CREB binding sites, as well as CBP binding sites within promoters and enhancers (Figures 4B and 4C). These results further indicate that Topo IIβ binding patterns overlap with regulators of neuronal activity-induced gene expression.
Interestingly, NMDA caused a substantial increase in genome-wide Topo IIβ binding. Whereas 430 Topo IIβ peaks were identified under basal conditions, 2,416 peaks were detected within 20 min of the initial NMDA treatment (Table S4). This nearly 5-fold
increase in Topo IIβ signals was largely proportionally distributed within the same chromatin regions that showed Topo IIβ binding under basal conditions (Figure 4A and Table S4). NMDA treatment also caused an enrichment of Topo IIβ signals at SRF, CREB, and CBP binding sites (Figures 4B and 4C). These features also extend to the promoters of early-response genes, such as Fos and Npas4, where an increase in Topo IIβ signals were clearly detected following neuronal activity (Figure 4D). Importantly, Topo IIβ signals under both
A
uthor Man
uscr
ipt
A
uthor Man
uscr
ipt
A
uthor Man
uscr
ipt
A
uthor Man
uscr
ipt
basal and NMDA-treated conditions were found immediately adjoining γH2AX-en riched regions in NMDA-treated samples (Figure 4D). These results further suggest that Topo IIβ binding patterns are consistent with their role in activity-dependent DNA DSB formation. To further understand whether Topo IIβ-mediated DNA cleavage could underlie the selective pattern of DSB formation in response to neuronal activity, we performed γH2AX ChIP-seq after treatment of cultured primary neurons with etoposide. Similar to results with NMDA treatment, γH2AX signals after etoposide treatment were enriched primarily within gene bodies compared to intergenic regions (Figure 4E). Furthermore, aggregate plots revealed that etoposide-induced and NMDA-induced γH2AX signals display a strikingly similar distribution pattern at the sites of activity-induced DSBs (Figures 4F and S4A), and this similarity is further emphasized from the comparison of NMDA and etoposide-induced
γH2AX signals at individual genes (Figure S4B). These data suggest that Topo IIβ-mediated
DNA cleavage could underlie activity-induced DSB formation in neurons.
Activity-Induced DNA DSBs Occur within CTCF-Generated Topological Domains
We sought to understand the properties that could underlie the positional specificity of activity-induced DSBs. We found that promoters that incur activity-induced DSBs already contain RNAPII pre-bound at the TSS, as well as a chromatin environment that is highly permissive for gene expression even under basal conditions (Figures S5A and S5B). However, pre-incubation of cultured neurons with DRB (5,6-Dichloro-1-β-D-ribofura-nosylbenzimidazole), an inhibitor of RNAPII elongation (Yankulov et al., 1995), prior to their treatment with NMDA had no effect on activity-induced DSB formation (Figure S5C), indicating that DSBs are not likely formed as a by-product of torsional stress generated during transcription elongation. Importantly, we noted that although NMDA causes a 5-fold increase in the number of Topo IIβ peaks, activity-induced DSBs occur at loci that already contain Topo IIβ bound under basal conditions and not at sites of nascent Topo IIβ peaks following NMDA treatment (Figure 5A).
We next performed motif scans at Topo IIβ binding sites under basal conditions.
Interestingly, these studies revealed that the CTCF transcription factor binding site motif (CTCF_1; www.broadinstitute.org/~pouyak/motifs-table/) is the most highly enriched at Topo IIβ binding sites. Under basal conditions, a 37-fold enrichment for this motif at Topo IIβ binding sites was detected relative to a shuffled control version of this binding site found at a similar number of places in the genome (p value = 1 × 10−70). Similarly, a 31-fold enrichment of the CTCF motif at Topo IIβ peaks was observed under NMDA-treated conditions (p value<<1 × 10−100). In fact, in both cases, Topo IIβ disposition at these sites was tightly confined to the CTCF motif itself (Figure 5B). CTCF is an architectural protein that creates topological boundaries through chromatin looping and thereby governs
interactions between various regulatory regions, such as promoters and enhancers (Ong and Corces, 2014). A comparison with two different existing CTCF ChIP-seq datasets (GEO: GSM918727 and Phillips-Cremins et al., 2013) revealed that Topo IIβ signals are significantly enriched at CTCF peaks (Figures 5C and 5D). Furthermore,
immunoprecipitated Topo IIβ under basal was able to co-precipitate CTCF, and this interaction was markedly stimulated following NMDA treatment (Figure S5D).
A
uthor Man
uscr
ipt
A
uthor Man
uscr
ipt
A
uthor Man
uscr
ipt
A
uthor Man
uscr
ipt
To determine whether the association between Topo IIβ and CTCF is relevant to activity-induced DSBs, we again utilized the publicly available CTCF ChIP-seq datasets and examined the disposition of CTCF relative to γH2AX signals at the sites of activity-dependent DNA DSBs. Our analysis revealed that the probability of finding a CTCF peak within 2 kb of the boundary of γH2AX regions was significantly greater than the probability of finding permutated random sites in the mappable regions throughout the genome (p < 0.0001). Furthermore, CTCF peaks lie significantly closer to the TSS of genes that incur DSBs following NMDA treatment compared to other genes (Figure S5E). Aggregate plots of CTCF and γH2AX distribution at sites of activity-induced DSBs further revealed that CTCF peaks tightly envelop γH2AX regions within these loci (Figure 5E). Similar results were also observed with γH2AX signals generated after etoposide treatment of neurons (Figure 5F; p < 0.0001). These results suggest that CTCF-mediated topological structures at the promoters of early-response genes could stimulate the nucleation of Topo IIβ.
Topo IIβ-Mediated DNA DSBs Facilitate the Expression of Early-Response Genes
Because DSB formation within the promoters of early-response gene correlates with their expression, we tested whether DSBs have an effect on the expression of these genes. To begin, we obtained luciferase reporter constructs that were under the control of either the Fos or the Npas4 regulatory regions, and utilized the CRISPR-Cas9 system to generate targeted DSBs within the promoters of Fos and Npas4 (Ran et al., 2013) (Figure 6A). Transfection of matching luciferase reporter and Cas9 constructs in HEK293T cells caused a marked increase in luciferase expression in both cases compared to controls in which Cas9 was targeted to cleave the Bdnf promoter (Figure 6B). An upregulation of endogenous Fos and Npas4 was also detected when cultured primary neurons were infected with lentiviral vectors carrying Cas9 and the appropriate sgRNAs (Figure 6C). These results suggest that the formation of DSBs within the promoters of early-response genes stimulates their expression.
To further understand how the presence of activity-induced DSBs affects early-response gene expression, we assessed DNA repair kinetics of activity-induced DSBs. Because DSB formation within the Fos promoter precludes the amplification of this region in PCR assays (Figure 3F), the recovery of amplification was used to indicate successful repair at this locus. Topo IIβ ChIP-qPCR at various times after NMDA treatment of cultured primary neurons indicated a significant reduction in PCR amplification of the Fos promoter region at 30 min after the initial NMDA stimulus (Figure 6D). However, PCR amplification was restored by 2 hr after NMDA stimulation (Figure 6D). Similar results were also observed in PCR assays with genomic DNA directly isolated from cultured primary neurons following NMDA treatment (Figure S6A). These results suggest that activity-induced DSBs are repaired within 2 hr of the initial stimulus. Interestingly, Fos, Npas4, and Egr1 mRNA levels after NMDA treatment followed similar dynamics, with transcript levels being markedly upregulated at 30 min after the initial stimulus, but re-tuning to basal levels by 2 hr after stimulation (Figure 6E). Thus, the expression patterns of early-response genes correlate well with the formation and repair of activity-induced DSBs.
A
uthor Man
uscr
ipt
A
uthor Man
uscr
ipt
A
uthor Man
uscr
ipt
A
uthor Man
uscr
ipt
We next tested the effects of perturbing DSB repair on the expression of early-response genes by pre-incubating neurons with a specific inhibitor of DNA-PK (NU7026), which is an essential component of DSB repair through nonhomologous end joining (NHEJ) (Veuger et al., 2003). Pre-incubation with NU7026 prevented the PCR amplification of the Fos promoter regions even after recovery for 2 hr following NMDA treatment, indicating that the repair of activity-induced DSBs is dependent on NHEJ (Figure S6A). Like before (Figure 6E), Fos, Npas4, and Egr1 expression was markedly upregulated upon stimulation and returned to baseline levels by 2 hr post-stimulation in untreated controls. Incubation with NU7026 had no effect on either the basal expression of early-response genes or on their peak induction levels post-stimulation (data not shown). However, early-response genes in NU7026-treated samples were delayed in returning to basal levels and were upregulated at 2 hr post-stimulation relative to untreated controls (Figure 6F), although the expression of these genes at 2 hr was still lower than their peak induction levels at 30 min post-stimulation (data not shown). These results suggest that the repair of activity-induced DSBs can affect the dynamics of early-response gene expression.
To clarify the role of Topo IIβ in activity-induced DSB formation and early-response gene expression, we infected cultured primary neurons with lentiviral vectors carrying shRNAs against Top2b. qRT-PCR experiments performed one week after the lentiviral infections using two distinct shRNAs revealed that both shRNAs were able to knockdown Top2b expression by at least 50% (Figure S6B). To examine the effects of Top2b knockdown on DSB formation, we assessed γH2AX enrichment within the exons of early-response genes after NMDA treatment using ChIP-qPCR. Whereas NMDA treatment caused a robust increase in γH2AX levels in the exons of Fos, Npas4, and Egr1 in neurons infected with a scrambled shRNA, this increase was attenuated in neurons infected with Top2b shRNAs (Figure 6G). In addition to this, qRT-PCR experiments following NMDA treatment of cultured primary neurons revealed that whereas neurons infected with scrambled shRNA showed a significant induction of Fos and Npas4 transcripts following activity stimulation, the induction of these genes was severely attenuated in neurons infected with Top2b shRNAs (Figure 6H). In contrast to Fos and Npas4, the expression of another early-response gene, Arc, which does not incur activity-induced DNA DSBs, was not affected by Top2b knockdown (Figure S6C). These results suggest that Topo IIβ is essential for activity-induced DSB formation, as well as for the expression of genes that incur activity-activity-induced DSBs.
To evaluate how the loss of Topo IIβ affects synaptic functions, we stereotactically injected lentiviral vectors carrying Top2b shRNAs into the CA1 region of the mouse hippocampus. Four weeks after viral injections, we performed extracellular recordings in acute
hippocampal slices. As assessment of basal synaptic transmission revealed no significant differences between control slices infected with a scrambled shRNA and slices infected with Top2b shRNAs (Figure S6D). However, theta-burst stimulation (TBS)-induced LTP from Schaffer collateral-CA1 synapses was severely impaired in slices infected with Top2b shRNAs (Figure 6I). While the slices transduced with scrambled shRNA exhibited 200% fEPSP over baseline, shRNA#1 transduced slices showed 130% and shRNA#2 transduced slices showed 150% fEPSP over baseline over the time course of 60 min following
theta-A
uthor Man
uscr
ipt
A
uthor Man
uscr
ipt
A
uthor Man
uscr
ipt
A
uthor Man
uscr
ipt
burst stimulation (Figure 6I). These results are consistent with a role for Topo IIβ in the expression of early-response genes and maintaining synaptic function.
To further understand the connections between activity-induced DSBs, Topo IIβ, and early-response gene expression, we performed RNA-seq after NMDA treatment of cultured primary neurons (Table S5). Analysis of differentially expressed genes after NMDA treatment revealed that only the early-response genes, Fos, Npas4, FosB, and Egr1, show elevated γH2AX signals. Furthermore, only early-response genes were upregulated by both etoposide and NMDA treatments (Figures 1B and 1D, and Tables S1 and S5). These results suggest that activity-dependent DSB formation selectively promotes the expression of early-response genes. Finally, we tested whether DSB formation in the context of Topo IIβ knockdown could restore the expression of early-response genes. To this end, we infected cultured primary neurons with lentiviral vectors carrying shRNAs against Top2b, together with lentiviral vectors carrying either Cas9 and sgRNAs against the Fos promoter (Cas9-Fos) or Cas9 and sgRNAs against a different region (Cas9-control). We then treated neurons with NMDA and compared Fos levels under these conditions. Consistent with our earlier observations (Figure 6C), neurons infected with both Cas9-Fos and scrambled shRNA were able to induce Fos under basal conditions (Figure 6J). Likewise, neurons infected with Cas9-control and Top2b shRNA showed reduced Fos expression following NMDA treatment (Figure 6J). In contrast, neurons infected with a combination of Cas9-Fos and Top2b shRNA were able to successfully upregulate Fos expression following NMDA treatment (Figure 6J), indicating that DSB formation can restore the expression of early-response genes in the absence of Topo IIβ. Taken together, our results suggest that Topo IIβ-mediated DSBs facilitate the expression of early-response genes in response to neuronal activity.
DISCUSSION
DSBs Facilitate the Expression of Early-Response Genes
The promoters of early-response genes already display the major hallmarks of
transcriptionally active genes under basal conditions, including RNAPII bound at the TSS (Kim et al., 2010). Moreover, neuronal activity only minimally impacts the profiles of histone methylation and transcription factor binding at these promoters. These observations raise important questions about how the expression of early-response genes is curtailed under basal conditions and how an activity-dependent stimulus causes these genes to be expressed so instantly.
Our results provide three lines of evidence that suggest that DSB formation could help override the impediments to early-response gene expression: (1) DSB formation in the promoters of early-response genes using either etoposide (Figures 1D, 4F, and S4B) or CRISPR-Cas9 (Figures 6B and 6C) is sufficient to induce the expression of early-response genes even in the absence of neuronal activity, (2) inhibition of DSB repair results in persistent expression of early-response genes (Figure 6F), and (3) Topo IIβ knockdown precludes the expression of early-response genes following neuronal activity; however, gene expression can be restored under these conditions by the generation of targeted DSBs (Figure 6J).
A
uthor Man
uscr
ipt
A
uthor Man
uscr
ipt
A
uthor Man
uscr
ipt
A
uthor Man
uscr
ipt
Topological Factors Constrain the Expression of Early-Response Genes
The involvement of Topo IIβ suggests the existence of topological constraints that could govern the expression of early-response genes. However, the precise nature of these topological constraints is presently unclear. Topo IIβ activity upstream of the TSS is generally important for transcription elongation (Teves and Henikoff, 2014). In fact, Topo IIβ is known to bind to the 5’ ends of actively transcribed neurodevelopmental genes and promote their expression (Lyu et al., 2006; Tiwari et al., 2012). As mentioned above, the promoters of early-response genes already contain paused RNAPII under basal conditions, and activity-induced DSB formation could be a way to rapidly resolve topological barriers to RNAPII movement. Torsional stress generated during transcription initiation at these promoters could cause Topo IIβ recruitment under basal conditions. Notably however, the recruitment of Topo IIβ to the promoters of early-response genes under basal conditions does not result in the formation of DSBs, and the potential relaxation of supercoils by Topo IIβ under basal conditions by itself is insufficient to induce the expression of early-response genes. Furthermore, blocking transcription elongation does not affect activity-dependent DSB formation (Figure S5C). Despite these, the possibility that neuronal activity spawns new transcription-related torsional forces that induce DSB formation by Topo IIβ cannot be ruled out.
Separate from transcription-related torsional factors however, the TSS of genes that incur activity-dependent DSBs are characterized by their close proximity to CTCF binding sites compared to the TSS of other genes (Figure S5E), and Topo IIβ binding is preferentially enriched at CTCF binding sites (Figure 5). We believe these observations provide insights into a distinct topological constraint to early-response gene expression. CTCF-mediated chromatin loops create topological barriers that govern the interactions between distinct regulatory regions, such as promoters and enhancers (Ong and Corces, 2014). Enhancer-promoter interactions are known to be essential for the expression of early-response genes. Enhancers of early-response genes are also pre-bound by SRF and CREB and recruit RNAPII and CBP following neuronal activity, and several studies indicate that RNAPII recruited to enhancer loci might be transferred to promoters following activity stimulation (Kim et al., 2010; Koch et al., 2008). Within this context, the formation of Topo IIβ-mediated DSBs at CTCF binding sites in an activity-dependent manner constitutes an attractive model that would rapidly dissolve topological constraints to enhancer-promoter interactions and instantly stimulate the expression of early-response genes.
Implications of Activity-Dependent DSB Formation in Neurodegeneration
Because activity-dependent DSBs form in the regulatory regions of genes that govern crucial neuronal functions, the dynamics of their formation and repair is likely to have important physiological and pathological implications. Interestingly, androgen signaling was previously shown to induce Topo IIβ-mediated DSBs that results in oncogenic
rearrangements observed in human prostate cancer (Haffner et al., 2010). These observations raise the intriguing question of whether unrepaired or erroneously repaired DSBs produced in response to neuronal activity could contribute to the development of neurological
disorders. Elevated DNA DSBs have been reported in a variety of congenital and age-related neurological disorders (Madabhushi et al., 2014; McKinnon, 2013). However, the relevant
A
uthor Man
uscr
ipt
A
uthor Man
uscr
ipt
A
uthor Man
uscr
ipt
A
uthor Man
uscr
ipt
sources that lead to DSB accumulation in these disorders remain unknown. Interestingly, it was recently reported that amyloid β accumulation, which is a hallmark of Alzheimer’s disease, can exacerbate the accumulation of DSBs that are produced during normal
physiological neuronal activities in mice (Suberbielle et al., 2013). It would be interesting to test whether elevated DSBs in this mouse model, as well as in other mouse models and postmortem brains of patients with neurodegenerative disorders, overlap with the sites of activity-induced DNA DSBs.
The enrichment of TDP2 at the promoters of early-response genes (Figure S3B) suggests that activity-induced DSBs are likely repaired error-free despite the utilization of the NHEJ pathway (Figure 6F). In cells lacking TDP2, Topo IIβ-mediated DSBs are repaired using alternative mechanisms of end joining that are dependent on ATM (Álvarez-Quilόn et al., 2014). However, such end-processing steps could be mutagenic. It was recently reported that individuals carrying mutations in TDP2 manifest with intellectual disability, epilepsy, and ataxia, and that the loss of TDP2 in cultured human cells and postmitotic neurons caused hypersensitivity to Topo IIβ-mediated DSBs (Gόmez-Herreros et al., 2014). An assessment of TDP2 activity in various neurodegenerative mouse models that are characterized by elevated levels of DNA DSBs would likely provide further insights in this direction.
EXPERIMENTAL PROCEDURES
Neuronal Cultures and TreatmentsDissociated cortical neurons from E16 Swiss-Webster mice were plated at a density of 12.5 million cells/plate in10 cm plates. The plates were coated beforehand by incubation with poly-D-lysine (0.5 mg/ml) and laminin (0.005 mg/ml) for 1 hr at 37°C, followed by washing twice with dH2O. Neurons were maintained in neurobasal media (GIBCO) and
supplemented with L-glutamine, penicillin/streptomycin, and B27.
Neuronal activity was induced by treatment with indicated concentrations of potassium chloride (KCl), bicucullin (Bic), and N-methyl-D-aspartate (NMDA). For most experiments, cultured primary neurons were treated with 50 µM NMDA for 10 min followed by recovery in NMDA-free conditional media for an additional 10 min. Etoposide (Sigma) was at 5 µM, Olaparib (PARPi) (Selleck) at 10 µM, Ncs was at 1 µM, and NU7026 (Calbiochem) was at 10 mM.
DNA Cleavage Assays
Topo IIβ-mediated DNA cleavage assays were essentially carried out as described (Nitiss et al., 2012). Briefly, reaction mixtures (20 µl) containing 10 mM Tris (pH 8), 50 mM NaCl, 50 mM KCl, 5 mM MgCl2, 0.1 mM EDTA, 15 µg/ml BSA, and 10 nM supercoiled plasmids (Fos-luc, Npas4-luc, ΔFos-luc, and ΔNpas4-luc) were incubated with 8 units of recombinant Topo IIβ-His (LAE Biotech). Where indicated, etoposide was at 100 µM. Reactions were incubated at 30°C for 10 min. DNA cleavage products were trapped by addition of 2 µl of 10% SDS. Samples were then treated with 1 µl of 250 mM EDTA and 2 µl of 1 mg/ml proteinase K and incubated at 37°C for 45 min. Samples were then loaded onto 1 % TAE
A
uthor Man
uscr
ipt
A
uthor Man
uscr
ipt
A
uthor Man
uscr
ipt
A
uthor Man
uscr
ipt
agarose gels and electrophoresed at 5 V/cm for 4 hr. Gels were stained with 1 µg/ml ethidium bromide for 30 min and visualized.
In Vivo Complex of Enzyme Assay
ICE assays were performed essentially as described (Nitiss et al., 2012). Cultured primary neurons were lysed with 1% sarkosyl, and the DNA was sheared using a 1 ml syringe with a 25G/8 gauge needle. Lysates were passed 10 times through the needle. Lysates (2 ml) were then layered atop a 2 ml CsCl solution in 13 × 51 mm polycarbonate centrifuge tubes (Beckman) and spun at 71,000 rpm in an SLA-100.3 rotor (Beckman) for 12 hr at room temperature. Pellets were washed with 70% ethanol and resuspended in TE buffer (pH 7.5). Indicated amounts of DNA were applied to a nitrocellulose membrane using a slot-blot apparatus (Bio-Rad) following manufacturer’s instructions. The membranes were then analyzed for Topo IIβ using standard western blotting procedures.
ChIP-Seq, RNA-Seq, ChIP-qPCR, Behavioral and Elecrophysiological Paradigms
Please refer to Supplementary Information for details of these procedures. A comprehensive list of primers used for these methods can be found in Table S6.
Supplementary Material
Refer to Web version on PubMed Central for supplementary material.
Acknowledgments
We would like to thank Dr. Yingxi Lin (Massachusetts Institute of Technology) for kindly providing the Fos and Npas4 luciferase reporter constructs. This work was supported by the Lord Foundation Fellowship to R.T.S, the NIH/ NHGRI (R01HG004037-07 and RC1HG005334) awards to M.K., and NIH R01AG046174, the Glenn Foundation, and the Belfer Neurodegeneration Consortium grants to L.-H.T.
REFERENCES
Álvarez-Quilόn A, Serrano-Benítez A, Lieberman JA, Quintero C, Sánchez-Gutiérrez D, Escudero LM, Cortés-Ledesma F. ATM specifically mediates repair of double-strand breaks with blocked DNA ends. Nat. Commun. 2014; 5:3347. [PubMed: 24572510]
Austin CA, Marsh KL. Eukaryotic DNA topoisomerase II beta. BioEssays. 1998; 20:215–226. [PubMed: 9631649]
Cortes Ledesma F, El Khamisy SF, Zuma MC, Osborn K, Caldecott KW. A human 5’-tyrosyl DNA phosphodiesterase that repairs topoisomerase-mediated DNA damage. Nature. 2009; 461:674–678. [PubMed: 19794497]
Crowe SL, Movsesyan VA, Jorgensen TJ, Kondratyev A. Rapid phosphorylation of histone H2A.X following ionotropic glutamate receptor activation. Eur. J. Neurosci. 2006; 23:2351–2361. [PubMed: 16706843]
Dobbin MM, Madabhushi R, Pan L, Chen Y, Kim D, Gao J, Ahanonu B, Pao P-C, Qiu Y, Zhao Y, Tsai LH. SIRT1 collaborates with ATM and HDAC1 to maintain genomic stability in neurons. Nat. Neurosci. 2013; 16:1008–1015. [PubMed: 23852118]
Ernst J, Kheradpour P, Mikkelsen TS, Shoresh N, Ward LD, Epstein CB, Zhang X, Wang L, Issner R, Coyne M, et al. Mapping and analysis of chromatin state dynamics in nine human cell types. Nature. 2011; 473:43–49. [PubMed: 21441907]
A
uthor Man
uscr
ipt
A
uthor Man
uscr
ipt
A
uthor Man
uscr
ipt
A
uthor Man
uscr
ipt
Gjoneska E, Pfenning AR, Mathys H, Quon G, Kundaje A, Tsai LH, Kellis M. Conserved epigenomic signals in mice and humans reveal immune basis of Alzheimer’s disease. Nature. 2015; 518:365– 369. [PubMed: 25693568]
Goelet P, Castellucci VF, Schacher S, Kandel ER. The long and the short of long-term memory—a molecular framework. Nature. 1986; 322:419–422. [PubMed: 2874497]
Gόmez-Herreros F, Schuurs-Hoeijmakers JHM, McCormack M, Greally MT, Rulten S, Romero-Granados R, Counihan TJ, Chaila E, Conroy J, Ennis S, et al. TDP2 protects transcription from abortive topoisomerase activity and is required for normal neural function. Nat. Genet. 2014; 46:516–521. [PubMed: 24658003]
Guan J-S, Haggarty SJ, Giacometti E, Dannenberg J-H, Joseph N, Gao J, Nieland TJF, Zhou Y, Wang X, Mazitschek R, et al. HDAC2 negatively regulates memory formation and synaptic plasticity. Nature. 2009; 459:55–60. [PubMed: 19424149]
Haffner MC, Aryee MJ, Toubaji A, Esopi DM, Albadine R, Gurel B, Isaacs WB, Bova GS, Liu W, Xu J, et al. Androgen-induced TOP2B-mediated double-strand breaks and prostate cancer gene rearrangements. Nat. Genet. 2010; 42:668–675. [PubMed: 20601956]
Iacovoni JS, Caron P, Lassadi I, Nicolas E, Massip L, Trouche D, Legube G. High-resolution profiling of gammaH2AX around DNA double strand breaks in the mammalian genome. EMBO J. 2010; 29:1446–1457. [PubMed: 20360682]
Ju BG, Lunyak VV, Perissi V, Garcia-Bassets I, Rose DW, Glass CK, Rosenfeld MG. A topoisomerase IIbeta-mediated dsDNA break required for regulated transcription. Science. 2006; 312:1798–1802. [PubMed: 16794079]
Kim D, Frank CL, Dobbin MM, Tsunemoto RK, Tu W, Peng PL, Guan JS, Lee BH, Moy LY, Giusti P, et al. Deregulation of HDAC1 by p25/Cdk5 in neurotoxicity. Neuron. 2008; 60:803–817.
[PubMed: 19081376]
Kim T-K, Hemberg M, Gray JM, Costa AM, Bear DM, Wu J, Harmin DA, Laptewicz M, Barbara-Haley K, Kuersten S, et al. Widespread transcription at neuronal activity-regulated enhancers. Nature. 2010; 465:182–187. [PubMed: 20393465]
Koch F, Jourquin F, Ferrier P, Andrau J-C. Genome-wide RNA polymerase II: not genes only! Trends Biochem. Sci. 2008; 33:265–273. [PubMed: 18467100]
Krzywinski M, Schein J, Birol I, Connors J, Gascoyne R, Horsman D, Jones SJ, Marra MA. Circos: an information aesthetic for comparative genomics. Genome Res. 2009; 19:1639–1645. [PubMed: 19541911]
Lyu YL, Lin C-P, Azarova AM, Cai L, Wang JC, Liu LF. Role of topoisomerase IIbeta in the expression of developmentally regulated genes. Mol. Cell. Biol. 2006; 26:7929–7941. [PubMed: 16923961]
Madabhushi R, Pan L, Tsai L-H. DNA damage and its links to neurodegeneration. Neuron. 2014; 83:266–282. [PubMed: 25033177]
McKinnon PJ. Maintaining genome stability in the nervous system. Nat. Neurosci. 2013; 16:1523– 1529. [PubMed: 24165679]
Nitiss JL, Soans E, Rogojina A, Seth A, Mishina M. Topo-isomerase assays. Curr. Protoc. Pharmacol Chapter. 2012; 3 Unit 3.3.
Ong C-T, Corces VG. CTCF: an architectural protein bridging genome topology and function. Nat. Rev. Genet. 2014; 15:234–246. [PubMed: 24614316]
Phillips-Cremins JE, Sauria MEG, Sanyal A, Gerasimova TI, Lajoie BR, Bell JSK, Ong CT, Hookway TA, Guo C, Sun Y, et al. Architectural protein subclasses shape 3D organization of genomes during lineage commitment. Cell. 2013; 153:1281–1295. [PubMed: 23706625]
Ran FA, Hsu PD, Wright J, Agarwala V, Scott DA, Zhang F. Genome engineering using the CRISPR-Cas9 system. Nat. Protoc. 2013; 8:2281–2308. [PubMed: 24157548]
Rodriguez R, Miller KM, Forment JV, Bradshaw CR, Nikan M, Britton S, Oelschlaegel T, Xhemalce B, Balasubramanian S, Jackson SP. Small-molecule-induced DNA damage identifies alternative DNA structures in human genes. Nat. Chem. Biol. 2012; 8:301–310. [PubMed: 22306580] Rogakou EP, Pilch DR, Orr AH, Ivanova VS, Bonner WM. DNA double-stranded breaks induce
histone H2AX phosphorylation on serine 139. J. Biol. Chem. 1998; 273:5858–5868. [PubMed: 9488723]
A
uthor Man
uscr
ipt
A
uthor Man
uscr
ipt
A
uthor Man
uscr
ipt
A
uthor Man
uscr
ipt
Sala C, Futai K, Yamamoto K, Worley PF, Hayashi Y, Sheng M. Inhibition of dendritic spine morphogenesis and synaptic transmission by activity-inducible protein Homerla. J. Neurosci. 2003; 23:6327–6337. [PubMed: 12867517]
Suberbielle E, Sanchez PE, Kravitz AV, Wang X, Ho K, Eilertson K, Devidze N, Kreitzer AC, Mucke L. Physiologic brain activity causes DNA double-strand breaks in neurons, with exacerbation by amyloid-β. Nat. Neurosci. 2013; 16:613–621. [PubMed: 23525040]
Teves SS, Henikoff S. Transcription-generated torsional stress destabilizes nucleosomes. Nat. Struct. Mol. Biol. 2014; 21:88–94. [PubMed: 24317489]
Tiwari VK, Burger L, Nikoletopoulou V, Deogracias R, Thakurela S, Wirbelauer C, Kaut J, Terranova R, Hoerner L, Mielke C, et al. Target genes of Topoisomerase II regulate neuronal survival and are defined by their chromatin state. Proc. Natl. Acad. Sci. USA. 2012; 109:E934–E943. [PubMed: 22474351]
Veuger SJ, Curtin NJ, Richardson CJ, Smith GC, Durkacz BW. Radiosensitization and DNA repair inhibition by the combined use of novel inhibitors of DNA-dependent protein kinase and poly(ADP-ribose) polymerase-1. Cancer Res. 2003; 63:6008–6015. [PubMed: 14522929] Vos SM, Tretter EM, Schmidt BH, Berger JM. All tangled up: how cells direct, manage and exploit
topoisomerase function. Nat. Rev. Mol. Cell Biol. 2011; 72:827–841. [PubMed: 22108601] Wang WY, Pan L, Su SC, Quinn EJ, Sasaki M, Jimenez JC, Mackenzie IR, Huang EJ, Tsai LH. Interaction of FUS and HDAC1 regulates DNA damage response and repair in neurons. Nat. Neurosci. 2013; 16:1383–1391. [PubMed: 24036913]
West AE, Greenberg ME. Neuronal activity-regulated gene transcription in synapse development and cognitive function. Cold Spring Harb. Perspect. Biol. 2011; 3:3.
Yankulov K, Yamashita K, Roy R, Egly JM, Bentley DL. The transcriptional elongation inhibitor 5,6-dichloro-1-beta-D-ribofuranosylbenzimidazole inhibits transcription factor IIH-associated protein kinase. J. Biol. Chem. 1995; 270:23922–23925. [PubMed: 7592583]
A
uthor Man
uscr
ipt
A
uthor Man
uscr
ipt
A
uthor Man
uscr
ipt
A
uthor Man
uscr
ipt
Highlights
• Neuronal activity causes the formation of DNA double strand breaks (DSBs)
• Activity-induced DSBs form within the promoters of a subset of early-response genes
• Topoisomerase IIβ is necessary for activity-induced DSB formation
• Activity-induced DSBs facilitate the expression of early-response genes in neurons
A
uthor Man
uscr
ipt
A
uthor Man
uscr
ipt
A
uthor Man
uscr
ipt
A
uthor Man
uscr
ipt
In Brief
The formation of activity-induced DNA double strand breaks within promoter regions is required for transcription of a subset of neuronal early-response genes that are crucial for experience-driven synaptic changes associated with learning and memory.
A
uthor Man
uscr
ipt
A
uthor Man
uscr
ipt
A
uthor Man
uscr
ipt
A
uthor Man
uscr
ipt
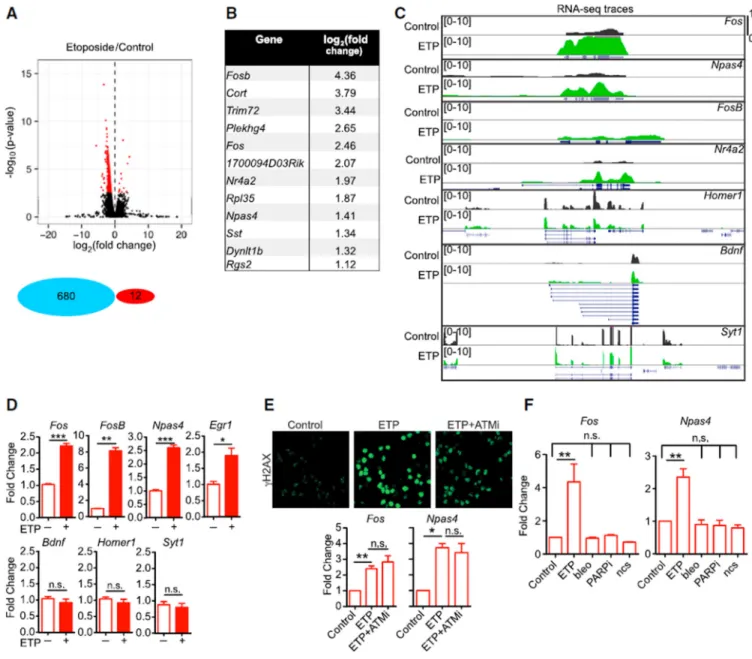
Figure 1. Early-Response Genes Are Upregulated following Etoposide Treatment of Neurons
(A) Cultured primary neurons (DIV 10) were incubated with either vehicle (DMSO) or etoposide (5 µM) for 6 hr, following which RNA was extracted and subjected to RNA-seq. (Top) Differentially expressed genes are shown in a volcano plot, and genes whose expression was altered significantly (p < 0.05) are indicated in red. (Bottom) Schematic indicating the number of downregulated (blue) and upregulated genes (red).
(B) List of upregulated genes in etoposide-treated neurons and their relative fold change (log2) compared to vehicle-treated controls.
(C) UCSC genome browser snapshots of RNA-seq trace files from etoposide-treated neurons (green) and vehicle-treated controls (black) at various neuronal activity-regulated genes (violet bars), y axis represents signal intensity and the scale is indicated in parentheses.
A
uthor Man
uscr
ipt
A
uthor Man
uscr
ipt
A
uthor Man
uscr
ipt
A
uthor Man
uscr
ipt
(D) Cultured primary neurons were treated with either etoposide (5 µM) orvehicle (DMSO) for 20 min, following which RNA was extracted, and the expression of the indicated genes were assessed using qRT-PCR (n = 3, *p < 0.05, **p < 0.01, ***p < 0.001, two-tailed t test). (E) Cultured primary neurons were pre-incubated with the ATM inhibitor, KU55933 (ATMi), for 30 min following which etoposide treatment was performed as in (D). (Top) Neurons were immunostained with antibodies against γH2AX following treatment with etoposide either in the presence or absence of ATMi. (Bottom) The expression of early-response genes, Fos and Npas4, were assessed using qRT-PCR (n = 3, *p < 0.05, **p < 0.01, one-way ANOVA).
(F) Cultured primary neurons were incubated with the indicated drugs for 20 min, following which the expression of Fos and Npas4 was assessed using qRT-PCR (n = 3, **p < 0.01, one-way ANOVA).
A
uthor Man
uscr
ipt
A
uthor Man
uscr
ipt
A
uthor Man
uscr
ipt
A
uthor Man
uscr
ipt
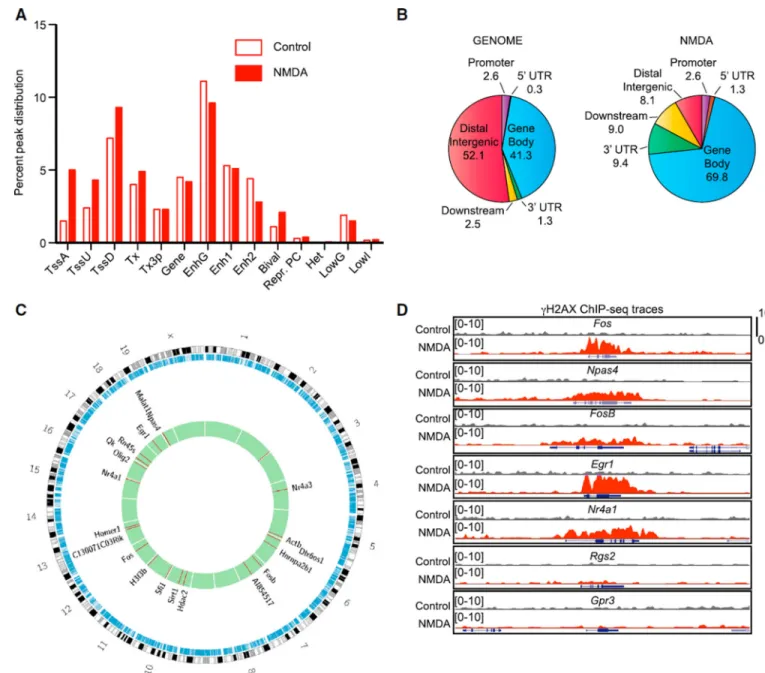
Figure 2. Neuronal Activity-Induced DNA DSBs Form at Early-Response Genes
(A) Genomic regions were categorized into 14 distinct chromatin states based on
combinatorial patterns of various chromatin marks (Figure S2A). The percentage of γH2AX peaks within each chromatin state were then normalized to the proportion of the genome with that chromatin state and plotted.
(B) γH2AX ChIP-seq signals enriched in NMDA-treated samples relative to controls were processed using CEAS (Cis-Regulatory Element Annotation System) program (http:// liulab.dfci.harvard.edu/CEAS/). (Left) Pie chart depicting the relative proportions of the indicated annotated regions in the genome. (Right) Disposition of γH2AX signals within these annotated genomic regions.
(C) Differential peak calling was performed to determine the regions that were enriched for
γH2AX following NMDA treatment (Experimental Procedures). This data were then
A
uthor Man
uscr
ipt
A
uthor Man
uscr
ipt
A
uthor Man
uscr
ipt
A
uthor Man
uscr
ipt
processed using CIRCOS software (Krzywinski et al., 2009) to generate the shown circular representation. The outer ring depicts the mouse chromosomes. The blue ring represents a map of gene densities, and the green ring indicates γH2AX signals. Red lines within the green ring represent loci that were enriched for γH2AX relative to controls. Twenty loci were within genes, and these genes are indicated. One locus was within intergenic regions. (D) UCSC genome browser views depicting the disposition of γH2AX signals within various activity-regulated genes under basal conditions (control) and following NMDA treatment, y axis represents intensity and the range is indicated in parentheses.
A
uthor Man
uscr
ipt
A
uthor Man
uscr
ipt
A
uthor Man
uscr
ipt
A
uthor Man
uscr
ipt
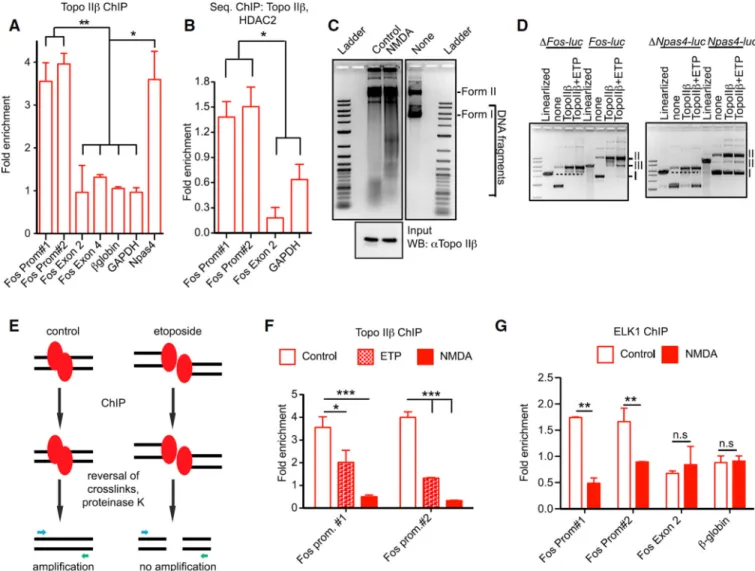
Figure 3. Topo IIβ Binds to the Promoters of Early-Response Genes under Basal Conditions and Cleaves Them in Response to Neuronal Activity
(A) ChIP analysis of Topo IIβ binding to the promoters of Fos and Npas4. Two distinct primer sets (Fos Prom#1 and Fos Prom#2, respectively) were used to probe the Fos promoter region. In addition, two different exons within the Fos gene (exons 2 and 4), as well as the promoters of Npas4, β-globin, and GAPDH, were also probed (n = 3, *p < 0.05, **p < 0.01, one-way ANOVA).
(B) Sequential ChIP analysis of HDAC2 and Topo IIβ binding to the Fos promoter. Cultured primary neurons were first subjected to ChIP with antibodies against Topo IIβ. The
crosslinked proteins were then immunoprecipitated with antibodies against HDAC2. Primers were as in (A) (n = 3, *p < 0.05, one-way ANOVA).
(C) Topo IIβ was immunoprecipitated from cultured primary neurons following NMDA treatment. The precipitated Topo IIβ was then incubated with 1 µg of a supercoiled luciferase reporter plasmid carrying ~6 kb of upstream regions of the Npas4 gene. Reactions were then incubated at 30°C for 15 min, stopped, and electrophoresed through 1% agarose gels. Letters indicate the positions of supercoiled (I) and relaxed (II) and DNA. Substrate DNA alone was run to indicate the migration of supercoiled and relaxed DNA (top). Input fractions (5%)
A
uthor Man
uscr
ipt
A
uthor Man
uscr
ipt
A
uthor Man
uscr
ipt
A
uthor Man
uscr
ipt
collected prior to immunoprecipitation were electrophoresed through 6% SDS-PAGE gels and analyzed by western blotting (bottom).
(D) Luciferase reporter constructs containing sequences upstream of either the Fos TSS or the Npas4 TSS were incubated with purified recombinant human Topo IIβ (8 units/reaction) either in the presence or absence of etoposide (0.2 mM final). Reactions were then incubated at 30°C for 15 min, stopped, and electrophoresed through 1 % agarose gels. As controls, constructs lacking the Fos and Npas4 sequences (ΔFos-luc and ΔNpas4-luc) were also analyzed. Dashed line indicates the size of the linearized construct. Letters indicate the positions of supercoiled (I), relaxed (II) and linear (III) DNA.
(E) Schematic showing how DNA cleavage by Topo IIβ (red ovals) would preclude the amplification of the Fos promoter by PCR primers utilized in (A) (indicated by blue and green arrows).
(F) ChIP analysis of Topo IIβ binding at the Fos promoter following either etoposide or NMDA treatment. Control bar graphs are as in (A) (n = 3, *p < 0.05, ***p < 0.001, two-way ANOVA).
(G) ChIP analysis of ELK1 binding at the indicated regions under basal conditions and following NMDA treatment (n = 3, **p < 0.01, two-way ANOVA).
A
uthor Man
uscr
ipt
A
uthor Man
uscr
ipt
A
uthor Man
uscr
ipt
A
uthor Man
uscr
ipt
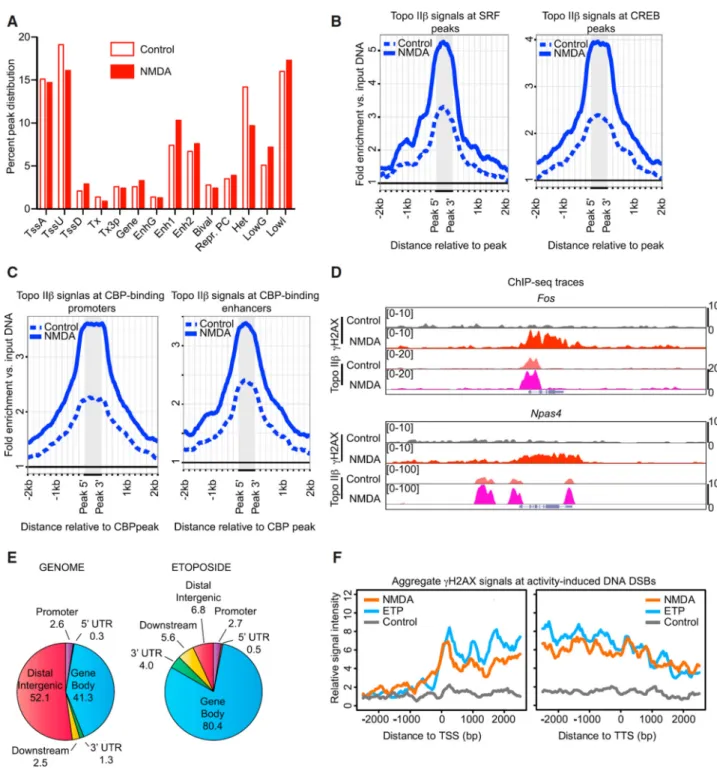
Figure 4. Genome-wide Topo IIβ DNA Cleavage Patterns Coincide with the Sites of Neuronal Activity-Induced DSBs
(A) Genomic regions were categorized into 14 distinct chromatin states based on
combinatorial patterns of various chromatin marks (Figure S2A). The percentage of Topo IIβ peaks within each chromatin state were then normalized to the proportion of the genome within that chromatin state and plotted.
(B) Publicly available ChIP-seq datasets of SRF and CREB (Kim et al., 2010) were used to determine the binding profiles of Topo IIβ relative to the binding sites of these proteins. The graphs indicate the averaged binding patterns of Topo IIβ within a 4kb window of all SRF
A
uthor Man
uscr
ipt
A
uthor Man
uscr
ipt
A
uthor Man
uscr
ipt
A
uthor Man
uscr
ipt
(left) and CREB (right) peaks. Dashed line indicates the profile under basal conditions, whereas the solid line depicts the profiles following NMDA treatment.
(C) Binding profiles of Topo IIβ within a 4 kb window of CBP peaks at either promoters (left) or enhancers (right) were generated as in (B).
(D) UCSC genome browser views denoting the disposition of γH2AX and Topo IIβ signals at Fos and Npas4 under the indicated conditions, y axis denotes signal intensity and the range is indicated in parentheses.
(E) γH2AX ChIP-seq signals enriched in etoposide-treated samples relative to controls were processed using CEAS (Cis-Regulatory Element Annotation System) program (http:// liulab.dfci.harvard.edu/CEAS/). (Left) Pie chart depicting the relative proportions of the indicated annotated regions in the genome as in Figure 2A. (Right) Disposition of differential γH2AX signals within these annotated genomic regions following etoposide treatment.
(F) Aggregate plots of input-normalized γH2AX signals at the 20 loci that show increased
γH2AX intensity following NMDA treatment were generated for NMDA-treated (orange),
etoposide-treated (blue) and control (gray) conditions. Graph on the left shows the
distribution within a 2 kb window of the transcription start site (TSS), whereas the graph on the right denotes the distribution near the transcription termination site (TTS). Plots were generated using annotatePeaks.pl command of HOMER software and custom R scripts.
A
uthor Man
uscr
ipt
A
uthor Man
uscr
ipt
A
uthor Man
uscr
ipt
A
uthor Man
uscr
ipt
Figure 5. Activity-Induced DNA DSBs Occur within Topological Domains Defined by CTCF Binding
(A) Topo IIβ peaks in NMDA-treated samples were categorized into two groups—Class I represents new Topo IIβ peaks that appear after NMDA treatment and Class II denotes Topo IIβ peaks that are present under both basal and NMDA-treated conditions. Aggregate plots of γH2AX signals within a 4 kb window relative to Topo IIβ peaks in each class were then generated as in Figure 4F.
(B) Motif scans at genome-wide Topo IIβ binding sites under basal conditions revealed a strong enrichment for the CTCF transcription factor binding site motif (CTCF_1; http://
A
uthor Man
uscr
ipt
A
uthor Man
uscr
ipt
A
uthor Man
uscr
ipt
A
uthor Man
uscr
ipt
www.broadinstitute.org/~pouyak/motifs-table/) in the vicinity of Topo IIβ peaks. The plot denotes the disposition of input-normalized Topo IIβ signals relative to CTCF sites that displayed Topo IIβ peaks in their vicinity. Dashed line denotes the profile of Topo IIβ under basal conditions (control), whereas the solid line indicates Topo IIβ profiles in NMDA-treated samples.
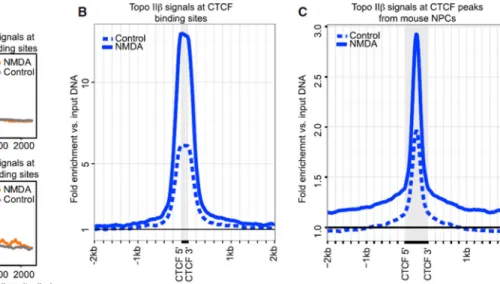
(C) Publicly available CTCF ChIP-seq datasets from the cortical plate of 8 week-old mice (GEO: GSM918727) were used to determine the overlap of CTCF and Topo IIβ binding profiles at CTCF motifs that were enriched for Topo IIβ peaks in (B). The gray bar in the middle indicates the width of the CTCF peak at these sites. Dashed line denotes the profile of Topo IIβ under basal conditions (control), whereas the solid line indicates Topo IIβ profiles in NMDA-treated samples.
(D) A similar analysis to (C) was conducted using another publicly available CTCF ChIP-seq dataset from mouse neural progenitors (Phillips-Cremins et al., 2013). Grey bar and lines are as in (C).
(E) Aggregate plots of input-normalized CTCF (violet) (Phillips-Cremins et al., 2013) and
γH2AX (orange) signals within a 4 kb window relative to the transcription start site (TSS)
and transcription termination site (TTS) (gray box) of the loci that show increased γH2AX intensity following NMDA treatment.
(F) Aggregate plots of input-normalized CTCF (violet) (Phillips-Cremins et al., 2013) and
γH2AX(blue) signals within a 4 kb window relative to the TSS and TTS (gray box) of the
loci that show increased γH2AX intensity following etoposide treatment.
A
uthor Man
uscr
ipt
A
uthor Man
uscr
ipt
A
uthor Man
uscr
ipt
A
uthor Man
uscr
ipt
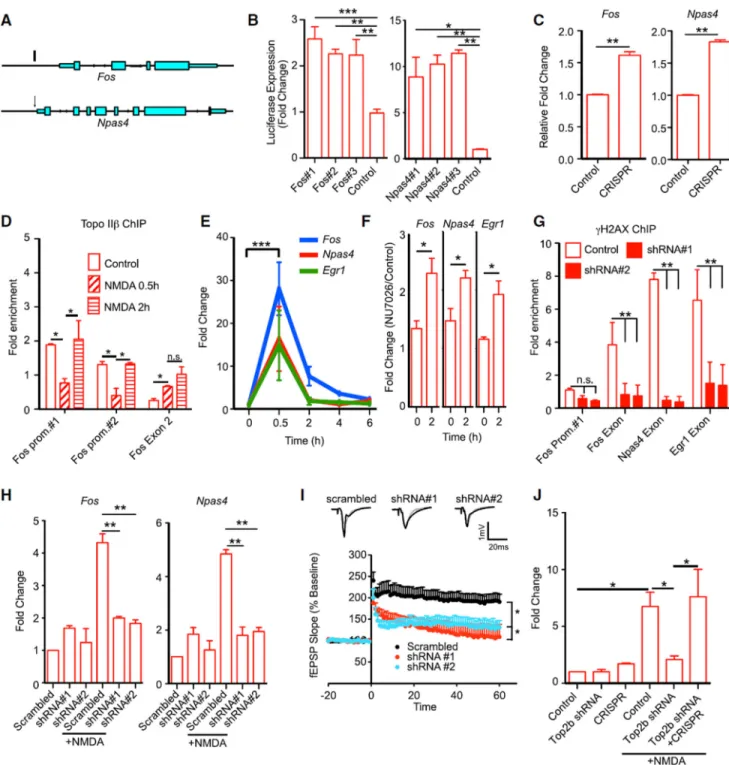
Figure 6. Topo IIβ-Mediated DNA DSBs Govern the Expression of Early-Response Genes Following Neuronal Activity
(A) Schematic of Fos and Npas4 genes with arrows indicating the positions of sgRNA-directed DNA cleavage by Cas9
(B) HEK293T cells were transfected with luciferase reporter constructs under the control of either Fos or Npas4 upstream sequences, together with the indicated sgRNA and Cas9-carrying constructs and Renilla. Three distinct sgRNAs were used for each locus (#1-#3). Luciferase expression was measured 16 hr after transfection. As a control, luciferase reporter
A
uthor Man
uscr
ipt
A
uthor Man
uscr
ipt
A
uthor Man
uscr
ipt
A
uthor Man
uscr
ipt
constructs in each case were transfected with Cas9 and sgRNAs directed to the Bdnf promoter (n = 3, *p< 0.05, **p < 0.01, ***p < 0.001, one-way ANOVA)
(C) Cultured primary neurons were infected with lentiviral vectors carrying Cas9 and sgRNAs directed to either the Fos or the Npas4 promoter. RNA was extracted 8 days post-infection and the expression of Fos and Npas4 was determined relative to neurons infected with sgRNAs directed to the Bdnf promoter using qRT-PCR (n = 3, **p < 0.01, two-tailed t test).
(D) Cultured primary neurons were treated with NMDA as before and allowed to recover in NMDA-free media. Topo IIβ ChIP was then performed at the indicated times and the amplification of the Fos promoter was assessed as in Figure 3A (n = 3, *p < 0.05, two-way ANOVA).
(E) Cultured primary neurons were treated with NMDA as before and allowed to recover in NMDA-free media. RNA was then extracted at the indicated times and the expression of Fos, Npas4, and Egr1 was assessed using qRT-PCR (n = 4, ***p < 0.001, one way-ANOVA).
(F) Cultured primary neurons were incubated with a specific inhibitor of DNA-PK (NU7026) for 1 hr, following which neurons were treated with NMDA and allowed to recover in NMDA-free media. RNA was extracted 2 hr after the initial NMDA treatment (time = 0, x axis), and the levels of Fos, Npas4, and Egr1 was assessed relative to neurons treated with NMDA in the absence of NU7026 using qRT-PCR (n = 4, *p < 0.05, two-tailed t test).
(G) Cultured primary neurons were infected with lentiviral vectors carrying either a scrambled shRNA (control) or one of two distinct shRNAs against Top2b (shRNA#1 or shRNA#2). One week after the infection, neurons were treated with NMDA (50 µM) for 10 min followed by recovery in NMDA-free media for an additional 10 min. Enrichment of
γH2AX within exons of Fos, Npas4, and Egr1 was assessed using ChIP. As a control, the
Fos promoter region was also probed (n = 3, **p < 0.01, two-way ANOVA).
(H) Cultured primary neurons were infected with Top2b shRNAs and treated with NMDA as in (G). RNA was then extracted and the levels of Fos and Npas4 were probed using qRT-PCR (n = 4, **p < 0.01, one-way ANOVA).
(I) Scrambled and Top2b shRNAs were stereotactically injected into the hippocampus of two-month old C57BL/6 mice. Four weeks after the injections, acute hippocampal slices were prepared and LTP was induced by 3x TBS at the Schaffer collateral-CA1 synapses. Sample traces represent fEPSPs 1 min before (gray) and 1 hr after (black) TBS. Scale bars, 1 mV and 20 ms (5–6 slices per animal, 3 animals per group, *p < 0.05, one-way ANOVA). (J) Cultured primary neurons were infected with a combination of lentiviral vectors carrying Cas9 and sgRNAs directed to the Fos promoter (CRISPR) together with Top2b shRNAs. Controls represent neurons infected with Cas9 and sgRNAs directed to the Bdnf promoter together with scrambled shRNAs (control). One week after the lentiviral infections, neurons were treated with NMDA (50 µM) for 10 min followed by recovery in NMDA-free media for 10 min. RNA was then extracted and Fos expression was assessed using qRT-PCR (n = 3, *p < 0.05 one-way ANOVA).