READ THESE TERMS AND CONDITIONS CAREFULLY BEFORE USING THIS WEBSITE. https://nrc-publications.canada.ca/eng/copyright
Vous avez des questions? Nous pouvons vous aider. Pour communiquer directement avec un auteur, consultez la première page de la revue dans laquelle son article a été publié afin de trouver ses coordonnées. Si vous n’arrivez pas à les repérer, communiquez avec nous à [email protected].
Questions? Contact the NRC Publications Archive team at
[email protected]. If you wish to email the authors directly, please see the first page of the publication for their contact information.
NRC Publications Archive
Archives des publications du CNRC
This publication could be one of several versions: author’s original, accepted manuscript or the publisher’s version. / La version de cette publication peut être l’une des suivantes : la version prépublication de l’auteur, la version acceptée du manuscrit ou la version de l’éditeur.
Access and use of this website and the material on it are subject to the Terms and Conditions set forth at
Initial slides in leda clay
Law, K. T.
https://publications-cnrc.canada.ca/fra/droits
L’accès à ce site Web et l’utilisation de son contenu sont assujettis aux conditions présentées dans le site
LISEZ CES CONDITIONS ATTENTIVEMENT AVANT D’UTILISER CE SITE WEB.
NRC Publications Record / Notice d'Archives des publications de CNRC:
https://nrc-publications.canada.ca/eng/view/object/?id=26064831-51ee-43c4-960a-25ca47e3cdbf
https://publications-cnrc.canada.ca/fra/voir/objet/?id=26064831-51ee-43c4-960a-25ca47e3cdbf
LO.
1103
National Research
Conseil national
c. 2
I
$
Council Canada
de recherches Canada
BLDG
INITIAL SLIDES I N LEDA CLAY
by K.T. Law
ANALYZED
Proceedings,
International Symposium on Landslides, Volume
I
New Delhi, India, 1980
p.331
-
336
Reprinted with permission of
Central Building Research Institute
Roorkee, India.
,
DBR Paper No. 1103
Division of Building Research
Price $1.00
OTTAWA
I
NRCC 22412
>I-" U ~ G ,
RES.
L I B R A R Y
03-
01-
1 4
~ l s ~ \ o r n l a u ~
R&.
BBtim.
C N Q C-
I C I S T7
R ~ u M ~
Les amorces de g l i s s e m e n t s s o n t d e s p e n t e s q u i s u b i s s e n t
3
l o n g
terme une r u p t u r e .
Des exp'eriences o n t
B t B
men'ees i n s i t u
e t e n
l a b o r a t o i r e , pour B t u d i e r
l e
comportement
3
l o n g
terme d'une p e n t e
n a t u r e l l e , l e l o n g d'une r i v e de
l a r i v i s r e d e s Outaouais, e n
O n t a r i o au Canada.
Ona observB
l e comportement d e l a p e n t e a v e c
d e s piBzomStres U e c t r i q u e s ,
e t e f f e c t u s d e s l e c t u r e s s u i v i e s s u r
une pBriode de t r o i s a n s , pour o b t e n i r l a d i s t r i b u t i o n .3 l o n g
terme d e s p r e s s i o n s i n t e r s t i t i e l l e s au-dessous d e l a pente.
On
a
soumis l e s B c h a n t i l l o n s de s o l
3
d i v e r s
essais c o n t r a l 6 s a v e c
c o n t r a i n t e s o r i e n t ' e e s , au l a b o r a t o i r e e t i n s i t u ; on a u t i l i s ' e
l ' i n f o r m a t i o n obtenue e n l a b o r a t o i r e pour a n a l y s e r un g l i s s e m e n t
proche, p a r une m6thode e x p l i q u a n t l a r u p t u r e g r a d u e l l e .
On
l ' a
p l u s t a r d appliquBe .3 d ' a u t r e s c a s types.
L
k
ce f a i t , on a obtenu
une n o u v e l l e i n t e r p r g t a t i o n d e s amorces de g l i s s e m e n t s dans l e s
INITIAL SLIDES
IN
LEDA
CLAY
K.T.
LAW
~ e o t s c h o i a l S o d i o n , N a t i o d R s s a r c h C o l m d l o f C . a d q ~ ~ ~
, Sumnary
Initial slides are slopes t'lat fail under the long-term condition. Field and laboratory experiments to stlldy the long-term hehaviour of a natural slope were conducted on a hr~nk of the Ottawa Rivcr, Ontario, Canada. The slope was instrumented with electric ~)iezometers and co~~tinuo~ls rcadings wcrc made over a period of three years to give the long-term pore pressure distrib~rtion heneath the slope. Soil samples were subjected to various controlled stress path tests in the laboratory and field and laboratory information was used in analyzing a nearby slope failure by means of a method that accounts for progressive failure. It was later extended to other case records. As a result, a new interpretation was obtained of initial slides in Leda clay in the Ottawa region.
Introduction Measurement of Groundwater Flow
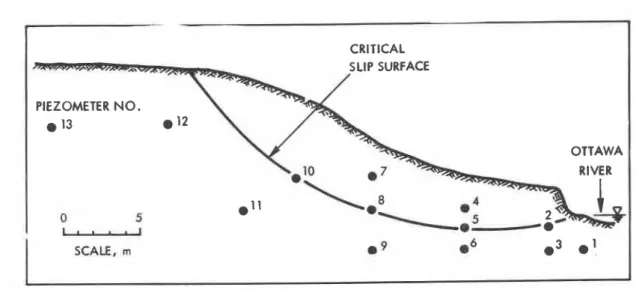
An initial slide .in Leda clay is a long-term The instrumented section is locatedona slopeof instability involving mostly a single rotational a c l a y t e r r a c e a t t h e R o c k c l i f f e Air Base, on the
slip. It is different from a flowslide which is south bank of the Ottawa River. Thirteen vibra- retrogressive in nature. Depending on circum- ting-wire piezometers were used to measure the stances, an initial slide may trigger a large pore pressure distribution beneath the slope flowslide callsing heavy loss of property and (Fig. 1). Initially all of them were Geonor life (Beland 1956; Tavenas et a1 19711. piezometers but three of them (Nos. 11, 12 and An important contribution to the understanding
of the mechanics of initial slides was made by Eden and Mitchell (1970). They show that initial slides are generally associated with abundant ground and surface water. Many of them are shallow and involve the weathered crust that may extend to a depth of 10 m. The soil inthe crust is fissured and at low pressure range behaves as a dilative material with a high frictional resistance. Furthermore,Mitchell and Eden (1972) and Eden (1977) reported measurements of deep- seated creep in natural slopes.This impliedthat some soil in the slope had undergoneappreciable strain and its behaviour may depart from that for the small strain condition. '
To anal)*> initial slides, information on the groundwater flow and shear behaviour of the soil is essential. During a wet season, a high tran- sicnt groundwater table may be generated. Such a condition can be bettcr recorded by fast-respon- ding piezometers and taking sufficiently fre- quent readings. Concern about the test proced- ures used to measure shear behaviour has been expressed (Mitchell 1975). Ideally these procedures should permit failure to occur along various stress paths resembling those in the field and should be able to yield information on the shear behaviour at large strain. Also, the theory should account for a possible strength difference for small and large strains. At) attempt to study initial slides meeting the above requirements is reported herein. The study consists of instrumenting a typical natural slope near Ottawa, Canada; shearing undisturbed soil specimens through various stress paths and analyzing a nearby slide that took place in1967. Other records of initial slides are also
13) broke down afterone yearofservice .and were replaced by the IRAD vibrating-wire piezometers. All of them measured pressures to a precision of about 0.7 kPa.
Prior to installation, the piezometers were calibrated in the laboratory. After the field e~periment~they were taken back tothe laboratory for recalibration to check for any significant change in characteristics. Eight piezometers
(Nos.1,3,6,8,9,11,12,13) retained practicallythe
same characteristics; three (Nos. 2, 5 and 8) experienced a zero shift of about 4.6 kPa; and two (Nos. 4 and 10) suffered from a substantial zero shift. This information enabled examination of the reliability of the piezometric readings and application of the appropriate corrections. Readings from the piezometers were taken using a data acquisition system designed by and built in the Instrumentation Unit, Division of Building Research, National Research Council of Canada. The major components of this systemare ascanner. a readout unit and a printer. The scanner con- trolled the rate at which readings were taken.The readout unit excited the wire in the piezometer and measured the frequency of the vibration. The printer put on permanent record the measured frequency.The whole system washoused in a nearby building and was connected to the piezometer via a shielded Beldon cable 300 m long. Hourlyread- ings were taken throughout the three-year experiment
..
The piezometers were arranged so that theyprovi- ded adequate data for drawing flownets. Some
(Nos.2,5,8.10) were purposely located on the cri- tical slip surface for stability consideration. All the piezometers were shallow as initial slides in Leda clay have been of limited depth. examined which yielded a new interpretation of A sununary of all the measurements without zero
CRITICAL
PIEZOMETER N O .
OTTAWA
II...I
SCALE, m 9
e6
03o 1
Figure 1. Slope geometry and location of piezometers
PIEZOMETER
1
A O D F A J A O D F A J A O D F A J
1976 1977 1978 1979
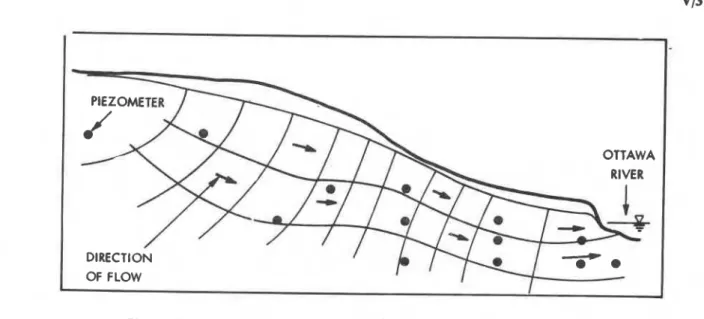
DIRECTION OF FLOW
i'.
Figure 3. Flownet based on observed maximum pore pressure in spring 1977
consistent picture is observed: all piezometers indicate high pore pressures in wet seasons and
low values in dry seasons. P slight negative
pressure has been registered by somepiezometers. For stability analyses, it is convenient to express the piezometric measurements at a point in terms of the pore pressure parameter r" defined as
rU = hwYw / hYb
where hw,h are the water head and depth belowthe ground surface respectively, and Yw, Yb the unit weights of water and soil respectively.
The maximum r,, values at all the locations for the three spryngtime periods are listed in Table 1,. A correction due to zero shift was
Table I: Maximum ru values in spring Location of
piezometers 1977 1978 1979
*River level higher than ground surface applied based on the following assumption: zero correction for spring 1977, the first wet season
after installation; full correction equal to the
measured shift after the experiment for spring
1979, the season just prior to the piczometer
retrieval and one half correction for spring 197%. I h e I978 and 1979 readings o f piezo-tefs
4 and 10 a m disregarded because of tha severe
Shift: Tho average maAmm ru values along the
probable slip surface are 0.40, 0.38 and 0.33 for 1977, 1978 and 1979 respectively.
All maximum rU values within the slope are less than the fully saturated horizontal groundwater
flow conditions, i.e., r = Y / Yb = 0.62,
often assumed in slope svabilyty analyses (Eden and Mitchell 1970, 10 and Lee 1974). It has beeri argued that an average ru of about 0.62 within the whole slope may be encountered during heavy rainfall in a wet season although piezometric measurements (Jarrett and Eden 1970, Mitchell 1970, Eden and Jarrett 1971) repeatedly failed to indicate such a high value.
The maximum pore pressures were observed in the spring of 1977. The corresponding flownet is shown in Figure 3, which indicates that the soil is hydraulically anisotropic. In general, flow is below that for a saturated condition. In most parts of the slope the flow is more or less parallel to the slope surface except near the toe where it is horizontal. In very wet seasons the phreatic line may reach the ground surface but it is unlikely that the flow pattern will be greatly altered. Thus high ru (around 0.62) values near the toe and lower values, depending on the slope inclination, up in the slope may be registered (Crawford and Eden 1967). The average ru on a prospective critical slip surface is therefore generally less than 0.62.
Many natural landslides occur in the springtime, particularly in those of heavy snow melt and rainfall. Both of these contribute to a rise of ru values. Precipitation records should show whether the observed rU values are of typical years. As the highest ru values occur around early April, it is appropriate to consider the annual total precipitation from April to Marchof the following year, or the cumulative precipita- tion of the four months preceding each April. Such records for the past 27 years at a station 2 km from the site indicate that the springs of 1977 and 1978, two out of the three years of observation, are among the seven wettest. 'Ihe ru values presented herein themfore correspond to typical wet years.
V / 3
Labcratory Tests for Strength Parameters during the test. In test types (3)and (4),part of
Osterberg soil samples for laboratory testing, the volume increase is due to decrersing a&t.
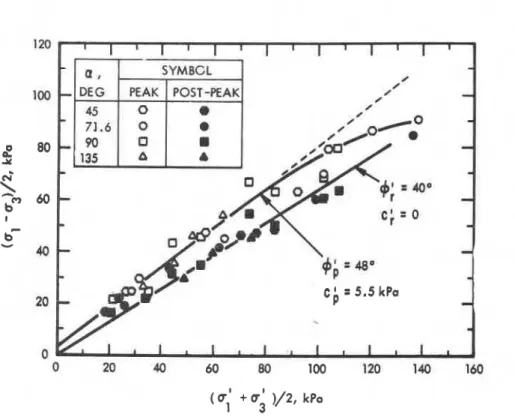
124 mm diameter, were recovered near the crest From Fig. 6, which gives summary of results at
of the slope, fro3 depths 4 m to 8 a. The soil the ~ a and post-peak conditions, it appears k
is a fairly uniform stiff fissured clay with that there is a common peak strength envelopefe
moisture content varying from 65% to 70%. a71 the stress paths to failure. It is a curved
mvelope but since the average effective normal The system capable of carrying out controlled
stress path tests under a constant strain rate pressure operative in landslides in Leda clay is
consists of three main components: a conven- less than 35 kPa (Lo and Lee 1974), a linear
tional triaxial cell, an electric-pneumatic approximation for this pressure range is adequata
transducer and a mini-computer. Soil specimens 'Ihe pe k strength parameters thus obtained are
can be mounted and sheared at a constant strain given ~y an angle of intyrnal friction, #;,equal
to 48' and a cohesion, c
,
of 5.5 kPa. A commonrate in a manner to
an
triaxial post-peak strength envelhe is also found and,test. The electric-pneumatictransducer delivers for the same pressure
the strength
a pressure upon receiving a voltage from the
mini-computer. This pressyre is fed to the back parameters are given by 4; = 40' and c;. 0.
pressure line and will vary the effective It is significant to find two distinct strength
confining pressure on the sppcimen f.llowing a envelopes, one for peak and the other for post-
prescribed stress path. The various responses peak conditions. Firstly, the concern that
of the specimen are monitored using load, pres- diffarent test procedures
or
stress paths maysure and displacement transducers and, after produce different strength parameters is removed.
being processed, are displayed on a teletype Provided the roper stress range is maintained,
terminal or stored on magnetic tape, both of simple triaxi& tests are as useful as sophisti-
which are attached to the mini-computer. cated controlled stress path tests. Secondly,
slope stability analyses are simplifiedas onlya
The stress path used in the present experiment' single set of strength parameters is required
is expressed in terms of two quantities: p' and even though different points in the slope may
q, where p' = (bi + a;)/2 and q = (a1
-
a3)/2. reach failure along different paths. Thirdly, asTo cover the possible range of stress paths the post-peak strength envelope differs from the
experienced in a slopeunder l~ng~termcondition, peak envelope, the processof progressive failure
four stress path types (Fig. 4) werd tried: may be operative along a prospective slipsurface.
1) constant effective lateral pressure (brdinary When both envelopes are available, this process
drained compression test); ') 'Act test can be analyzed using the lnethod of Law and Lumb
where
diet
( 0 ; + 2ui)/3,the effective octahed-ral normal stress; 3) constint
r
test, and (1978).4) constant effective vertical pressure with
decreasing effective lateral pressure. The angles between these stress paths from the p'
axis are 4S0, 71.6', 90° and 135' respectively. POST -PEAK
Typical stress-strain and volume strain-axial STRENGTH
strain cllrves for each stress path type are
shown in Fip. 5. All the stress-strai? curves 20
show a ma~ked peak followed by a drop to the
post-peak strenqth of magnitude depending on the
stress psth. Irrespective of the path to reach this stress range of f:lilurc,however,the volumes
of.specimens incre2~e at or beyond the peak.Such
a volumr i r ~ .case is clear:y due to dilatancy in -4
test types ( i ) and (2) as the octahedral nbrmal n.
stres~,u~,~,either incrczses or remains constalat Y
N 71.6 0
y g
-2 I--
W b-r Z
-4 11 0 2 4 6 8 1 0 0 2 4 6 8 1 0 AXIAL STRAIN, %P I -
i
'
u;
)/2 Figure 5. Typical str~ss-strain and volumetricstrain-axial strain curves from controlled
Figure 6. Summary The Rockcliffe Landslide, 1967
The Rockcliffe landslide (Mitchell 1970) was a retrogressive slide involving 23,000 m3 of Loda clay. It was triggered by an initial slide on a
slope 12.2 m high with inclination of 24
.
The slide, which occurred on 3 April 1967, was preceded by a number of events giving rise to a high water table. Early snow cover in the autumnof1966preventeddeepfrostpenetration. The last week o f ~ k r c h 1967 saw a major snow meltof0.5m. This was then followed by a heavy rainfall of
13.97 nun during which the slope failed. The groundwater flow situation was thereforeprobably worse than that observed during the three years of monitoring.
An analysis using the method of Law and Lumb (1978) was carried out based on the peak and post-peak strength parameters measured in
laboratory tests. A series of ru values were ased and the corresponding factors of safety computed (Fig. 7). As indicated, the slide would take place at rU=0.49,a condition slightly less than the case of saturated flow parallel to the slope (0.52, in this case) but substantially different from the saturated horizontal flow case. This ru (0.49) at failure is considered reasonable in the light of the results of the groundwater flow measurement.
Other Case Records
Two other initlal slides in tlie Ottawa region Mere coi.rid-red; their main fei.turc.5 are listed jn Table 11. The post-peak stren~ "-ir parameters in these cases were not measured snd reasonable
of test results
The Brackenridge Slide, 1963
This slide is described in detail by Crawford and Eden (1967) and triaxial test results at low pressure range were reported by Mitchell (1970), The totol height of this retrogressive failure was 28 m but because of the kinematic restraint suggested by Kenney and Ali (1968), the largest possible initial slide would be 15 m high.Using
P O R E PRESSURE PARAMETER, r
values wers zssumed so that the same method of u
VP
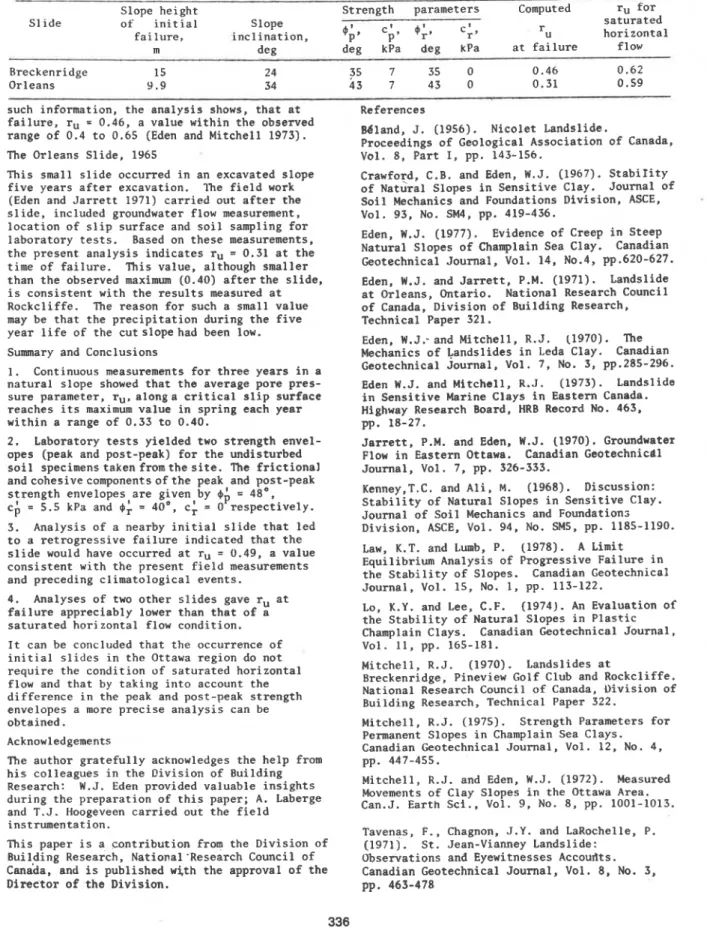
Table 11: Details of case records
Slope height Strength parameters Computed ru for
Slide of initial S 1 ope saturated
4;. c;. 4;. c;,
failure, inclination, r horizontal
m deg deg kPa deg kPa atfailure flow
Breckenridge 15 24 35 7 35 0 0.46 0.62
Orleans 9.9 34 43 7 43 0 0.31 0.59
such information, the analysis shows, that at References failure. ru = 0.46, a value within the observed
range of 0.4 to 0.65 (Eden and Mitchell 1973). Bbland, J. (1956). Nicolet Landslide.
Proceedings of Geological Association of Canada,
The Orleans Slide, 1965 Vol. 8, Part I, pp. 143-156.
This small slide occurred in an excavated slope Crawford, C.B. and Eden, W.J. (1967). Stabifity five years after excavation. lke field work of ~at"ra1 Slopes in Sensitive Clay. Journal of (Eden and Jarrett 1971) carried out after the Soil Mechanics and Foundations Division. ASCE, slide, included groundwater flow measurement, Vol. 93, No. SM4, pp. 419-436.
location of slip surface and soil sampling for
laboratory tests. Based on these measurements, Eden, W.J. (1977). Evidence of Creep in Steep the present analysis indicates ru = 0.31 at the Natural Slopes of Champlain Sea Clay. Canadian time of failure. This value, although smaller Geotechnical Journal, Vol. 14, No.4, pp.620-627. than the observed maximum (0.40) afterthe slide, Eden, W.J. and Jarrett, P.M. (1971). Landslide is consistent with the results measured at at Orleans, Ontario. National Research Council Rockcliffe. The reason for such a small value of Canada, Division of Building Research, may be that the precipitation during the five Technical Paper 321.
year life of the cut slope had been low.
Eden, W.J.- and Mitchell. R.J. (1970). The
Summary and Conclusions Mechanics of Landslides in Leda Clay. Canadian
Continuous measurements for three years in a Geotechnical Journal, Val. 7, No. 3, PP-285-296- natural slope showed that the average pore pres- Eden W.J. and Mitchell, R..J. (1973). Landslide sure parameter, ru, along a critical slip surface in Sensitive Marine Clays in Eastern Canada. reaches its maximum value in spring each year Highway Research Board, HRB Record No. 463,
within a range of 0.33 to 0.40. pp. 18-27.
2. Laboratory tests yielded two strength envel- Jerrett. P.M. and Eden, W.J. (1970). Groundwater opes (peak and post-peak) for the undisturbed Flow in Eastern Ottawa. Canadian Geotechnicel soil specimenstaken fromthe site. The frictional Journal, Vol. 7, pp. 326-333.
andcohesivecomponentsofthe peak and post-peak
strength envelopes are given by 4; = 48'. Kenney,T.C. and Ali. M. (1968). Discussion: ci = 5.5 kPa and 4; = 40°, c; = 0 respectively. Stability of Natural Slopes in Sensitive Clay.
Journal of Soil Mechanics and Foundations 3. Analysis of a nearby initial slide that led Division, ASCE, Vol. 94, No. SM5, pp. 1185-1190. to a retrogressive failure indicated that the
slide would have occurred at ru = 0.49, a value Law, K.T. and Lumb, P. (1978). A Limit consistent with the present field measurements Equilibrium Analysis of Progressive Failure in and preceding climatological events. the Stability of Slopes. Canadian Geotechnical
Journal, Vol. 15, No. 1, pp. 113-122. 4. Analyses of two other slides gave rU at
failure appreciably lower than that of a Lo, K.Y. and Lee, C.F. (1974). An Evaluation of saturated horizontal flow condition. the Stability of Natural Slopes in Plastic
Champlain Clays. Canadian Geotechnical Journal, It can be concluded that the occurrence of Vol. 11, pp. 165-181.
initial slides in the Ottawa region do not
require the condition of saturated horizontal Mitchell, R.J. (1970). Landslides at
flow and that by tzking into account the Breckenridge, Pineview Golf Club and Rockcliffe. difference in the peak and post-peak strength National Research Council of Canada, Division of envelopes a more precise analysis can be Building Research, Technical Paper 322.
obtained. Mitchell, R.J. (1975). Strength Parameters for
Acknowledgements Permanent Slopes in Champlain Sea Clays.
Canadian Geotechnical Journal, Vol. 12. No. 4 ,
The author gratefully acknowledges the help from pp. 447-455. his colleagues in the Division of Building
Research: W.J. Eden provided valuable insights Mitchell, R.J. and Eden, W.J. (1972). Measured Movements of Clay Slopes in the Ottawa Area. during the preparation of this paper; A' Laberge Can.J. Earth Sci., Val. 9, No. 8, pp. 1001-1013. and T.J. Hoogeveen carried out the field
instrumentation.
Tavenas, F., Chagnon, J.Y. and LaRochelle, P. This paper is a contribution from the Division of (1971). St. Jean-Vianney Landslide:
Building Research, National'Research Council of Observations and Eyewitnesses Accoulits. Canada, and is published with the approval of the Canadian Geotechnical Journal, Vol. 8. No. 3,
Director of the Division. pp. 463-478
This publication i s being distributed by the Division of Building R e s e a r c h of the National R e s e a r c h Council of Canada. I t should not be reproduced in whole o r in p a r t without permission of the original publisher. The Di- vision would be glad to be of a s s i s t a n c e in obtaining such permission.
Publications of the Division may be obtained by m a i l - ing the appropriate remittance (a Bank. Express, o r P o s t Office Money Order, o r a cheque, made payable to the Receiver General of Canada. c r e d i t NRC) to the National Research Council of Canada, Ottawa. KIA OR6.
Stamps a r e not acceptable.
A l i s t of a l l publications of the Division i s available and may be obtained f r o m the Publications Section, Division of Building Research, National R e s e a r c h Council of Canada. Ottawa. KIA OR6.