Publisher’s version / Version de l'éditeur:
Canadian Geotechnical Journal, 21, 2, pp. 250-258, 1984-05
READ THESE TERMS AND CONDITIONS CAREFULLY BEFORE USING THIS WEBSITE. https://nrc-publications.canada.ca/eng/copyright
Vous avez des questions? Nous pouvons vous aider. Pour communiquer directement avec un auteur, consultez la première page de la revue dans laquelle son article a été publié afin de trouver ses coordonnées. Si vous n’arrivez pas à les repérer, communiquez avec nous à PublicationsArchive-ArchivesPublications@nrc-cnrc.gc.ca.
Questions? Contact the NRC Publications Archive team at
PublicationsArchive-ArchivesPublications@nrc-cnrc.gc.ca. If you wish to email the authors directly, please see the first page of the publication for their contact information.
NRC Publications Archive
Archives des publications du CNRC
This publication could be one of several versions: author’s original, accepted manuscript or the publisher’s version. / La version de cette publication peut être l’une des suivantes : la version prépublication de l’auteur, la version acceptée du manuscrit ou la version de l’éditeur.
Access and use of this website and the material on it are subject to the Terms and Conditions set forth at
Comparison of snow pressure measurements and theoretical
predictions
McClung, D. M.; Larsen, J. O.; Hansen, S. B.
https://publications-cnrc.canada.ca/fra/droits
L’accès à ce site Web et l’utilisation de son contenu sont assujettis aux conditions présentées dans le site LISEZ CES CONDITIONS ATTENTIVEMENT AVANT D’UTILISER CE SITE WEB.
NRC Publications Record / Notice d'Archives des publications de CNRC:
https://nrc-publications.canada.ca/eng/view/object/?id=1659c46a-6164-413b-8a98-510610447c11 https://publications-cnrc.canada.ca/fra/voir/objet/?id=1659c46a-6164-413b-8a98-510610447c11Ser
I 'PH1 1 N21a I Ino.
1.5751
c . 2B r n
I*
National Research Council Canada Conseil national de recherches CanadaCOMPARISON OF SNOW PRESSURE MEASUREMENTS
AND THEORETICAL PREDICTIONS
by D. M. McClung, J. 0. Larsen, and S. B. Hansen
ANALYZED
Reprinted from
Canadian Geotechnical Journal Vol. 21, No. 2, May 1984 p. 250-258 BLDG.
RES.
L I B R A R Y
DBR Paper No. 1 175 Division ofig
Research'3
Price $1.00 OTTAWA NRCC 231 154 6 / a ~ 6 7
250
Comparison of snow pressure measurements and theoretical predictions
DAVID M. MCCLUNG
National Research Council Canada, 3904 West 4th Avenue, Vancouver, B . C . , Canada V6R lP5
AND
JAN OTTO LARSEN AND SVEIN BORG HANSEN
Norges Geotekniske Insritutt, Postboks 40 Taasen, Oslo 8 , Norway
Received August 15, 1983 Accepted December 22, 1983
Measurements of snow creep pressures from the centre section of a 3.4 m high and 15 m long avalanche-defence supporting structure located on a mountain in western Norway are presented. The site has a deep snow cover and an average slope angle of 25". The measurement configuration corresponds to plane-strain conditions and the data, along with measured snowpack parameters, allow comparison with simple theoretical predictions. The analysis shows that the average pressure on the structure I
may be calculated fairly accurately using linear, viscous modelling for the snow deformation. The maximum pressures proved to be higher than that provided by a linear model and this is considered characteristic of nonlinear material. The implications of these results for estimates of design loads are discussed.
Keywords: snow pressure, creep, measurements, viscous, plane-strain, finite element. 9
L'article prksente des mesures de pression de fluage de la neige sur la section centrale d'une structure de protection contre les avalanches de 3,4 m de haut et 15 m de long, situCe sur une montagne dans l'ouest de la Norvkge. Le site prksente un couvert de neige Cpais et une pente moyenne de 25". La configuration de l'installation de mesure correspond i des conditions de dCformation plane et les d o n d e s , assocites aux paramttres mesures du couvert de neige, permettent une comparaison avec des prkdictions thCoriques simples. L'analyse montre que la pression moyenne sur la structure peut &tre calculCe avec une prkcision acceptable au moyen d'un modtle visqueux linCaire des dCformations de la neige. Les pressions maximum se sont avtrCes plus fortes que celles dCduites d'un modkle linkaire, ce qui est considCrC typique d'un matCriau non-1inCaire. Les implications de ces rksultats sur I'Cvaluation des charges de calcul sont discutCes.
Mots-clPs: pression de neige, fluage, mesure, viscositC, dCformation plane, ClCments finis.
[Traduit par la revue]
Can. Geotech. 1. 21, 250-258 (1984)
Introduction compare the field measurements with these models. This
An important engineering problem concerning the comparison has two important motivating aspects: (1) design of structures on mountains with deep snow cover by comparing actual measurements with a linear, viscous is the calculation of expected pressures due to intemp- deformation model, those features of the problem that tion of snow creep (internal deformation) by the structure. deserve attention for future, more realistic constitutive The simplest problem in relation to snow creep equations can be pinpointed; and (2) it would be very pressures is prediction of pressures at the centre of a long convenient for applications if a linear deformation avalanche-defence supporting structure. This problem is model should prove useable for estimating the expected
I I of long-standing interest in snow mechanics; it was pressures, because of the simplicity of the solutions.
originally posed in the doctoral thesis of R. Haefeli In the present paper field data are compared with the (Bader et al. 1939). It is also the only creep pressure con- existing models of Haefeli (1948) and McClung (1982, I figuration for which serious analytic solutions have been 1984), and rigorous two-dimensional finite element
.
proposed to date. These solutions are used extensively to calculations of the linear problem are provided as aaid in design considerations for structures. check. The analysis indicates features of the linear
!
In this study, creep pressures measured on the centre problem worth retaining in a predictive scheme and illu- section of an avalanche-defence supporting structure are minates some features of the data that disagree with the presented. The measurement site is in western Norway linear deformation model.(altitude 1170 m) on a mountain with a deep snow cover
on a nearly constant incline (average angle 25"). This Experimental methods
configuration eliminates edge effects near the lateral since the experimental for obtaining the ends he structure, where fully three-dimensional pressures are discussed in detail in another paper,' only modelling may be required, and it produces plane-strain a short summary of the procedures is included here. Two measurement conditions.
The analytic models to date assume that snow behaves IJ. 0 . Larsen, M. D. McClung, and S . B . Hansen. The
as a linear, Newtonian viscous fluid This is obviously temporal and spatial variation of snow pressure on structures:
McCLUNG ET AL.
( A V E R A G E
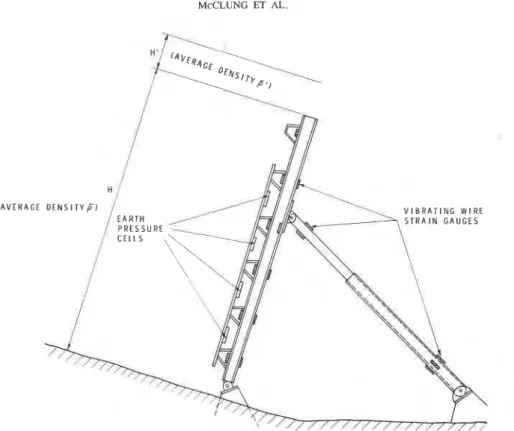
FIG. 1. Measurement site and location of strain gauges on structure. Primed variables denote quantities above the structure (0' , H'); unprimed variables refer to quantities below the top of the structure (P, H).
methods were employed: (1) direct measurement using laboratory-calibrated earth pressure cells mounted on the central portion of the structure; and (2) measurement of strains in the steel beams of the structure using vibrating wire strain gauges. These strains are subsequently used to deduce moment, shear, and pressure diagrams that describe the pressure dependence with depth on the structure.
Results have consistently shown that the earth pres- sure cell measurements are in fairly good agreement with the estimates derived from the strain-gauge data,
provided the snowpack is dry. However, the earth
pressure cell data are highly unreliable when the snowpack is wet. Thus, the pressure cell data are regarded as a check on the second measurement method when the snowpack is dry.
The second measurement method is used for the analysis in the present paper, since the results appear to be consistently reliable. Figure 1 is a schematic of the experimental setup, showing the location of the strain gauges on the structure. Because the structure is very rigid, the results lose accuracy when the product pgH is much less than 5 kPa ( p is average snowpack density, g acceleration due to gravity, and H snowpack depth perpendicular to the ground surface). For values of pgH at 5 kPa and above, the average pressure can be estimated with less than 10% error; there is definitely more error for estimates of maximum pressure because
the pressure distribution cannot be determined uniquely. The rigidity of the system invalidates most of the early-season data, when the snowpack is shallow. This resulted in the loss of data for three winters when the snow cover was shallow.
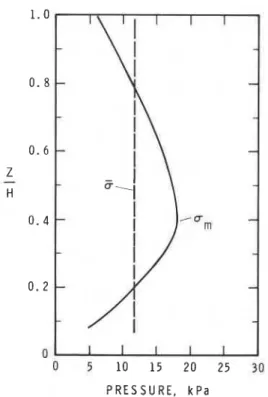
Figure 2 gives an example of the pressure distribution with depth constructed from measured strains in the steel beams of the structure. Ideally, the average of two such diagrams, one from each of the main supports of the structure, should be used. However, because of harsh operating conditions, some gauges do not operate for a portion of the winter so that sufficient data are usually available for only one pressure diagram. The pressure does not go to zero at the top of the structure in Fig. 2 because the snowpack exceeds the structure height. The
maximum pressure, u,, and the average pressure, u ,
are identified in Fig. 2.
To compare the measured pressures with simple theoretical models, the following p~operties of the snowpack were measured: density, temperature, and rarnmsonde hardness profiles, layering, and crystal types. Estimates were made of the free water content through the depth of the snowpack. These observations were made at least monthly, and sometimes more frequently, throughout the measuring period (Dec. -May) for the winters of 1975- 1976,1978-1979,1980-1981, and 1981-1982). Glide shoes were placed on the rock surface uphill from the structure and it was verified that
252 CAN. GEOTECH. J. VOL. 21, 1984
I
0
0 5 10 15 20 25 30 P R E S S U R E , k P a
FIG. 2. Typical pressure distribution (-) on the structure versus relative height (z/H), where z = 0 represents the
snow/ground interface. Constructed from strains measured in the steel beams of the structure for this example from 81-05-1 1.
(a,) maximum pressure; 6 (---) average pressure.
there was essentially no slip of the snow cover over the ground at the site.
Results and theoretical models
The measurements from the four winters are listed in Table 1, where
p
is the average snowpack density and H is the snow depth measured perpendicular to the ground surface (snowpack depth lower than or level with the top of the structure (3.4 m)). For portions of the snowpack higher than the structure, the average density is p' and the height for the snow above the structure is H' (see also Fig. 1). The snow depth values in Table 1 are average values measured upslope from the structure within its zone of influence for creep processes predicted by simple theory (McClung 1982). The densities were taken from snow pits near the site. Analysis of the data from Table 1 in relation to measured values of temperature and hard- ness from the snow profiles is given in Larsen et al.'It is necessary to modify the previously derived snow pressure equations to account for extra body forces when the snowpack depth exceeds the structure height. This may be accomplished by modifying the free surface boundary conditions that are appropriate when the snow depth is precisely equal to or less than the structure height. For the case of free surface boundary conditions
at the top of the snowpack, following McClung (1982, 1984), the average creep pressure on the face of a structure perpendicular to the ground on a slope with average angle $ is given by
where v is the viscous analog of Poisson's ratio for the I i assumed constitutive equation, which is a Newtonian ,
viscous fluid with neglect of the static fluid pressure , term. For [I],
LIH
is given by an empirical equation derived from numerical ca1cuIations (McClung 1984), and it is assumed that there is no glide. The expressionfor L / H is given as
1
When the snowpack exceeds the height of the structure by H' and the average density above the structure is (J' (Fig. I), the free surface boundary conditions may be replaced by imposing initial shear and normal stresses on the surface level with the top of the structure. The new shear and nonnal boundary condi- tion stresses are given by pfgH' sin $ and ptgH' cos $, respectively. By repeating the derivation given by McClung (1982), [ l ] may be modified to give
For a simple comparison with the theory, it is convenient to approximate the expression in brackets in the second term as
so that [3] becomes 5
[41 ( p H
+
p P . H t ) ( g )-
sin+[(')
1 -v(:)I
"'
The advantage of this approximation is that for terrain of constant inclineJI,
the stress ratio is a function of vonly. Calculation with the data from Table 1 shows that the maximum error introduced by use of [4] instead of [3] would be less than 7% in the worst case (76-04-14) with v taken as 0.4, which is considered an upper limit.
254 CAN. GEOTECH. J . VOL. 21. 1984
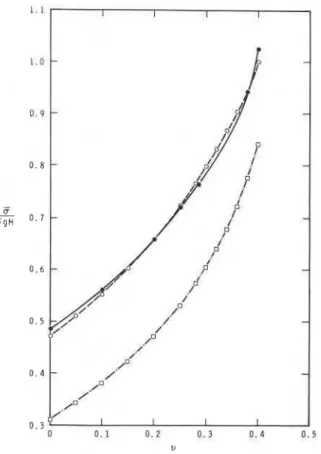
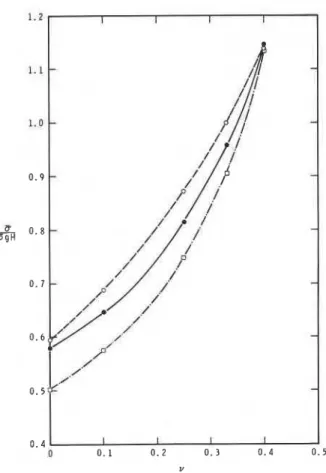
FIG. 3. Stress ratio @ / ( I J g H ) versus v for the range 0 5 v 5
0.4 for $ = 25'. Predictions shown are:
(@-a)
finite element calculations; ( 0 - - - 0 ) one-dimensional model with empirical corrections; ( 0 -.
- 0 ) Haefeli's model.Quervain (1 966) and E. Klausegger (unpublished data), quoted by Salm, indicate values in the range 0.08 5 v 5
0.35 for this same density range. Haefeli (1966) provided creep angles for alpine snowpacks from which v may be extracted. These values are 0.16 5 v I 0.30
for
p
between 350 and 550kg/m3. McClung (1975) provided similar data, which indicate values between 0.23 and 0.38, with an average value near 0.29 for final densities between 500 and 550 kg/m3.Haefeli (1966) and Bader et al. (1951) also gave expressions for v as a function of density based on theoretical arguments and their data. These predictions are0.18 5 v 5 0 . 3 1 and0.13 5 v 5 0 . 2 2 f o r 3 0 0 k g / m 3
5 (5 5 500 kg/m3.
With the above considerations, in order to ensure that
the static fluid pressure term. The finite element calcula- tions assume plane-strain conditions and these results give the 'dynamic' pressure due to interruption of creep deformation by the structure. In addition, a 'static' pressure term must be superimposed to represent the initial stresses in the formulation. This representation is analogous to the second terms on the right sides of [I] and [5] and is defined as
H-2
[71 POW = -
1 - v 6 p cos
IJ
dz'where z is measured perpendicular to the ground starting from z = 0 at the snow/earth interface. For the calculations given in Fig. 3, the maximum difference between the predictions of the model of McClung (1982, 1984) (given by [I] and [2]) and the finite element calculations is 2%. This agreement is fortuitous because deviations up to 6% have been found for other slope angles (McClung 1984).
For the data in Table 1, the stress ratio, u/[(pH
+
pfHf)(g)], has a mean of 0.73 and a standard deviation of 0.10. This implies ij = 0.25 for the mean value for the predictions of the model given by [2] and [4] and it implies ij = 0.36 for Haefeli's model. The stress ratio spans a range of 0.44 5 6/[(pH+
p1H')(g)] 5 0.85,which implies a range of -0.05 5 v r 0.33 for [2] and
[4] and 0.16 5 v 5 0.40 for Haefeli's model. Calcula- tion of the implied value of v for each data point from the measured stress ratio gives i j = 0.25 and a standard deviation of 0.09 for the average value of v implied for [2] and [4]; it also gives ij = 0.36 and a standard deviation of 0.05 for Haefeli's model. If the lowest value of the stress ratio is discarded as a statistical outlier, the implied values of v for the estimated values of the stress ratio are 0.11 5 v 0.33 for [2] and [4],
which is very close to the measured values for field and laboratory experiments in the density range. Figure 4 shows the comparison of measured values of
a
versus (pH+
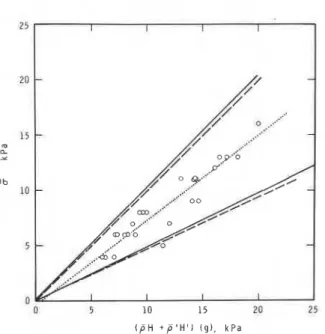
ptHt)(g) and eqs. [2] and [4], finite element calculations, and Haefeli's model.Of further interest with respect to the average pressure estimates are the results of the regression analysis reported by Larsen et al.' A regression analysis of the data in Table 1 showed that
the extreme limits of the data andtheoretical predictions
[g]
a
= 0 . 7 7 ( ~ ~ + P t ~ f ) ( g ) - 0.40wa
are included, the limits are taken as 0 5 v 5 0.4. Figure3 gives a comparison using [I], [2], and [5] for
IJ
= 250. with r;? = 0.89 and the standard deviation of theAlso shown in Fig. 3 are two-dimensional finite element residuals 1.1 kPa. This shows that 6 is linear with (pH
+
predictions. The assumptions for all of these calcula- ptH')(g) to a good approximation, and the small tions are: no slip on the structure, no glide, a free surface intercept gives some added confidence in the data. The at the snow/atmosphere interface and snow deforming regression line is shown in Fig. 4. This analysis should as a linear, Newtonian viscous material with neglect of not be extended beyond the current data set.MCCLUNG ET AL. 255
( p H + p ' H ' l ( g ) , k P a
FIG. 4. Average pressure 6 versus ( p H
+
p 1 H ' ) ( g ) for data from Table 1. ( 0 ) estimates from field measurements; (---)predictions of one-dimensional model with empirical correc- tions; (-) finite element calculations. One-dimensional model and finite element calculations are shown for the limits v = 0.0 and v = 0.4. (.
.
a ) regression line.Data analyzed from similar measurements taken in Switzerland during the winters between 1950 and 1956 are presented in the Appendix. These data were taken on a slope with a near-constant incline of 37" (Salm 1977)
and little or no glide. The Swiss data also indicate that 6
is approximately linear with (pH
+
p'H1)(g) as isshown in the Appendix.
The one-dimensional models cannot be used to predict
the maximum value, a,, of the pressure distribution.
However, it is possible to calculate a, by finite element
methods. Regression analysis of the data from Table 1
shows that a, is given by
, with
2
= 0.92 and the standard deviation of theresiduals 1.4 kPa (Larset et al. I ) . The implication is that
a, is linear with respect to (pH
+
p'H1)(g) to a goodapproximation. From Table 1, the mean value of the stress ratio a,/[(pH
+
p f H ' ) ( g ) ] is 1.13, with a standard deviation of 0.13. Finite element calculationsshow that the ratio increases with v, and has a value of
0.87 for v = 0.25 and 1.13 for v = 0.40. This result
indicates that on the average the ratio exceeds predic-
tions for linear modelling by about 30%, if C = 0.25 is
accepted as the mean value of v from the results of the
average pressure measurements.
Figure 5 depicts the relationship between a, and 6 for
the data as compared with finite element calculations. A
FIG. 5. Values of a, versus 6 from the data and finite element calculations. ( 0 ) measured data points; (-) finite element calculations; (-
.
-) regression line.regression analysis gives the result that
with
2
= 0.93 and the standard deviation of theresiduals 1.4 kPa. Finite element calculations actually
show that the stress ratio a,/6 declines as v increases.
From Table 1, the mean value of u,/u is 1.55, with a
standard deviation of 0.18. For ij = 0.25, which
represents the average implied value of v for the data if a
linear viscous model is chosen, the finite element results
give a value of a,/6 = 1.20. The ratio thus exceeds the
predictions for a linear material by about 30%.
Conclusions and discussion
From snow pressure measurements and analysis, the following conclusions have been reached.
1. The average pressure appears to be adequately explained by calculations assuming linear, viscous modelling. In this regard, the one-dimensional model of McClung (1982, 1984) with empirical corrections pro- vides a formulation that agrees with field measurements as well as with finite element calculations.
2. The implied average value of v is near 0.25 for the
present measurements of 6 when linear modelling is
assumed. This is a reasonable value for alpine snow based upon experimental results in the density range of 300-500 kg/m3.
3. The maximum and the average pressures are linear with respect to (pH
+
p f H ' ) ( g ) ; the maximum pressure increases linearly with average pressure to a good256 CAN. GEOTECH. J. VOL. 21. 1984
ments exceed predictions from linear modelling by about 30%.
4. Data from Switzerland analyzed in the Appendix give an implied average value of v near 0.00, which is lower than measured values from other experiments for this density range. Regression analysis of the data from Switzerland shows that u is approximately linear with (pH
+
p1H')(g), in agreement with the data from the present study.The implications of the results for maximum pressure must be accepted with caution because the accuracy is less than that for estimates of average pressure. If the results are accepted as valid in a qualitative sense, this feature of snow deformation implies nonlinear behaviour. Previous calculations by McClung (1976) showed that nonlinearity assumed by taking the effective shear and bulk viscosity proportional to the bulk stress provided relatively unchanged estimates of average pressure over a linear model, whereas the ratio um/6 increased by about 15% for an example with
+
= 45'. These nonlinear examples were complicated by glide but they seem to indicate qualitative agreement with the effects seen in the present data.It was pointed out previously (McClung 1982) that the linear viscous model may be extended to the simplest viscoplastic model by making v time dependent. It seems clear from Fig. 5 that this would not be sufficient to explain the present data. The finite element calcula- tions in Fig. 5 show that the ratio um/6 would decline as the snow densities and v increase. The data in Fig. 5 seem to imply the opposite.
The most important result of this study with respect to applications is that the average pressure appears to be suitably described by the linear model. Since the one-dimensional model with empirical corrections pro- vides a fairly accurate representation of the linear problem, a simple analytic method is available to predict average pressures. In addition, although the maximum pressure appears to exceed the predictions for a linear material, it may be accounted for in design by the usual engineering safety factors. The regression analysis for the data presented shows (eq. [lo]) that om is about 1; times the average pressure. The standard deviation of the residuals (1.4kPa) used in connection with [9] would allow estimates of a, to any chosen confidence limit for the data presented. Study of more accurate nonlinear viscoplastic models for snow deformation that provide the descriptive features seen in the data may permit prediction of the maximum pressure from a better theoretical framework.
Acknowledgements
We wish to thank K. Kristensen, Norges Geotekniske Institutt (NGI), for his help in collection of the field data. We also wish to thank B. Schieldrop, Industriell
Hydro-og Aerodynamikk, Oslo, and K. Hoeg , NGI, for many useful technical suggestions. Peter Schaerer, National Research Council Canada, read the first draft of this paper and provided many useful suggestions.
This work was partially funded by Norges Vassdrags- og Elektrisitetsvesen, Oslo, and we are grateful for their support.
This paper is a joint contribution from the Division of Building Research, National Research Council Canada and the Norwegian Geotechnical Institute and is published with the approval of the Directors of these institutions.
BADER, H., HAEFELI, R., BUCHER, E., NEHERER, J., ECKEL, O., THAMS, C., and NIGGLI, P. 1939. Der Schnee und seine
-
Metamorphose, Beitrage zur Geologie der Schweiz. Geo- technische Sene, Hydrologie, Lief 3. (German, English trans- lation, U.S. Snow, Ice and Permafrost Research Establish- * ment, Trans. 14, 1954.)BADER, H., HANSEN, B. L., JOSEPH, J. H., and SANDGREN, M. A. 1951. Preliminary investigations of some physical properties of snow. U.S. Snow, Ice and Permafrost Re- search Establishment. Report 7.
DE QUERVAIN, M. R. 1966. Measurements on the pressure at rest in a horizontal snow cover. Union de GCodCsie et GCo- physique Internationale. Association Internationale d'Hydro- logie Scientifique. Commission pour la Neige et la Glace. Division Neige Saisonnikre et Avalanches. Symposium Inter- nationale sur les Aspects Scientifiques des Avalanches de Neige, 5- 10 a d 1965, Davos, Suisse, pp. 154- 159. (Publi- cation No 69 de 1'Association Internationale dlHydrologie Scientifique.)
HAEFELI, R. 1948. Schnee, Lawinen, Firn und Gletscher. I n
Ingenieur-Geologic. 2 Bd. Edited by L. Bendel. Springer- Verlag, Vienna, pp. 663-735.
1966. Considerations sur la pente critique et le coefficient de pression au r e p s de la couverture de neige. Union de GCodCsie et GCophysique Internationale. Association Inter- nationale d'Hydrologie Scientifique. Commission pour la Neige et la Glace. Division Neige Saisonnikre et Ava- lanches. Symposium Internationale sur les Aspects Scienti- fiques des Avalanches de Neige, 5- 10 avril 1965, Davos, ,
Suisse, pp. 141-153. (Publication No 69 de 1'Association Internationale d'Hydrologie Scientifique.)
KUMMERLI, F. 1958. Auswertung der Druckmessungen am Druckapparat Institut (DAI). Interner Bericht des Eidg. 6
Institutes fur Schnee und Lawinenforschung, Nr. 240. MCCLUNG, D. M. 1975. Creep and the snow-earth interface con-
dition in the seasonal alpine snowpack. (Union GCodCsique et GCophysique Internationale. Association Internationale des Sciences Hydrologiques. Commission des Neiges et Glaces.) Symposium. MCcanique de la neige. Actes du colloque de Grindelwald, avril1974, pp. 236-248. (IAHS- AISH Publication No. 114.)
1976. Snowpressure on rigid obstacles. Journal of Glaciology, 17(76), pp. 277-285.
1982. A one-dimensional analytical model for snow creep pressures on rigid structures. Canadian Geotechnical Journal. 19(4), pp. 401-412.
McCLUNG ET AL. 257
equations. Canadian Geotechnical Journal, 21(1), pp. 191-
193.
SALM, B . 1977. Snow forces. Journal of Glaciology, 19(80), pp. 67-100.
Appendix
Data have been obtained from an observation site at the Weissflujoch (altitude 2680 m) in eastern Switzerland. The experiments have been described by Salm (1977) from the original report of Kummerli (1958). The observation site has a configuration similar to that for the data reported from Norway. The slope angle is a nearly constant incline of 37" and measurements showed no glide upslope from the structure. The measurements were taken from the centre section of an avalanche-
.
defence structure, where lateral edge effects would be largely absent. The average snowpack densities ranged from 220 to 520 kg/m3.There are two potentially important differences in the data sets from Switzerland and Norway: (1) snowpack properties and (2) measurement techniques. Without further analysis, it is not possible to quantify the differences.in snowpack structure between these two sites. Salm (1977) and Kummerli (1958) have described how the loads were. calculated from the deformation of springs on each of the horizontal crossbeams. Kummerli
(1958) lists data for the total force on the structure for six
winters of observations. From these resultant forces, the average pressure on the structure has been calculated using [4] and [6]. Figure A1 shows the comparison of the predictions of finite element calculations and [I] and
[5] over the range of interest: 0 5 v 5 0.4 for
+
= 37"analogous to Fig 3. In Fig. A2, the implied values of 6
are plotted versus (pH
+
p1H')(g), similar to the com-parison in Fig. 4 for the Norwegian data. From Fig. A2, nearly half of the data points imply negative values of v.
For the 78 data points in Fig. A2, the average value of
6/[(pH
+
prHr)(g)] is 0.58, with a standard deviation of 0.12. This implies an average value of C = 0.0 for thefinite element calculations, C = -0.02 for [4], and C = 0.10 for Haefeli's model (eq. [6]). Figure A1 shows that
Haefeli's model provides fairly accurate estimates of the linear problem for $ = 37"; this is fortuitous. The data
imply a stress ratio in the range 0.34 5 u/[(pH
+
p1H')(g)] 5 0.86. This yields -0.50 5 v 5 0.26 for theprediction of [4] and -0.38 5 v 5 0.31 for Haefeli's
model.
A regression analysis was performed for the data
depicted in Fig. A2. This analysis gave the relation 6 =
0.69(PH
+
p'Hr)(g) - 1.05 kPa with?
= 0.82 andstandard deviation of the residuals 1.2 kPa. Power law regression gave 6 = 0.36[(pH
+
p ' ~ ' ) ( ~ ) ] ' - ~ ~ with3
= 0.84 and the standard deviation of the residuals
approximately 1.2 kPa.
FIG. A1
.
Stress ratio a / ( p g H ) versus v for the range 0 5 v 50 . 4 for $ = 37". Predictions shown are (0-0) finite element
calculations; (0-0) one-dimensional model with empirical corrections; and ( 0 -
.
- 0 ) Haefeli's model.(pH + p S H ' ) ( g l , k P a
FIG. A2. Average pressure 6 versus (OH
+
p'Hr)(g) for data from Switzerland. (0) measurement points; (-) limits of finite element calculations; and (---) one-dimensional model for v = 0.0 and v = 0.4. These latter two predictions are identical for v = 0.4.258 CAN. GEOTECH. J . VOL. 21, 1984
The following conclusions seem evident from this 2. The regression analysis shows that 6 is approxi-
data analysis. mately linear with ( p H
+
p ' H r ) ( g ) . Although the1. The implied values of v and G are too low when power law regression analysis shows a slightly better fit,
compared with laboratory and field measurements for these results must be accepted with caution because the
the density range in question. The measurements imply actual values of 6 appear to be less than that implied by
average pressures that are less than the value for a linear the linear constitutive equation. viscous material.