HAL Id: halshs-03044843
https://halshs.archives-ouvertes.fr/halshs-03044843
Preprint submitted on 7 Dec 2020
HAL is a multi-disciplinary open access archive for the deposit and dissemination of sci-entific research documents, whether they are pub-lished or not. The documents may come from teaching and research institutions in France or abroad, or from public or private research centers.
L’archive ouverte pluridisciplinaire HAL, est destinée au dépôt et à la diffusion de documents scientifiques de niveau recherche, publiés ou non, émanant des établissements d’enseignement et de recherche français ou étrangers, des laboratoires publics ou privés.
Celestial enlightenment: eclipses, curiosity and economic
development among pre-modern ethnic groups
Anastasia Litina, Èric Roca Fernández
To cite this version:
Anastasia Litina, Èric Roca Fernández. Celestial enlightenment: eclipses, curiosity and economic development among pre-modern ethnic groups. 2020. �halshs-03044843�
Working Papers / Documents de travail
WP 2020 - Nr 40
Celestial enlightenment: eclipses, curiosity and economic
development among pre-modern ethnic groups
Anastasia Litina
Eric Roca Fernandez
Celestial
enlightenment: eclipses, curiosity and economic
development
among pre-modern ethnic groups
∗Anastasia Litina1 and `Eric Roca Fern´andez2 1University of Macedonia
2Aix-Marseille Univ., CNRS, AMSE, Marseille, France
December 1, 2020
Abstract
This paper revisits the role of human capital for economic growth among pre-modern ethnic groups. We hypothesise that exposure to rare natural events drives curiosity and prompts thinking in an attempt to comprehend and explain the phenomenon, thus raising human capital and, ultimately, pre-modern growth. We focus on solar eclipses as one particular trigger of curiosity and empirically establish a robust relationship between their number and several proxies for economic prosperity: social complexity, technological level and population density. Variation in solar eclipse exposure is exogenous as their local incidence is randomly and sparsely distributed all over the globe. Additionally, eclipses’ non-destructive character makes them outperform other uncanny natural events, such as volcano eruptions or earthquakes, which have direct negative economic effects.
We also offer evidence compatible with the human capital increase we postulate, finding a more intricate thinking process in ethnic groups more exposed to solar eclipses. In particular, we study the development of written language, the playing of strategy games and the accuracy of the folkloric reasoning for eclipses.
Keywords: eclipses, human capital, development, curiosity. JEL Codes: N10, N30, E02, O10, O50, Z10.
∗
This paper was previously circulated under the title “The Terror of History: Solar Eclipses and the Origins of Critial Thinking and Complexity”. The authors want to express their gratitude to Felipe Valencia Caicedo, James Fenske, Per Fredriksson, Gunes Gokmen, Satyendra Gupta, Sara Lazzaroni, Jordan Loper, Naci Mocan, Ola Olsson and Gerhard Thowes for their useful comments and suggestions. Also, this paper has benefited from the interactions with during the ASREC 2019 European meeting, the VfS 2020 Annual Conference and the 2020 meeting of the Danish Society for Economic and Social History. This work was supported by the French National Research Agency Grant ANR-17-EURE-0020.
1
Introduction
Curiosity is a natural precursor of human capital insofar as questions precede answers. Yet the literature on human capital formation has paid scant attention to this predecessor, and little is known about its implications for economic growth. Natural phenomena are an obvious candidate for studying the arousal of curiosity and its bearing on development through human capital: humans have always sought to comprehend the world around them, prompting deeper and more intricate thinking. Hence, as people become more exposed to strange events and ponder their causes, they gain a comparative advantage in thinking, which eventually translates into superiority in human capital. Most major natural shocks, however, entail mass destruction. Hence, events such as earthquakes or volcanic eruptions couple the intellectual challenge with an economic cost, implying opposite effects on human capital and growth. A notable exception is solar eclipses: harmless events that rank amongst the most impressive celestial phenomena, sparking people’s curiosity to understand why day turns into night.1 In this paper, we argue that eclipse frequency is related to increased levels of economic development among pre-modern ethnic groups. We maintain that human capital levels increase with eclipse exposure as people attempt to explain these phenomena, which in turn has positive consequences for development outcomes.
We validate our conjecture using several indicators of economic prosperity available in Murdock’s Ethnographic Atlas (1967) and in the Standard Cross-Cultural Sample which we combine with eclipse data derived from Espenak and Meeus (2006) and Jubier (2019). In particular, for each ethnic group listed in the Atlas, we count the number of total solar eclipses visible from within its traditional homeland boundaries. Such eclipses occur when the Sun, the Moon and the Earth perfectly align on the ecliptic. On Earth, day turns into night as it enters the Moon’s shadow. The darkening, however, is very local: a strip less than 160 km wide that affects vast swaths of the Earth in a west-east motion. At the ethnic homeland level, the average time between two eclipses is around 65 years while the average number of eclipses is approximately 70 over a period of 3500 years.2 Eclipses’ non-destructive nature distinguishes them from other natural events, such as earthquakes, floods or eruptions, and allows us to isolate the role of human capital on economic growth: after an eclipse, all that remains is a feeling of
1
Murray (2014, p. 240) 2
On average, there is one total solar eclipse approximately every 18–20 months somewhere on Earth. In a given location, total solar eclipses are separated, on average, by four centuries.
restlessness. In contrast, harmful events can divert attention and resources to more imperative reconstruction efforts and destroy human capital, delaying growth.
Based on Diamond’s (2017) idea of social complexity increasing with development, we show that ethnicities more exposed to solar eclipses display a more sophisticated organisation. Moreover, the effect of eclipses extends to other measures of economic development: society’s technological level and population density. A series of robustness tests considering additional social and geo-climatic characteristics confirm the previous association. Lastly, we show that introducing alternative potential drivers of curiosity does not affect our results.3
Lastly, we present compelling evidence tackling the mechanism we propose. In light of the beneficial effects of curiosity on human capital we postulate, we analyse the effect of eclipses on two indirect measures of human capital: the development of a written language and the playing of strategy games. Furthermore, if our conjecture is correct, we shall expect a better understanding of eclipses among the groups that experienced more. Following the novel approach by Michalopoulos and Xue (2019), we assess this possibility by studying the folkloric explanation ascribed to eclipses.4 We show that, as the number of eclipses increases, the likelihood that
tales explaining them include the Sun the Moon raises. This is to the detriment of more naive explanations depicting eclipses as acts of animals or gods.
Our paper is similar in spirit to Severgnini and Boerner’s (2019) and Boerner et al.’s (2019) idea that solar eclipses induce curiosity. However, the authors leverage eclipses as an instrument to study the adoption of mechanical clocks in mediaeval Europe, a time when the exact mechanism underlying them was well understood, and clocks provided a more precise tool to time their occurrence. On the contrary, we are interested in relating the frequency of unknown, intellectually challenging phenomena (as eclipses were during the early stages of development) to economic prosperity through increases in human capital as people devote mental resources to their understanding. With this study, we contribute to the research on the long-run determinants of growth, in particular, on the role of human capital. The empirical literature on the topic coincides in its importance. However, the bulk of the analyses refer to the industrial and post-industrial periods —Galor and Moav (2006), Barro (2001) and Hanushek and Woessmann
3In particular, we focus on earthquakes, volcanic eruptions, lunar eclipses and partial eclipses. However, a rich literature indicates that they have major effects on society. For instance, Bentzen (2019) provides evidence indicating that earthquakes promote religiosity while Belloc et al. (2016) associate them to a slower democratisation process.
4
Michalopoulos and Xue (2019) show that modes of living of pre-modern people shaped the motifs that appear in their tales and mythology, with profound implications for growth, development and culture.
(2012)—, with only a few notable exceptions tracing the relationship back to the enlightenment period and before: Squicciarini and Voigtl¨ander (2015) show that knowledge elite concentration raised productivity, Mokyr (2018) argues that intellectual competition facilitated the industrial revolution in Europe and Chen et al. (2020) discuss how the Chinese civil servant examination system locally promoted human capital accumulation. This contrasts with the wealth of evidence documenting alternative deep-rooted factors for development, notably agriculture, geography and climate (Ashraf and Galor (2011), Ashraf and Galor (2013), Alsan (2015), Cervellati et al. (2019) and Dalgaard et al. (2015)).5 Our paper bridges the gap in the previous literature, connecting human capital and economic growth in the very long run. In doing so, it also relates to the research documenting factors that promote human capital accumulation, especially in pre-modern times. There is ample evidence for religion (Becker and Woessmann (2009), Valencia Caicedo (2018), Waldinger (2017)), the early introduction of the printing press (Baten and van Zanden (2008)) or institutional factors (Galor et al. (2009), Bobonis and Morrow (2014)). However, our paper focuses on a crucial prior stage: cognisance and human capital shaped early in history.
This paper is also related to the literature that analyses the effects of natural events on social organisation. Cavallo et al. (2013) show that natural disasters promote political revolutions, thereby affecting growth. Belloc et al. (2016) and Bentzen (2019) focus on earthquakes, finding a slowdown in the transition from autocracy to self-governance in mediaeval Italy and an increase in religiosity, respectively. By analysing the effects of solar eclipses, which are harmless phenomena, we depart from this literature. The distinction is important as we are interested in human curiosity: destructive events may divert thinkers’ interest away from explaining the phenomena towards more urgent reconstruction and kill them. Similarly, physical capital losses retard economic growth, eroding the need for more complex social organisations.
The remainder of the paper is as follows: Section 2 discusses the mechanism we postulate. Section 3 presents the data and empirical strategy. The benchmark results are reported in Section 4, including a series of robustness tests in Section 5. We explore the empirical validity of our mechanism in Section 6. Lastly, Section 7 concludes.
5
Furthermore, cultural traits important for growth —time preference, individualism, cooperation and cultural transmission— are ultimately shaped by these same factors: Galor and ¨Ozak (2016), Vollrath (2011), Litina (2016) and Giuliano and Nunn (2017).
2
Solar Eclipses, Curiosity and Human Capital
During a solar eclipse, the Moon blocks sunlight, shadowing parts of the Earth. Additionally, the temperature drops —up to 10 degrees— and wind slows down and changes direction.6 With sunlight being essential for life, the disappearance of the Sun from the sky was a dreadful event that shocked pre-modern societies.7 However, it also prompted thinking: Iwaniszewski (2014, p. 288) argues that humans always tried to unravel the mysteries of the sky and Barale (2014, p. 1763-1766) indicates that eclipses were a cause of curiosity (and fear), together with many other rare atmospheric phenomena. Indeed, although eclipse forecasting is an elusive task —especially for solar eclipses—, several people achieved surprising success, attesting their intellectual effort to comprehend them.8
Attempts to rationalise inexplicable natural phenomena by pre-modern societies gave origin to evolving explanations that eventually fossilised as folklore and mythology.9 The original beliefs mutated when old explanations became unsatisfactory, and Ludwin et al. (2007) describes this process as “early attempts at scientific explanation” that require intellectual effort. The scope for re-examining and improving an explanation increases as its triggering event recurs, fueled by the “human nature [that] demands an explanation for events”. This was the case in Japan, where a yin-yang-based theory for the origin of earthquakes superseded an older one that relied on gods, as the latter was deemed “an unsophisticated theory” (Ludwin et al. (2007)).
Indigenous endeavours to elucidate the causes of solar eclipses have similarly entered folklore. As earthquake “knowledge” advanced in Japan, so did the understanding of solar eclipses. These reflect varying levels of comprehension, probably revealing a deeper reflection on its causes.10 The simplest explanation attributes the disappearance of the Sun to animals or gods: they either eat it or steal it. The Cherokee and Vietnamese believed that a giant frog ate the Sun,
6
Gray and Harrison (2012) and Eugster et al. (2017).
7All sorts of nefarious consequences occurred during a solar eclipse: poisonous midsts descended onto Earth, a belief shared by German and Eskimo tribes; mediaeval French maintained that evil spirits roamed freely during the darkening of the Sun; and Hindu people followed protective rituals, see Littmann et al. (1999, p. 44–45).
8
Some of them are summarised in Littmann et al. (1999, Ch. 4). Recorded eclipses also reflect interest in the phenomena, with Chinese recordkeeping stretching as far as 2043BCE, see Pankenier (2014, p. 2044, 2073–2074) and Kelley and Milone (2011, p. 118). Other people also kept records: the Zapotec (Justeson (2014, p. 765)) and Swedes (Ruggles (2014, p. 357)).
9For instance, self-ignited, ever-burning natural gas emissions that naturally occur in Yanarta¸s (Turkey) entered the oral tradition as the remains of the Chimera’s flaming tongue (Piccardi and Masse (2007, p. vii)). In that sense, oral traditions contain the corpus of knowledge and “condensate and present information in a format that could be remembered and retold for generations” (Ludwin et al. (2007)). Several examples show folklore’s longevity: the Klamath and the Gunditjmar mythology have kept records of volcanic eruptions that occurred 7700 and 37000 years ago (Matchan et al. (2020)).
10
Hayden and Villeneuve (2011) argue that rival factions’ competition over the precise date of the winter solstice advanced astronomical monitoring and knowledge of the skies.
a celestial dragon does so in China. Mythical dogs steal the Sun in Korea and, according to the Pomo in California, an angry bear is responsible. Other ethnic groups cleverly introduced the Moon, which reveals more careful observations on their part: for the Batammaliba, the Sun and the Moon clash and the only way to stop them from fighting is to halt all conflict on Earth. The Din´e, the Wirangu and the Warlpiri explained that during an eclipse, the Sun and Moon are mating. Lastly, according to Littmann et al. (1999, p. 43), Armenian and Hindu myths maintain that dark bodies orbiting the Sun occasionally block the view of the Sun or the Moon, causing a corresponding eclipse. This is a fairly precise theory involving the actual mechanics of a solar eclipse: a celestial body casting its shadow on the Earth.
In line with Smith (1822, p. 21), we argue that, among pre-industrial ethnic groups, solar eclipses presented an intellectual challenge worth pondering upon. Additionally, the increasing levels of curiosity facilitated by more frequent eclipses “renders them [people] [...] more desirous to know [...]”. Thus, cognitive development should correlate with frequency since “[w]onder [...] is the first principle which prompts mankind to the study [...]” (Smith (1822, p. 22)). For example, Dvorak (2017) proposes that a series of five solar eclipses in only twelve years prompted the Maya to begin recording them. Similarly, Liller (2000, p. 112) documents that the Rapanui started carving the Moai statues shortly after a series of five solar eclipses in ten years, followed by a sixth one and the passage of a comet sixty-five years later. Mokyr (2004, p. 15-16) discusses that knowledge arises from curiosity: “an essential human trait without which no historical theory of useful knowledge makes sense”. Further, curiosity has moved the frontier of “propositional knowledge” (p. 287).
Besides a direct boost to human capital, indirect avenues may exist as well. Simple attempts at eclipse prediction require keeping a tally of, at least, 177–178 lunar months —see Dvorak (2017, Ch. 2), for instance. As such, a greater command of basic mathematics is required, and the development of written language can facilitate the task even more by allowing accurate recordkeeping. Moreover, a more careful sky observation may uncover additional regularities, useful to accurately establish the seasons or devise a calendar. Also, crafting precision instruments to track celestial bodies may present positive externalities through increased dexterity. Lastly, eclipses as well as other major events served as mnemonics of the local history and social rules. This was the case among some Plains tribes (Chamberlain (2000, p. 288) and McKnight (2005, p. XXII)).
Other natural phenomena share important similarities with eclipses. For instance, earth-quakes, volcanic eruptions and tsunamis imply sudden changes in the surrounding landscape. In this sense, they equally qualify as triggers of curiosity and could contribute to human capital formation. However, most of these events are catastrophic and destructive, devastate commu-nities and alter access to natural resources. Less severe cases may involve mass relocation of people to new lands. These economic setbacks delay growth. Alternative celestial events, such as supernovae and the passage of comets, present other drawbacks, too. First, their rather low frequency complicates group recalling. As mentioned earlier, human capital development implies the revision of older theories, and events separated by several centuries make this more difficult.11 Lastly, from a practical perspective, these events are visible throughout the Earth and therefore equally affect all ethnic groups.
3
Data and Empirical Strategy
3.1 Data
This paper advances the hypothesis that more frequent exposure to total solar eclipses is related to higher economic development. We further propose one possible mechanism: human capital accumulation as ethnic groups make intellectual efforts to comprehend the phenomenon.12 We rely on Murdock (1967) and Murdock and White’s (1969) Ethnographic Atlas to obtain variables reflecting these outcomes. The Atlas contains a set of pre-modern societies when surveyed. These societies are, by construction, sparsely distributed across space, which reduces spatial correlation concerns. For these social groups, most of them not having mastered astronomy, solar eclipses would still represent a meaningful event worth explaining. Following Diamond (2017), we propose several standard variables that capture economic advancement. However, proxies for human capital or, similarly, complex thinking, are scarce. Nonetheless, we suggest that codifying a language in a written form and the playing of strategy games are related to human capital. Similar to Michalopoulos and Xue (2019), we use folklore data to study the explanations people ascribed to solar eclipses, which reflects their comprehension of the phenomenon and
11
For comparison, the average time between total solar eclipses at the ethnic group level is 65 years.
12We remark, though, that we are interested in the intellectual effort these events represent while remaining agnostic regarding whether a conceived explanation is correct. In this sense, we see these events as forcing individuals to think about the unknown. Hence, even if the final explanation is clearly incorrect as of today standards —or even in comparison to similarly advanced societies— its ideation should increase cognitive skills.
human capital.13 Data on total solar eclipses come from Espenak and Meeus (2006) and includes information about all total solar eclipses that occurred between the years 2000BCE and 2000CE. In what follows, we describe our main variables of interest.
Economic development. According to Diamond (2017), societal complexity is a prominent feature of developed ethnic groups. Moreover, starting from Murdock and Provost (1973), anthropologists have systematically argued that these proxies of social organization indicate cultural complexity. The Ethnographic Atlas provides three variables directly related to ethnic groups’ social organisation. The first variable conveys information about the levels of hierarchy that exist beyond the local community. Five levels are possible, and more hierarchical societies score higher in this indicator. The second variable measures political integration. In this case, the indicator presents six differentiated categories: absence of local integration, autonomous local communities, peace groups transcending local communities, minimal states, little states and states. Lastly, we focus on class stratification among freemen within ethnic groups. There may be no distinction among freemen, or alternatively, individuals may belong to social classes determined by wealth, elite status, dual classifications or more complex systems.
We augment the set of outcomes using the Standard Cross-Cultural Sample, which provides more ethnic information for a selected group of ethnicities. Among the variables presented, we further proxy economic development by focusing on technological achievement and population density. We follow the technological advancement index of Eff and Maiti (2013) for the societies in the SCCS.14 Lastly, population density follows Pryor (1985): less than one person per square mile, between one and five, five and 25, 25 and 100, 100 and 500 or more than 500 people per square mile.
Human capital. The Ethnographic Atlas does not record any variable directly related to human capital. However, it is possible to find proxy indicators that reflect deeper and more intricate reasoning. First, we focus on the existence of a written language. In its original form, writing progression indicates whether a group has no writing, uses mnemonic devices, has nonwritten records, has mastered writing but has no records or, finally, has a true writing system with records. We transform this scale into a binary variable stating whether writing is present –last two categories– or not.
13We use the same source for folkloric data as Michalopoulos and Xue (2019), retrieved from Nikolaev et al. (2015).
14
The gist of this classification is that it considers that some tasks are predecessors of others, thus tasks that have more predecessors represent a more technologically advanced activity.
Our second proxy variable informs us about the types of games played in the society. These can be physical games, chance games, strategy games or a combination of the previous. We transform this variable into a dummy indicator stating whether an ethnic group plays strategy games or not. Strategic behaviour is indicative of advanced cognitive skills —Zern (1979) and Spitz (1978)— and societies that rely on strategic thinking develop such games to teach the next generations how to operationalise it.
Lastly, we use data on folklore from Berezkin in a way akin to Michalopoulos and Xue (2019). We focus on how solar eclipses enter into oral tradition. In particular, we are interested in discerning whether the Moon and Sun play a role in explaining solar eclipses. In that sense, as described before, some ethnic groups attribute eclipses to demons and animals eating or scaring the Sun. We expect more complex explanations involving the Moon to ensue from greater exposition to eclipses.
Solar Eclipses. To capture the long-lasting impact of solar eclipses, we construct a novel dataset of their incidence at the ethnic-group level, bringing together a wide range of historical, ethnic and GIS data sources. Among the different types of eclipses, we focus on total and annular eclipses. In these two sorts, the Moon completely obscures the Sun, effectively turning day into night. The most comprehensive dataset about solar eclipses is Espenak and Meeus (2006), which compiles all the relevant information for all solar eclipses occurring between 2000BCE and 3000CE. Based on this data, Jubier (2019) computes “paths of totality” for each eclipse: all positions on Earth from which a total solar eclipse is visible. In fact, total solar eclipses are visible only within a relatively narrow area, typically not wider than 160 km.15
Our main independent variable is the number of total solar eclipses visible from within each ethnic homeland. We construct it by intersecting eclipse paths with ethnic homeland boundaries from Fenske (2014). We restrict the data to eclipses that took place between the years 2000BCE and 1500CE. Figure 1 presents several paths of totality16 and exemplifies the construction of our independent variable.
We argue that solar eclipses present several advantages compared to other natural phenomena. First, their occurrence is rare. Individuals can become accustomed to more common events, for instance, lightning. We thus believe that solar eclipses are more likely to have a long-lasting impact. Second, unlike earthquakes and volcanic eruptions, solar eclipses do not destroy physical
15
This area appears naturally as the shadow the Moon casts transverses the Earth due to the movement of both bodies.
16
or human capital. Capital destruction would directly affect complex thinking and societies beyond the cognitive channel we postulate. Lastly, solar eclipses are well distributed across the Earth and the effects can be perceived by a large collectivity.
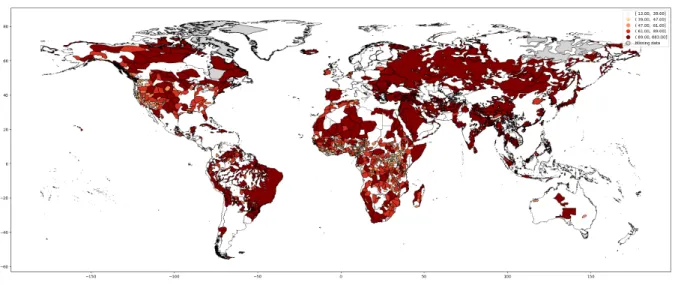
Table 15 in the Appendix indicates the average number of eclipses that have ever been visible in a homeland, which is around 70, while Figure 2 depicts the number of solar eclipses at the ethnic level. This number is large because we use the number of eclipses visible over the course of 3500 years. By doing so, we capture the actual frequency of eclipses better than if we used narrower time frames more prone to idiosyncratic variation.17
Other Controls. The Ethnographic Atlas provides several control variables at the ethnic-group level. Our benchmark specification includes agricultural intensity. We augment it by accounting for habitat characteristics.
Furthermore, we rely on GIS solutions to compute additional variables related to economic development. First, we introduce a series of standard climatic and geographic controls: average temperature and precipitation, climate typology, absolute latitude and a south dummy.18 Following Nunn and Puga (2012), we include controls for terrain ruggedness and elevation.
We also introduce the distance to the coast and distance to the rivers because early civilizations and early state formation took place near waterways as Mann (2012) indicates. Additionally, exposure to foreign ideas is higher near major communication hubs: ports in pre-modern times. Similarly, we follow Ashraf and Galor (2013) and we control for the terrestrial distance to Addis Ababa to capture the effect of genetic diversity. We further include measures for malaria prevalence and potential caloric yield. The mortality burden posed by malaria can negatively affect the adoption of new technologies —as malaria prevalence can induce inbreeding and high mortality rates can deter technological progress through a shortened life expectancy. According to Galor and ¨Ozak (2016) and Diamond (2017), higher potential caloric yield can both directly and indirectly —through preferences— foster economic development.
In the robustness and discussion Sections, we further augment the analysis with an additional set of geographical controls including the area of each ethnic homeland (larger areas are exposed to more eclipses), dependency on different modes of production and ecological diversity. Further, we also show that our results are robust to other dreadful events: volcano eruptions and earthquakes. Moreover, neither lunar eclipses nor cloud coverage affects our results.
17
Our results, though, are robust to the introduction of alternative, shorter time frames of 500 years from different epochs.
18
Figure 1: Paths of totality.
(a) Global coverage. (b) Eclipses at the ethnic homeland level.
Notes: Figure 1a represents several paths of totality for selected total solar eclipses. Each path of totality covers a narrow area no wider than 160 km that stretches in the east-west direction. Figure 1b displays several ethnic homelands together with some selected paths of totality. Our main variable, the number of total solar eclipses visible from within an ethnic homeland, is obtained by counting the number of paths of totality that intersect a given ethnic homeland.
Table 15 in the Appendix reports the summary statistics for all our dependent and explanatory variables as well as for the ethnic and geographical controls. The data are all reported at the level of our unit of analysis: the ethnic group.
3.2 Empirical Strategy
Using the aforementioned data we estimate the following equation:
Ci= α0+ α1Ei+ α2Ii+ α3Gi+ α4D + εi
where Ci denotes each of the six measures of economic development. Ei measures the
number of eclipses an ethnic homeland has been exposed to. Ii and Gi are vectors of ethnic and
geographical controls, respectively. Di denotes continent fixed effects capturing unobservables
across continents in which ethnic groups are located, and εi is an ethnicity-specific error term.
We cluster standard errors at the regional level.
All our dependent variables, except for writing and technology levels, are ordered. Therefore, most regressions follow an ordered logit model and, for these variables, we use OLS. Our results report the obtained coefficients as well as the marginal effects.
Figure 2: Distribution of total solar eclipses at the ethnic homeland level.
Notes: This Figure represents the number of total solar eclipses that occurred between the years 2000BCE and 2000CE that were visible from within ethnic homeland boundaries.
4
Empirical Findings
This section reports the results of our benchmark analysis, relating the prevalence of total solar eclipses to economic development. We relegate the discussion of human capital as a possible mechanism to Section 6. First, we present the results from the Ethnographic Atlas and, later, we focus on the SCCS.
Ethnographic Atlas Outcomes. Table 1 explores the relationship between a higher exposition to total solar eclipses and economic development, when, following Diamond (2017), we proxy the latter by social complexity. Columns (1)–(3) focus on Jurisdictional Hierarchy. Column (1) reports the coefficient when we control only for continental fixed effects. Column (2) augments the analysis with all the relevant geographical controls while column (3) enriches it with the addition of the ethnic-group controls. In a similar fashion, Columns (3)– (6) and (7)– (9) report the results for Political Integration and for Class Stratification, correspondingly.
As Columns (1), (4) and (7) establish, there exists a positive and significant relationship between a higher incidence of total solar eclipses and economic development. Furthermore, adding additional controls for geographical and ethnic-group characteristics renders the results slightly stronger without affecting the significance.19 In all cases, our findings are qualitatively
19
In the rest of the paper, we will always refer to the specifications employed in Columns (3), (6) and (9) as the benchmark specification. This specification has the full set of basic controls that, on the one hand, captures a wide range of confounding factors and, on the other hand, maximizes the number of observations. Later, the benchmark specification is the starting point when conducting our robustness checks and when testing competing theories and other potential confounding factors.
T able 1: Be n chmark results: EA — Solar eclipses and economic d e v elopmen t. Jurisdictional Hierarc h y P olitical In tegration Class Stratification (1) (2) (3) (4) (5) (6) (7) (8) (9) T otal n um b er of eclipses 0 .014 ∗∗∗ 0 .015 ∗∗∗ 0 .008 ∗∗∗ 0 .011 ∗∗∗ 0 .012 ∗∗∗ 0 .011 ∗∗ 0 .008 ∗∗∗ 0 .013 ∗∗∗ 0 .008 ∗∗∗ (0 .003) (0 .003) (0 .002) (0 .003) (0 .004) (0 .004) (0 .003) (0 .003) (0 .003) Fixed effects Y es Y es Y e s Y es Y es Y es Y es Y es Y es Geograph y No Y es Y es No Y es Y es No Y es Y es Ethnic No No Y es No No Y es No No Y es Pseudo-R 2 0 .138 0 .212 0 .262 0 .073 0 .180 0 .259 0 .075 0 .144 0 .179 Observ ations 1111 911 911 307 255 255 1067 825 825 Notes: This T ab le presen ts the results of ordered logit regressions relating the impact of eclipses on the measures of so cietal complexit y , as a pro xy for economic dev elopm en t, at the ethnic -group lev el. Columns (1)–(3) rep ort the findings for the Jurisdictional Hier ar chy v ariable. Columns (3)–(6) and (7)–(9) rep ort the results for Politic al Inte gr ation and for Class Str atific ation , resp ectiv ely . Con tinen t fixed effects: indicators for Asia, Europ e, Africa, North America, South America and Oceania.Geographic con trols: a v erage temp erature and precipitation, distance to the coast, to the closest riv er and terrestrial distance to Addis Ababa, terrain ruggedness, elev ation, malaria prev alence, soil p ote n tial caloric yield, absolute latitude, south indicator and ma jor habitat typ e indicator.Ethnic con trols: ma jor crop typ e indicator.Robust standard errors in pare n theses clustered at the regional lev el. ∗p < 0 .1, ∗∗ p < 0 .05, ∗∗∗ p < 0 .01.
significant at the one per cent level and quantitatively similar and stable across specifications even after the introduction of the full set of controls. In particular, as Table 2 reveals, increasing the average number of total solar eclipses per century by one raises the probability of reaching the top echelons of each of the outcomes by 0.6, 3.3 and 1.8 percentage points, respectively.20 The average number of solar eclipses per century is about 1.73, with a standard deviation of 1.36.21 In that sense, the marginal effects we discussed above correspond to a relatively mild rise in the number of eclipses. However, the effects are sizable. We measure a 0.6 percentage points increase in the probability of reaching the highest level of jurisdictional hierarchy when only 2.31% of the groups in the sample are located in that echelon. Comparatively, the relative increase in the probability of having a full-fledged state raises by 3.3%, with 13.73% of the ethnic groups in that category. Lastly, the likelihood of having a complex class stratification is 2.2 percentage points larger, compared to 7.76% of the groups in that level of class stratification.
Table 2: Marginal effects: EA — Economic development.
Jurisdictional Hierarchy Political Integration Class Stratification
No levels −0.046∗∗∗ Absent −0.019∗∗ Absent −0.057∗∗∗
(0.013) (0.009) (0.019)
1 level 0.004∗∗ Local com. −0.038∗∗ Wealth 0.005∗∗
(0.002) (0.015) (0.003)
2 levels 0.020∗∗∗ Peace groups −0.001 Elite 0.003∗∗
(0.006) (0.001) (0.001)
3 levels 0.016∗∗∗ Min. states 0.008 Dual 0.031∗∗∗
(0.004) (0.006) (0.011)
4 levels 0.006∗∗∗ Little states 0.016∗∗ Complex 0.018∗∗∗
(0.002) (0.007) (0.006)
States 0.033∗∗
(0.014)
Notes: This table presents the marginal effects of the results reported in Table 1 for the three measures of social complexity. The full set of controls is considered in the analysis. Robust standard errors in parentheses clustered at the regional level.∗p < 0.1,∗∗p < 0.05,∗∗∗p < 0.01.
SCCS Outcomes. In order to further validate the previous findings, we now turn to a richer sub-sample: the Standard Cross-Cultural Sample. It covers about 186 ethnic groups but offers a wider range of variables. Among these, we select three that convey a clear sense of
20
The average number of eclipses per century equals the total number of eclipses divided by 40.
21The sample changes between specifications. The average value and the standard deviation of the number of eclipses per century are 1.75 and 1.44 when the outcome is Jurisdictional Hierarchy; 2 and 1.40 for Political Integration; and 1.77 and 1.48 for Class Stratification. We have previously reported the overall average and standard deviation.
Table 3: Benchmark results: SCCS — Solar eclipses and economic development.
Technological Level Population Density
(1) (2) (3) (4) (5) (6)
Total number of eclipses
0.003∗ 0.004∗∗∗ 0.004∗∗ 0.002 0.004 0.016∗∗∗
(0.002) (0.001) (0.002) (0.002) (0.003) (0.006)
Fixed effects Yes Yes Yes Yes Yes Yes
Geography No Yes Yes No Yes Yes
Ethnic No No Yes No No Yes
Pseudo-R2 0.345 0.577 0.706 0.090 0.276 0.454
Observations 129 108 108 166 139 139
Notes: This Table presents the results of regressions relating the impact of eclipses on the measures of economic development, at the ethnic-group level. Columns (1)–(3) report the findings for the Technological Level variable and follow an OLS regression. Columns (3)–(6) report the results for Population Density using ordered logit regressions. Continent fixed effects: indicators for Asia, Europe, Africa, North America, South America and Oceania.Geographic controls: average temperature and precipitation, distance to the coast, to the closest river and terrestrial distance to Addis Ababa, terrain ruggedness, elevation, malaria prevalence, soil potential caloric yield, absolute latitude, south indicator and major habitat type indicator.Ethnic controls: major crop type indicator.Robust standard errors in parentheses clustered at the regional level.∗p < 0.1, ∗∗p < 0.05, ∗∗∗
p < 0.01.
economic development: the technological level reached by each group, and population density.22 Regressions related to technological level follow OLS, while we use ordered logit regressions when the outcome variable is population density.
We report the results for the SCCS on Table 3. Columns (1)–(3) focus on the Technological Level and, in the remaining, the outcome variable is Population Density. As in Table 1, we first control only using fixed effects, which we then augment incorporating geographical variables and finally ethnic-group characteristics.
The results under these alternative specifications also indicate a positive and significant relationship between solar eclipse intensity and economic development that is consistent with the previous set of outcomes. In that sense, we have multiple pieces of evidence suggesting that ethnic groups located in places that experience more solar eclipses are more developed. We postpone for the moment the discussion of the mechanism we propose, namely, that these societies are more challenged by unexplained phenomena which prompts them to think more, thereby raising their human capital levels. Because most of the outcomes are obtained under ordered logit regressions, the magnitude of the effects is better interpreted in marginal terms, as displayed in Table 4. In this case, the average number of eclipses per century is about 2.18 and
22
The technological level is not directly present in the SCCS database but Eff and Maiti (2013) provide values for this sample.
the standard deviation is about 2.10, slightly larger than when using the EA sample.23 Table 4 reports the marginal effect of a one-unit change in the incidence of eclipses, this is, of one additional eclipse per century, for each of the outcomes. In that sense, we measure an increase in the technological level of 0.175 units, out of a mean of 9.45. The effect is even larger for population density: an additional eclipse per century increases the likelihood of being in the densest category by 1.4 percentage points, while only 3.6% of the ethnic groups in the sample are in this echelon.
Overall, our analysis indicates a systematic effect of the incidence of eclipses on economic development. The magnitude of our results is not trivial, especially taking into account that we consider eclipses over such a long period. In the following section, we test the robustness of our benchmark findings to a series of alternative assumptions and additional controls.
Table 4: Marginal effects: SCCS — Economic development.
Technological Level Population Density
0.175∗∗ Less than 1 / sq. mile −0.040∗∗∗
(0.070) (0.014) 1-5 / sq. mile −0.008 (0.006) 5-25 / sq. mile −0.005 (0.005) 25-100 / sq. mile 0.016∗∗∗ (0.004) 100-500 /sq. mile 0.024∗∗ (0.011) 500 or more / sq. mile 0.014∗∗∗ (0.005)
Notes: This table presents the marginal effects of the results reported in Table 3 for the three measures of economic development. The full set of controls is considered in the analysis. Robust standard errors in parentheses clustered at the regional level.∗p < 0.1,∗∗p < 0.05,∗∗∗p < 0.01.
5
Robustness
Validity of the eclipse measure. Our measure of eclipses, and in particular the choice of the time period, is quite broad to capture the average incidence of solar eclipses. Yet, for consistency, we explore alternative, shorter time horizons to dispel concerns regarding our
23
The corresponding average and standard deviation for the regressions employing Technological Level and Population Density as outcomes are 2.02 and 2.25; and 2.32 and 2.34, respectively.
baseline timing. Figure 3 report the results for all six measures of economic development when using alternative periods to compute the total number of eclipses. These measures consider the following periods: 2000BCE-1500BCE, 1500BCE-1000BCE, 1000BCE-500BCE, 500BCE-0CE, 0CE-500CE, 500CE-1000CE and 1000CE-1500CE.24
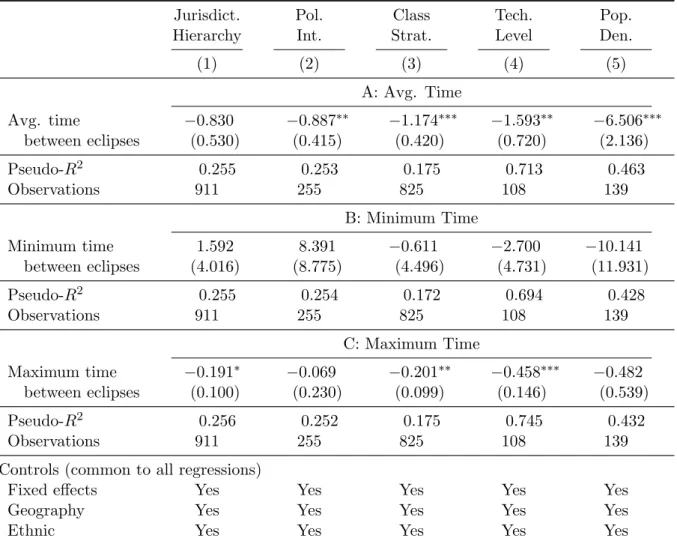
Alternative eclipse measures. While we argue that an eclipse is an impressive event which may have a long-lasting impact on people, we highlight that an additional feature of eclipses that reinforces their impact is their rather low frequency. Table 5 incorporates three different measures of frequency: the average time between two consecutive eclipses in Panel (A), the minimum time between consecutive eclipses in Panel (B) and the maximum time between consecutive eclipses in Panel (C). The results of this exercise are in line with our hypothesis, this is, more frequent eclipses are associated with higher development, except for the minimum time between consecutive eclipses.25 However, we believe the total number of eclipses to be a more straightforward and easy to interpret measure, hence our preference for it. At any rate, however, the total number of eclipses already embodies a frequency component: the average time between eclipses.26 At any rate, though, all measures are highly correlated.
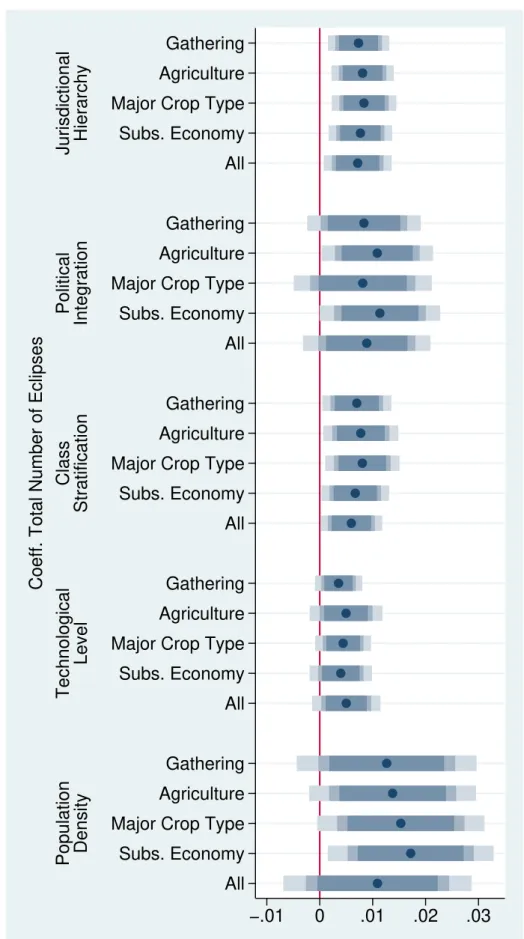
Additional ethnic controls. Our benchmark analysis controls for a wide range of ethnic and geographical controls as well as various fixed effects. To further mitigate concerns about possible omitted variables, Figure 4 augments the benchmark analysis with a series of additional ethnic-group controls.27
In general, the inclusion of additional controls, either one by one or all together, does not change the main result, namely, that an increase in the number of total solar eclipses positively affects economic development, with the exception of population density measures. In that sense, the previous results are not caused by omitted variables related to production modes.
Other rare events. Next, we investigate to what extent other rare events may have influenced our outcomes of interest. After all, our hypothesis hinges on the fact that such episodes trigger curiosity, positively contributing to human capital formation. We know with certainty that several other types of rare events occurred over the course of thousands of years
24
Table 16 in the Appendix presents the regression results.
25This lack of results is hardly surprising, though: decreasing the minimum does not produce much additional surprise since its average value is two years between consecutive eclipses.
26The average time between eclipses equals 3500 divided by the number of eclipses. Note, though, that the alternative measures we propose are more finely grained: they consider the time between consecutive eclipses. Dvorak (2017) and Liller (2000, p. 112) implicitly suggest the number of eclipses in short succession as an alternative metric.
27
Table 17 in the Appendix documents the results of the corresponding regressions, displaying the coefficient of each additional variable.
Figure 3: Robustness: Alternative time frames. Jurisdictional Hierarchy Political Integration Class Stratification Technological Level Population Density 2000BC−1500BC 1500BC−1000BC 1000BC−500BC 500BC−0 0−500 500−1000 1000−1500 2000BC−1500BC 1500BC−1000BC 1000BC−500BC 500BC−0 0−500 500−1000 1000−1500 2000BC−1500BC 1500BC−1000BC 1000BC−500BC 500BC−0 0−500 500−1000 1000−1500 2000BC−1500BC 1500BC−1000BC 1000BC−500BC 500BC−0 0−500 500−1000 1000−1500 2000BC−1500BC 1500BC−1000BC 1000BC−500BC 500BC−0 0−500 500−1000 1000−1500 −.1 0 .1 .2 .3
Table 5: Robustness: Alternative measures of eclipse incidence. Jurisdict. Hierarchy Pol. Int. Class Strat. Tech. Level Pop. Den. (1) (2) (3) (4) (5) A: Avg. Time Avg. time between eclipses −0.830 −0.887∗∗ −1.174∗∗∗ −1.593∗∗ −6.506∗∗∗ (0.530) (0.415) (0.420) (0.720) (2.136) Pseudo-R2 0.255 0.253 0.175 0.713 0.463 Observations 911 255 825 108 139 B: Minimum Time Minimum time between eclipses 1.592 8.391 −0.611 −2.700 −10.141 (4.016) (8.775) (4.496) (4.731) (11.931) Pseudo-R2 0.255 0.254 0.172 0.694 0.428 Observations 911 255 825 108 139 C: Maximum Time Maximum time between eclipses −0.191∗ −0.069 −0.201∗∗ −0.458∗∗∗ −0.482 (0.100) (0.230) (0.099) (0.146) (0.539) Pseudo-R2 0.256 0.252 0.175 0.745 0.432 Observations 911 255 825 108 139
Controls (common to all regressions)
Fixed effects Yes Yes Yes Yes Yes
Geography Yes Yes Yes Yes Yes
Ethnic Yes Yes Yes Yes Yes
Notes: This table reports the results of regressions including alternative measures of eclipse frequency as an independent variable. Panel (A) includes in the analysis the average time between consecutive eclipses, Panel (B) the minimum time and Panel (C) the maximum time between two consecutive eclipses. Dependent variables measured in centuries. The full set of controls is considered in the robustness analysis. Continent fixed effects: indicators for Asia, Europe, Africa, North America, South America and Oceania.Geographic controls: average temperature and precipitation, distance to the coast, to the closest river and terrestrial distance to Addis Ababa, terrain ruggedness, elevation, malaria prevalence, soil potential caloric yield, absolute latitude, south indicator and major habitat type indicator.Ethnic controls: major crop type indicator.Robust standard errors in parentheses clustered at the regional level.∗p < 0.1,∗∗p < 0.05,∗∗∗p < 0.01.
Figure 4: Robustness: Additional ethnic controls.
Coeff. Total Number of Eclipses
Jurisdictional Hierarchy Political Integration Class Stratification Technological Level Population Density Gathering Agriculture Major Crop Type Subs. Economy All Gathering Agriculture Major Crop Type Subs. Economy All Gathering Agriculture Major Crop Type Subs. Economy All Gathering Agriculture Major Crop Type Subs. Economy All Gathering Agriculture Major Crop Type Subs. Economy All
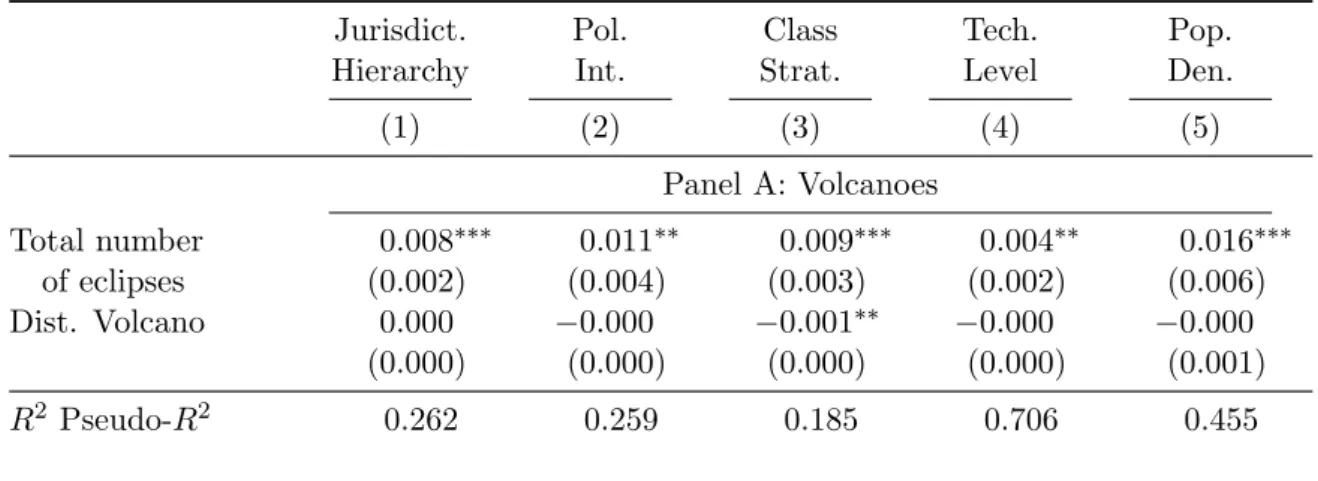
and may as well have instilled fear or may have been catastrophic. When describing solar eclipses in Section 2, we listed several characteristics that make them unique: their rare occurrence, their non-destructive nature and the partial visibility. While all the above characteristics make eclipses a significant factor, we test additional events. In Table 6 we include three other types of rare events: volcanoes —proxied by the distance to the closest one— in Panel (A), distance to tectonic faults in Panel (B) and the incidence of lunar eclipses in Panel (C).
In all three cases, we find no significant effect of any of these events on our outcomes. The non-significance of lunar eclipses was expected. After all, lunar eclipses are less impressive as they are not accompanied by major changes in luminosity, temperature or animal behaviour. Moreover, they happen at nighttime and can go unnoticed by people, and are visible on a whole hemisphere at once, making them more frequent and less impressive. Distance to volcanoes and tectonic faults proxies the likelihood of observing volcanic eruptions and earthquakes —both catastrophic and destructive events that nonetheless can raise awareness about the unknown. Although eruptions and earthquakes, especially the largest of them, have vanished whole civilizations from Earth, ethnic groups far enough could have perceived them, contributing towards their levels of complexity of that society.28 Additionally, EA outcomes using social complexity as a proxy for economic development remain positive and highly significant. However, the proxies derived from the Standard Cross-Cultural Sample become less significant once we control for lunar eclipses in the last Panel.29
Table 6: Discussion: Other rare events. Jurisdict. Hierarchy Pol. Int. Class Strat. Tech. Level Pop. Den. (1) (2) (3) (4) (5) Panel A: Volcanoes Total number of eclipses 0.008∗∗∗ 0.011∗∗ 0.009∗∗∗ 0.004∗∗ 0.016∗∗∗ (0.002) (0.004) (0.003) (0.002) (0.006) Dist. Volcano 0.000 −0.000 −0.001∗∗ −0.000 −0.000 (0.000) (0.000) (0.000) (0.000) (0.001) R2 Pseudo-R2 0.262 0.259 0.185 0.706 0.455 28
Volcanic eruptions have entered the local mythology. For instance, the Klamath in America associated the volcanic eruption of Mount Mazama with godly affairs: Mount Mazama last erupted about 7700 years ago. According to Matchan et al. (2020), Australian Gunditjmara people kept a similar oral myth for even longer. Chester and Duncan (2007, p. 206) provides more examples.
29
The lack of significance is likely caused by the high correlation displayed between solar and lunar eclipses in the Standard Cross-Cultural Sample: 0.93. This value is much lower when working with outcomes from the Ethnographic Atlas, reaching only 0.62.
Observations 911 255 825 108 139 Panel B: Tectonic Faults
Total number of eclipses
0.008∗∗∗ 0.011∗∗ 0.009∗∗∗ 0.004∗∗ 0.016∗∗∗
(0.002) (0.004) (0.003) (0.002) (0.006)
Dist. Tec. Fault −0.000 −0.000 −0.000 0.000 −0.001
(0.000) (0.000) (0.000) (0.000) (0.001)
R2 Pseudo-R2 0.262 0.260 0.181 0.708 0.460
Observations 911 255 825 108 139
Panel C: Lunar Eclipses Total number of eclipses 0.007∗∗ 0.009 0.007∗∗ 0.007 0.017∗ (0.003) (0.006) (0.004) (0.006) (0.010) Total number of lunar eclipses 0.001 0.002 0.001 −0.002 −0.001 (0.001) (0.003) (0.001) (0.005) (0.008) R2 Pseudo-R2 0.262 0.259 0.179 0.706 0.454 Observations 911 255 825 108 139
Controls (common to all regressions)
Fixed effects Yes Yes Yes Yes Yes
Geography Yes Yes Yes Yes Yes
Ethnic Yes Yes Yes Yes Yes
Notes: This table analyses the effects of three other types of rare events: volcanic eruptions, proxied by distance to volcanoes, in Panel (A), distance to tectonic faults in Panel (B) and the incidence of lunar eclipses Panel (C). The full set of controls is considered in the analysis. Continent fixed effects: indicators for Asia, Europe, Africa, North America, South America and Oceania.Geographic controls: average temperature and precipitation, distance to the coast, to the closest river and terrestrial distance to Addis Ababa, terrain ruggedness, elevation, malaria prevalence, soil potential caloric yield, absolute latitude, south indicator and major habitat type indicator.Ethnic controls: major crop type indicator.Robust standard errors in parentheses clustered at the regional level.∗p < 0.1,∗∗p < 0.05,∗∗∗p < 0.01.
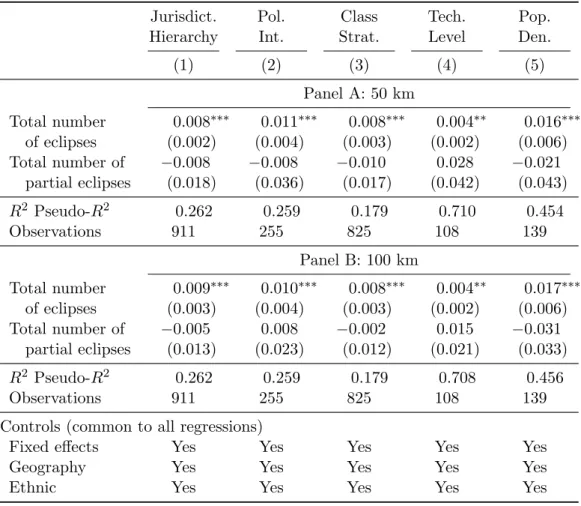
Lastly, we also test to what extent partial eclipses may have had a similar impact. Partial solar eclipses are visible in a much wider area than their total counterparts. However, the obscuration decreases rapidly as one moves farther away from the path of totality and, according to (Hughes, 2000), 90% of the Sun must be shadowed to perceive the implied decrease in luminosity. Therefore, we construct buffers of 50 and 100 km around each path of totality to account for the area likely to be in the penumbra of the eclipse, this is, to experience a partial eclipse. Table 7 incorporates the number of total and partial eclipses as regressors. Panel A presents the results for the 50 km buffer and Panel B extends it to 100 km. Mostly, only total eclipses predict economic development while partial eclipses do not seem to be important. Partial eclipses do not appear to be significant predictors of economic prosperity, even when considering a 100 km extension around total solar eclipses. In that sense, it is likely that the much-decreased obscuration associated with them explains our results, this is, at those distances, the drop in luminosity can be small and thus go unnoticed.
Table 7: Discussion: Partial eclipses. Jurisdict. Hierarchy Pol. Int. Class Strat. Tech. Level Pop. Den. (1) (2) (3) (4) (5) Panel A: 50 km Total number of eclipses 0.008∗∗∗ 0.011∗∗∗ 0.008∗∗∗ 0.004∗∗ 0.016∗∗∗ (0.002) (0.004) (0.003) (0.002) (0.006) Total number of partial eclipses −0.008 −0.008 −0.010 0.028 −0.021 (0.018) (0.036) (0.017) (0.042) (0.043) R2 Pseudo-R2 0.262 0.259 0.179 0.710 0.454 Observations 911 255 825 108 139 Panel B: 100 km Total number of eclipses 0.009∗∗∗ 0.010∗∗∗ 0.008∗∗∗ 0.004∗∗ 0.017∗∗∗ (0.003) (0.004) (0.003) (0.002) (0.006) Total number of partial eclipses −0.005 0.008 −0.002 0.015 −0.031 (0.013) (0.023) (0.012) (0.021) (0.033) R2 Pseudo-R2 0.262 0.259 0.179 0.708 0.456 Observations 911 255 825 108 139
Controls (common to all regressions)
Fixed effects Yes Yes Yes Yes Yes
Geography Yes Yes Yes Yes Yes
Ethnic Yes Yes Yes Yes Yes
Notes: This table incorporates partial solar eclipses as an additional regressor alongside the number of total solar eclipses. Partial eclipses computed at 50 and 100 km buffers in Panels A, and B, respectively. The full set of controls is considered in the analysis. Continent fixed effects: indicators for Asia, Europe, Africa, North America, South America and Oceania.Geographic controls: average temperature and precipitation, distance to the coast, to the closest river and terrestrial distance to Addis Ababa, terrain ruggedness, elevation, malaria prevalence, soil potential caloric yield, absolute latitude, south indicator and major habitat type indicator.Ethnic controls: major crop type indicator.Robust standard errors in parentheses clustered at the regional level.∗p < 0.1,∗∗p < 0.05,∗∗∗p < 0.01.
Spatial correlation. The number of total solar eclipses may be spatially correlated across ethnic groups, affecting the statistical significance of our results. In fact, the path of totality spans several thousand kilometres in an east-west direction, thus simultaneously affecting multiple ethnic groups located closeby. A first line of argument against this concern is related to the very construction of the data. Murdock’s efforts to collect data in the Ethnographic Atlas were made with the intention of mitigating correlation across groups over space and time.30
We further try to empirically address this concern by conducting some additional tests in Table 8.31 First, Panel (A) incorporates the number of eclipses visible from the closest neighbour’s homeland as an additional regressor. This variable allows us to control for potential communication between groups, especially about eclipses, which would otherwise appear as noise. Panel (B) uses an alternative level to cluster the results: ecoregions. Besides being more precise, ethnic groups within the same ecoregion face similar difficulties from the habitat, for instance, in terms of food availability, soil characteristics or building materials. Lastly, Panel (C) exploits the fact that ethnic groups whose languages are siblings or closely related tend to display similar characteristics arising from a common, shared history. In that sense, we introduce language fixed effects as an additional control and cluster the standard errors at that same level. In general, these more demanding specifications do not challenge our previous association between eclipses and economic development.
A final concern is related to mass migrations of ethnic groups, particularly, the Bantu expansion that occurred between 1000BCE and 1CE.32 It consisted of a series of sequential migrations, from western Africa to the east and south. In Table 9 we first exclude, in Panel (A), west, central, east and southern African regions from the regression. Panel (B) further expands the exclusion to the whole African continent. In general, the results are similar to those we obtained before.
Location accuracy and visibility. Two final concerns we address are related to the accuracy of the location of the eclipses as this would affect their visibility of eclipses from a particular location, as well as their visibility due to climatic conditions.
30In the literature, the possible correlation between cultures is known as Galton’s problem. When collecting his data, Murdock sampled cultures as independently as possible to mitigate this concern (see e.g.Mace et al. (1994)). 31The obvious choice would be to compute Conley’s standard errors. However, these are not available for ordered logit regressions.
32According to Giuliano and Nunn (2017), the Bantu expansion is the only migration that could have affected ethnic homeland boundaries. Therefore, we consider that all populations have been stable throughout time, except for the Bantu. Furthermore, our population predates the era of mass migration, hence there is no need to use a population matrix to reconstruct the original ethnic composition of any ethnic group.
Table 8: Robustness: Spatial correlation. Jurisdict. Hierarchy Pol. Int. Class Strat. Tech. Level Pop. Den. (1) (2) (3) (4) (5) A: Nearest Neighbour Total number of eclipses 0.009∗∗∗ 0.010∗ 0.010∗∗∗ 0.006∗∗ 0.015∗∗ (0.002) (0.006) (0.004) (0.002) (0.006) Eclipses neighbour −0.002 0.001 −0.004 −0.011 0.003 (0.002) (0.003) (0.003) (0.006) (0.004) Pseudo-R2 0.259 0.258 0.179 0.730 0.463 Observations 892 246 807 103 134 B: Clustering at ecoregions Total number of eclipses 0.008∗∗∗ 0.011∗∗∗ 0.008∗∗∗ 0.004∗∗ 0.016∗∗∗ (0.002) (0.004) (0.003) (0.002) (0.006) Pseudo-R2 0.262 0.259 0.179 0.706 0.454 Observations 911 255 825 108 139
C: Language Fixed Effects Total number
of eclipses
0.021∗∗∗ 0.006∗∗∗ 0.016 −0.037
(0.007) (0.002) (0.027) (0.023)
Language FE Yes Yes Yes Yes
R2 Pseudo-R2 0.381 0.235 0.926 0.718
Observations 255 825 108 139
Controls (common to all regressions)
Fixed effects Yes Yes Yes Yes
Geography Yes Yes Yes Yes
Ethnic Yes Yes Yes Yes
Notes: This table reports the results when we attempt to mitigate concerns about spatial correlation. Panel (A) controls for total eclipses visible in neighbouring ethnic homelands. Panel (B) clusters the standard errors at the ecoregion level. Panel (C) enriches the benchmark analysis with a set of language family fixed effects and clusters the standard errors at that same level. The full set of controls is considered in the robustness analysis. Continent fixed effects: indicators for Asia, Europe, Africa, North America, South America and Oceania.Geographic controls: average temperature and precipitation, distance to the coast, to the closest river and terrestrial distance to Addis Ababa, terrain ruggedness, elevation, malaria prevalence, soil potential caloric yield, absolute latitude, south indicator and major habitat type indicator.Ethnic controls: major crop type indicator.Robust standard errors in parentheses clustered at the regional level.∗p < 0.1, ∗∗p < 0.05, ∗∗∗
Table 9: Robustness: Bantu expansion. Jurisdict. Hierarchy Pol. Int. Class Strat. Tech. Level Pop. Den. (1) (2) (3) (4) (5)
Panel A: Excluding Bantu Areas Total number of eclipses 0.007∗∗∗ 0.018∗∗∗ 0.010∗∗ 0.003∗ 0.025∗∗∗ (0.002) (0.005) (0.004) (0.002) (0.008) R2 Pseudo-R2 0.363 0.351 0.261 0.743 0.529 Observations 530 191 507 91 110
Panel B: Excluding Africa Total number of eclipses 0.006∗∗ 0.018∗∗∗ 0.011∗∗∗ 0.003∗ 0.027∗∗∗ (0.003) (0.005) (0.004) (0.002) (0.009) R2 Pseudo-R2 0.373 0.351 0.290 0.705 0.557 Observations 477 180 463 88 104
Controls (common to all regressions)
Fixed effects Yes Yes Yes Yes Yes
Geography Yes Yes Yes Yes Yes
Ethnic Yes Yes Yes Yes Yes
Notes: This table reports the results when we attempt to mitigate concerns about mass migrations, in particular, the Bantu expansion. Panel (A) excludes the regions transversed by the Bantu: west, central, east and southern Africa. Panel (B) excludes the entire African continent. The full set of controls is considered in the robustness analysis. Continent fixed effects: indicators for Asia, Europe, Africa, North America, South America and Oceania.Geographic controls: average temperature and precipitation, distance to the coast, to the closest river and terrestrial distance to Addis Ababa, terrain ruggedness, elevation, malaria prevalence, soil potential caloric yield, absolute latitude, south indicator and major habitat type indicator.Ethnic controls: major crop type indicator.Robust standard errors in parentheses clustered at the regional level.∗p < 0.1, ∗∗
First, our results may suffer from low accuracy regarding either homeland boundaries or eclipse paths. Although in general ethnic homeland boundaries are accepted as precise enough, this could nonetheless be an issue. Regarding eclipse paths, the exact local visibility hinges upon having precise estimates of the Earth’s tidal frictions. Hence, the first eclipses in the series may be slightly mislocated. We address this double concern by shifting ethnic homelands three degrees northwards —alternative directions and amounts are equally valid. This effectively represents different ethnic boundaries and paths of totality. Panel (A) of Table 10 presents the results when we compute the total number of eclipses visible from the displaced ethnic homelands. The results remain qualitatively and quantitatively the same.
Second, we also address concerns regarding diminished visibility due to cloud coverage. In this case, we introduce average cloud coverage as an additional regressor. Although this variable is contemporaneous, we believe that global cloud patterns have not changed much over the course of centuries as these mostly result from winds and mountain ranges. Hence, even though cloud visibility is affected by micro-climatic conditions, the mean value should be roughly constant over time. The results of this second exercise, displayed in Panel (B) of Table 10, are also similar to the benchmark results. In fact, even if cloudy, during a total solar eclipse obscuration is above 90%, so the darkening of the sky would still be perceived.
Homeland area. The use of ethnic homelands as a basis to compute the number of total solar eclipses implies a mechanical relationship between each homeland’s area and the latter. After all, we count all eclipses visible from anywhere within ethnic homeland boundaries, and a larger area implies that more eclipses are visible.33 Since controlling a larger area may require more sophisticated forms of social organisation, Table 11 proposes several tests to mitigate this concern, although all regressions flexibly control for the area by introducing decile dummies. Panel (A) introduces ethnic homelands’ area (in square-km) as control, replacing the area dummy indicators.34
Panels (B) and (C) propose an alternative method to disentangle the aforementioned mechanical relationship. First, we compute the number of eclipses within a fixed area for each ethnic group: 50 and 100 km radius around homeland centres. Second, we multiply it by
33Using the entire ethnic homeland as a basis has the advantage of encompassing information exchange between group members. This is, ethnic groups dispersed over large territories can communicate and exchange information on eclipses only seen by a fraction of the group.
34
More developed ethnic groups may have expanded, occupying the territory and displacing previous settlers. In that sense, area would be an outcome of total solar eclipses, and hence it should not be a control. For this reason, the area is not part of the main set of independent variables.
Table 10: Robustness: Location accuracy and visibility. Jurisdict. Hierarchy Pol. Int. Class Strat. Tech. Level Pop. Den. (1) (2) (3) (4) (5)
A: Displaced Ethnic Homelands Total number of eclipses 0.009∗∗∗ 0.011∗∗ 0.008∗∗∗ 0.005∗∗ 0.016∗∗∗ (0.002) (0.005) (0.003) (0.002) (0.006) Pseudo-R2 0.262 0.259 0.178 0.707 0.454 Observations 911 255 825 108 139 B: Cloud Coverage Total number of eclipses 0.008∗∗∗ 0.011∗∗ 0.008∗∗∗ 0.004∗∗ 0.016∗∗∗ (0.002) (0.004) (0.003) (0.002) (0.006) Cloud coverage 0.000∗ 0.000 0.000∗ 0.000 0.000 (0.000) (0.000) (0.000) (0.000) (0.000) R2 Pseudo-R2 0.263 0.259 0.180 0.707 0.454 Observations 911 255 825 108 139
Controls (common to all regressions)
Fixed effects Yes Yes Yes Yes Yes
Geography Yes Yes Yes Yes Yes
Ethnic Yes Yes Yes Yes Yes
Notes: This table reports the results when we attempt to mitigate concerns about location accuracy and visibility In Panel (A) we create a new measure of eclipses by displacing ethnic homelands 3 degrees northwards and replicate the benchmark regression. In Panel (B) we account for actual eclipse visibility that might be affected by clouds. We control for the average level of cloud coverage over the year. The full set of controls is considered in the robustness analysis. Continent fixed effects: indicators for Asia, Europe, Africa, North America, South America and Oceania.Geographic controls: average temperature and precipitation, distance to the coast, to the closest river and terrestrial distance to Addis Ababa, terrain ruggedness, elevation, malaria prevalence, soil potential caloric yield, absolute latitude, south indicator and major habitat type indicator.Ethnic controls: major crop type indicator.Robust standard errors in parentheses clustered at the regional level.∗p < 0.1, ∗∗
the actual area of each group. In doing so, our measure effectively proxies the expected number of eclipses within the homeland region, assuming that eclipses are homogeneously distributed. In other terms, we are purposely leaving aside idiosyncratic changes in the number of eclipses brought about by ethnic homelands’ shape. Lastly, we regress our indicators of economic prosperity against both the expected number of eclipses and its actual counterpart.
Table 11: Discussion: Area. Jurisdict. Hierarchy Pol. Int. Class Strat. Tech. Level Pop. Den. (1) (2) (3) (4) (5) Panel A: Area Total number of eclipses 0.007∗∗ 0.005 0.007∗∗∗ 0.005 0.016∗∗ (0.003) (0.004) (0.002) (0.004) (0.008) Area 0.000 0.000∗∗∗ 0.000 −0.000 −0.000 (0.000) (0.000) (0.000) (0.000) (0.000) R2 Pseudo-R2 0.257 0.257 0.176 0.694 0.419 Observations 943 269 856 113 145
Panel B: Expected eclipses, 50 km radius Total number of eclipses 0.007∗∗∗ 0.006 0.007∗∗∗ 0.005 0.016∗∗ (0.003) (0.004) (0.003) (0.004) (0.007) Expected eclipses 50 km radius area 0.001 0.005∗∗ 0.000 −0.000 −0.000 (0.001) (0.002) (0.001) (0.001) (0.001) R2 Pseudo-R2 0.257 0.256 0.176 0.694 0.419 Observations 943 269 856 113 145
Panel C: Expected eclipses, 100 km radius Total number of eclipses 0.007∗∗∗ 0.005 0.007∗∗∗ 0.005 0.016∗∗ (0.003) (0.004) (0.003) (0.004) (0.007) Expected eclipses 100 km radius area 0.001 0.004∗∗∗ 0.000 −0.000 −0.000 (0.001) (0.001) (0.001) (0.001) (0.001) R2 Pseudo-R2 0.257 0.257 0.176 0.694 0.419 Observations 943 269 856 113 145
Controls (common to all regressions)
Fixed effects Yes Yes Yes Yes Yes
Geography Yes Yes Yes Yes Yes
Ethnic Yes Yes Yes Yes Yes
Notes: In this table we further address the fact that bigger homelands experience more eclipses. To mitigate this concern we directly control for the area in Panel (A). Panels (B) and (C) introduce the expected number of eclipses as additional regressors. The full set of controls is considered in the analysis, except for Panel (A) which does not include area decile dummies. Continent fixed effects: indicators for Asia, Europe, Africa, North America, South America and Oceania.Geographic controls: average temperature and precipitation, distance to the coast, to the closest river and terrestrial distance to Addis Ababa, terrain ruggedness, elevation, malaria prevalence, soil potential caloric yield, absolute latitude, south indicator and major habitat type indicator.Ethnic controls: major crop type indicator.Robust standard errors in parentheses clustered at the regional level.∗p < 0.1,∗∗p < 0.05,∗∗∗p < 0.01.
Overall, these strategies do not modify our previous conclusions. The results for economic development remain positive and highly significant throughout all the specifications. Additionally, as Panels (B) and (C) reveal, economic prosperity is not influenced by the expected number of eclipses, casting doubt on the premise that homeland areas drive the results. The lack of results for partial eclipses in Table 7 also point it that same direction. In fact, larger homelands experience more eclipses of both sorts. However, only total solar eclipses bear predictive power.
Other driving forces: scalar stress and ecological diversity. The literature on the formation of more complex societies, especially the empirical one, is not very extensive. A first hypothesis brought up is that of scalar stress (Johnson (1982)): societal stress that is reinforced by a growing population. The need to mitigate the concern associated with an enlarging population has led societies to more complex structures, which we may confound with economic advancement. Panel (A) of Table 12 controls for population density. Unfortunately, this variable is only available in the Standard Cross-Cultural Sample, hence the number of observations decreases. Our results remain intact. In particular, population density does directly affect any of the social complexity measures, nor technological development or writing.35 Remarkably,
though, the upper echelons of population density are related to social complexity (Columns (1)–(3)) but unrelated to the alternative measures of economic prosperity. This is in line with
the theory of scalar stress.
Fenske (2014) proposes that ecological diversity has an effect on state centralisation. In particular, he shows that more ecologically diverse places are associated with more centralized states. His findings are based upon a sample of pre-colonial African ethnic groups, yet his insight is readily applicable to the full set of ethnic groups in Murdock’s Ethnographic Atlas. In Panel (B) of Table 12 we directly take into account this theory by controlling for a measure of ecological diversity. The introduction of these additional controls renders the effect of total solar eclipses intact. Similarly to before, ecological diversity has a bearing on societal complexity, but it seems to be uncorrelated with alternative measures of prosperity, namely, technological advancement, writing and population density.
35