Publisher’s version / Version de l'éditeur:
Geotechnical Testing Journal, 7, 2, pp. 99-103, 1984-06
READ THESE TERMS AND CONDITIONS CAREFULLY BEFORE USING THIS WEBSITE. https://nrc-publications.canada.ca/eng/copyright
Vous avez des questions? Nous pouvons vous aider. Pour communiquer directement avec un auteur, consultez la
première page de la revue dans laquelle son article a été publié afin de trouver ses coordonnées. Si vous n’arrivez
Questions? Contact the NRC Publications Archive team at
[email protected]. If you wish to email the authors directly, please see the first page of the publication for their contact information.
NRC Publications Archive
Archives des publications du CNRC
This publication could be one of several versions: author’s original, accepted manuscript or the publisher’s version. / La version de cette publication peut être l’une des suivantes : la version prépublication de l’auteur, la version acceptée du manuscrit ou la version de l’éditeur.
Access and use of this website and the material on it are subject to the Terms and Conditions set forth at
Computer-aided pressuremeter tests
Law, K. T.
https://publications-cnrc.canada.ca/fra/droits
L’accès à ce site Web et l’utilisation de son contenu sont assujettis aux conditions présentées dans le site LISEZ CES CONDITIONS ATTENTIVEMENT AVANT D’UTILISER CE SITE WEB.
NRC Publications Record / Notice d'Archives des publications de CNRC:
https://nrc-publications.canada.ca/eng/view/object/?id=893b57be-8aff-4d69-9554-a6a97829c961
https://publications-cnrc.canada.ca/fra/voir/objet/?id=893b57be-8aff-4d69-9554-a6a97829c961
N21d
.
1222
National Research
Conseil'natioiral
2 ,
2
1
I
Council Canada
de recherches Canada
m
COMPUTER-AIDED PRESSUREMETER TESTS
by
K.T. Law
ANALYZED
Reprinted from
Geotechnical Testing Journal (ASTM)
Vol. 7, No. 2, June 1984
p.
99
-
103
DBR Paper No. 1222
Division of Building Research
Price $1.00
OTTAWA
-
>NRCC 23614
& .-
~ + C I T IBkQG RES.
LIBR,AR Y
n
09
~6
BIBLIOTHSQUE
,Rach.
Batim.
C N H C-
1c1s-rf
I1
s ' a g i t
d'un
servo-mgcanisme
command'e
p a r
o r d i n a t e u r ,
e n t i ' e r e m e n t p o r t a t i f e t c o n p p o u r
Gtre
u t i l i s ' e a v e c un
p & g t rom'et r e a u t o f o r e u r Cambridge.
L ' a p p a r e i l comprend un
c a l c u l a t e u r ,
un
syst'eme d'entr'ee
de donn'ees
(DAS)
e t
un
t r a n s d u c t e u r
6 l e c t r w p n e u m a t i q u e
( E / P )
.
L ' o r d i n a t e u r
e n r e g i s t r e d e s donn'ees a u c o u r s d e l ' e s s a i g r a c e a u DAS
e t
a g i t
e n f o n c t i o n d e c e l l e s c i en a j u s t a n t l a d i f f ' e r e n c e d e p o t e n t i e l
appliqu'ee a u t r a n s d u c t e u r E / P , c e q u i a p o u r e f f e t d'augmenter
p r o p o r t i o n n e l l e m e n t l a p r e s s i o n q u ' e x e r c e l e pGn'etromStre.
A
p r ' e s e n t , i l e x i s t e q u a t r e programmmes d ' e s s a i s :
augmentation
d e l a c o n t r a i n t e p a r i n ~ r ~ e n t s ,
c o n t r a l e d e l a v i t e s s e d e
d g f o r m a t i o n , c o n t r a l e d e l a d'ef ormation
e t
e s s a i c y c l i q u e .
L e s
e x p ' e r i e n c e s e f f e c t u h s d a n s d i f f ' e r e n t s s o l s i n d i q u e n t q u e
l e
Authorized Reprint from
Geotechnical Testing Journal. June 1984 %Yrighf-
American Society for Test~ng and Materiab 1916 Race Street. Philadelohia. Pa. 19103
Computer-Aided
Pressuremeter Tests
REFERENCE: Law. K . T . . "Computer-Aided Pressuremeter Tests," mm in diameter and 0.9 m long, with a cutting shoe and inside
~eotechrricul Testiizg Journul. GTJODJ. Vol. 7, No. 2. June 1984, PP. rotating cutter at the bottom. Water is pumped down the shaft of the 99-103. cutter to flush to the surface the soil that enters the bottom end of
ABSTRACT: A completely portable computer-controlled servo-mecha- nism designed for use with the Cambridge self-boring pressuremeter consists of a computer, a data acquisition system (DAS), and an electric- to-pneumatic (E/P) transducer. The computer obtains information on the current state of a test through the DAS and determines the next step in accordance with prescribed test conditions. An appropriate voltage is then sent to the E/P transducer, which regulates in proportion to the voltage received the pressure for expanding the pressuremeter. At pres- ent, four test conditions are programmed: a controlled stress increment test, a controlled strain rate test, a controlled strain test, and a cyclic test. Experience with different soils shows that the mechanism operates to design specifications.
KEYWORDS: computers, drill holes, transducers, pressuremeter, servo-mechanism, computerized soil testing, in situ tests
Use of the pressuremeter for in situ testing is increasing. The instrument has the potential to measure the stress-strain relation of soil and in situ horizontal stress, both essential quantities for design and analysis; the Menard pressuremeter has been used extensively in France for the past 20 years [I]. As a pre-drilled borehole is required for this test, some soil disturbance is inevitable. The last decade has however seen the successful development and applica- tion of a self-boring pressuremeter designed to reduce soil distur- bance [2-51, although experience has revealed some remaining difficulties; minor changes in procedure may affect the results signi- ficantly [6,7]. The reduced disturbance may still underestimate the soil modulus and in situ horizontal stress but overestimate soil strength [a]. Different methods of interpreting the same set of data yield different results [9.10]. As yet the possible effect of loading rate has not been resolved. It is therefore desirable to test the various types of self-boring pressuremeters with repeatable and consistent procedures. For this purpose a computer-controlled servo-mech- anism has been designed by the Geotechnical Section of the Divi- sion of Building Research, National Research Council Canada (DBR/NRCC), for use with a Cambridge self-boring pressuremeter. This paper describes the mechanism and the various types of tests it can perform.
Self-Boring Pressuremeter
The self-boring pressuremeter used in this study is similar in prin- ciple to that described by Wroth and Hughes [3]. The probe is 80
'
Research officer, Geotechnical Section, National Research Council of Canada, Ottawa, Ontario, Canada KIA 0R6.01984 by the American Society for Testing and Materials
the probe. Above the shoe is an adiprene membrane section about 0.61 m long, protected by an outer flexible stainless steel sheath. Located near the center of the membrane are sensors for measuring the total radial pressure applied to the soil, pore pressure, and the radial displacement of the membrane. Dry nitrogen gas is used toex- pand the membrane. The amount and rate of expansion are con- trolled by the servo-mechanism.
The only correction required for this instrument is necessitated by the resistance of the membrane and the sheath. The pressure
P,,,
in overcoming resistance at any given strain E , defined as theratio of the radial displacement to the original diameter of the membrane, can be described with a fourth degree polynomial
P,,
=C
urZ (log E)" rr =Owhere a,, is the coefficient of the polynomial. Several methods are available for interpreting the test data giving soil characteristics. Some are based on the assumption of a certain stress-strain model 111-131; others yield the stress-strain relation by assuming soil homogeneity [2,14,15]. The latter method has been used in the DBR/NRCC study because of its simplicity and general applica- tion. It should be noted that the test procedures are generally in- dependent of the method of interpretation. which can be camed out after the test has been completed.
Principle of Operation
A number of test procedures are possible with the servo-mecha-
nism. The controlled strain rate test is used here for illustration. It
involves pressurizing the probe at a constant rate of membrane ex- pansion with time and is divided into three stages. In the first, the probe is pressurized in increments until the lift-off pressure is reached. This pressure corresponds to the point at which the applied pressure just balances the in situ total horizontal stress and the membrane starts to expand. The rate of pressure increments depends on soil stiff- ness. Experience shows that Qpical values are: 5 and 10 kPa/lO s for soft and stiff soils, respectively. It is clear that no measurable strain is recorded at this stage.
In the second stage, the membrane is expanded at a constant strain rate by applying a pressure increment to the probe and check- ing the induced strain. Depending on the difference between the strain increase and the prescribed constant rate, one of the following options is taken: (1) if the strain increase is less than the prescribed rate, another pressure increment is applied; (2) if strain increase is
100
GEOTECHNICAL TESTING JOURNALwithin an acceptable range of the prescribed rate, no change in pressure is necessary; and (3) if the strain increase exceeds the pre- scribed rate, the pressure is decreased. This second stage is illus- trated in an exaggerated manner in Fig. 1. The smoothness of the curve depends on the size of the pressure increment, the magnitude of the acceptable range, and the frequency of pressure application. All these quantities are adjustable before and during a test to accom- modate different soil response at different pressures.
The third stage is for unloading. As soon as the strain reaches a given value, usually 7.S%, the pressure in the probe is decreased at a standard rate of 50 kPa/'/z min.
Servo-Mechanism
Figure 2 is a schematic diagram of the servo-mechanism for inflat- ing the pressuremeter probe, showing the three main components of the system: computer, data acquisition system (DAS), and electric- to-pneumatic (E/P) transducer. All use a 110-V power source sup- plied by a portable Hondaa power generator.
---- P R E S C R I B E D - A C T U A L / / P R E S S U R E D E C R E A S E F I R S T _ S T A G E , S E C O N D S T A G E N O P R E S S U R E
FIG. 1-Prescribed and actual strain-time plot in controlled strain rate test.
VOLTAGE D I V I D E R
1
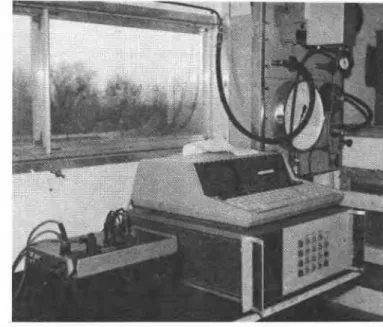
Figure 3 shows the actual servo-mechanism mounted in a service truck. In addition, a backup manual pressure control unit is in- stalled below the E/P transducer in case of power failure or problems in the servo-mechanism. It was seldom used after the initial trial period.
Computer
The computer controls the experiment and processes the experi- mental data. As the probe is pressurized, total pressure, strain, and pore pressure are monitored by its transducers. Signals are trans- mitted via the DAS to the computer where they are processed to give engineering quantities. These are examined with respect to the con- ditions prescribed for the test. A decision is then made within the computer for the next step. The basic requirements for the computer are therefore the ability to interface with a DAS and the E/P transducer, an internal clock or timer, sufficient storage capacity to run the software for the experiment, and portability for use in the field.
Optional features considered desirable include the following: a screen display for interactive operation during the experiment, a printer for hard copies of experimental data, tape or disk storage of data for future analysis, and a plotter for displaying the result in graphical form. A number of systems are available on the market that satisfy both basic and optional requirements. The system chosen for the present setup is the Hewlett Packard HP85S.
Data Acquisition System
The Hewlett-Packard HP3497A equipped with a 5% digit- resolution voltmeter and a 20-channel scanner was used to obtain measurements from the pressuremeter. Only three channels are re- quired for ordinary tests, but six channels are needed if the three dis- placement transducers and the two pore-pressure cells are to be read separately, as described by Dalton and Hawkins [16].
Besides taking readings, the DAS transmits an electrical signal (voltage) to the E/P transducer to bring a change of pressure to the probe. After the readings have been processed, a decision is made in
LAW ON PRESSUREMETER TESTS
101
the computer, and a corresponding number is sent to the DAS. This number is turned into voltage through the digital-to-analogue (D/A) converter installed on the DAS. Ranging between 0 and 10
V,
this voltage is stepped down by a voltage divider and then transmitted to the E/P transducer, which has an operating range of 0 to 0.1 V. The voltage divider can be replaced by a permanent resistor arrangement connecting the D/A converter and the E/P transducer, as shown in Fig. 4. The ratio of resistance values, R ,and R 2 , is given by
where
V 1
= voltage from D/A converter andV2
= voltage to E/P transducer.Electric-to-Pneumatic Transducer
This transducer is an instrument (Moore's Model 77) for regulating a pressure output proportional to a DC voltage input. The basic unit delivers a pressure range of 20 to 100 kPa, and for the pres- ent study a 6: 1 pressure-amplifying relay was used to boost the pres- sure range from 120 to 600 kPa. Higher amplification is possible if two relays are connected in series. The transducer and the relay are each supplied with a constant pressure (from a nitrogen tank) 30 kPa higher than the respective maximum output pressures.
System Performance
The HP85S with DAS uses an averaging technique to reduce signal noise. Readings of a certain channel are taken repeatedly, and a mean value is calculated. Trials show that there is hardly any dif- ference in the mean values, whether for 2 or for 100 readings. The times required for 3 channels, however, vary from less than 1 s to about 16 s for mean values of 2 to 100 readings. The present setup adopted a mean of 5 readings, taking 1.5 s to read 3 channels.
The E/P transducer also has a response time for operation, caused mainly by the compliance of the nitrogen in the pressure hose and probe. The length of response time varies slightly with the size of the pressure increment. At a 10-kPa increment, for instance, the average time to reach 90% of the given increment is 7.7 s and to reach 100% is 22 s. This response causes no difficulty in the con- trolled strain rate test since the computer constantly checks and ad- justs the pressure input to the probe. It does however set an upper frequency limit on a cyclic test at 0.067 Hz or 15 s per cycle. A higher frequency is possible, but the pressure amplitude may not be so easily controlled because there is insufficient time for the pressure increment and decrement to develop substantially within the cycle.
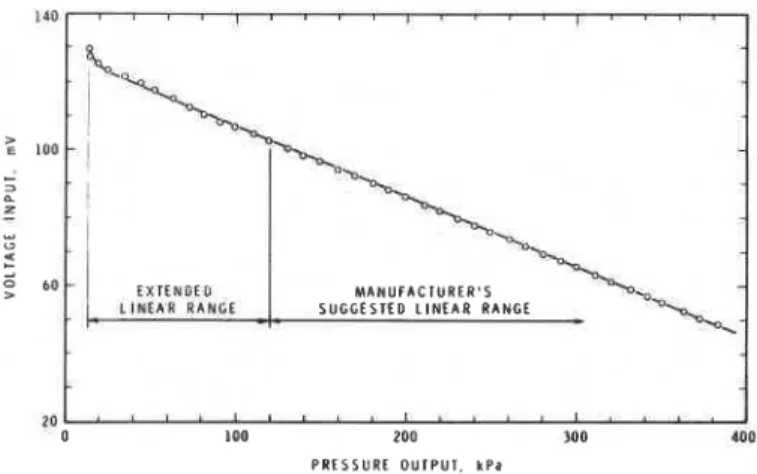
The E/P transducer with its 6: 1 pressure amplifying relay has a pressure range of 120 to 600 kPa, as suggested by the manufacturer. The model used here is a reverse acting version that yields a decreas- ing pressure with increasing voltage input. With a small overloading (about 25% of rated maximum voltage input) the linear range of the
I
1
CONVERTERFIG. 4-Servo-system mounted on service truck.
transducer is extended to 14 kPa (Fig. 5). The extension of the lower pressure range is very useful for measuring the in situ total horizontal stress in shallow, soft deposits. Any pressure output below 20 kPa will be taken up by the rigidity of the membrane and the sheath, and therefore nonlinearity below 14 kPa, the lower limit, may be dis- regarded. The E/P transducer has been used at the low pressure range for more than a year without causing problems.
Test Types
At present four test types of practical interest in geotechnical en- gineering have been programmed into the system: controlled stress test, controlled strain rate test, controlled strain test, and cyclic test. The controlled stress increment test is the simplest, applying pressure increments at regular intervals throughout the loading stage. The value of the pressure increment and the length of the in- terval are fed into the computer at the beginning of each test, allow- ing an almost infinite range of loading rates. In addition, after the test begins the computer takes continuous care of it, thus freeing the operator. When strain reaches a specified value, the pressure will be decreased at a standard rate of 50 kPa/'/z min.
The controlled strain rate test was described earlier. Again, the strain rate is provided at the beginning of a test and an infinite range of rates within practical limits is possible. To obtain a smooth linear relation between strain and time, it was found that typical rates of pressure adjustment for soft and medium clays are at 3- and 7-kPa/5 s intervals.
The controlled strain test consists of inflating the membrane at a constant strain rate until it reaches a certain value, at which it is maintained. The first part of the constant strain rate test is identical to that of the controlled strain rate test. To maintain a constant strain, the control system monitors strain about every 5 s to see whether there is significant deviation (0.01%) from the constant value. If deviation is detected, the pressure is adjusted, as for the controlled strain rate test. For most soils the total pressure tends to decrease with time at constant strain because of consolidation or relaxation. By noting the change in total and effective stresses, the coefficient of consolidation can be obtained [ I 71.
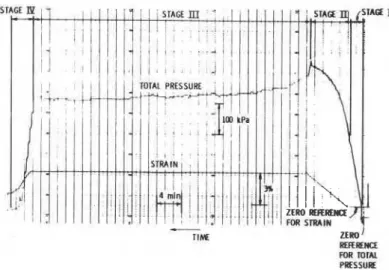
Figure 6 shows a plot of total pressure and strain versus time for a constant strain test in a sensitive medium clay with the detailed soil characteristics given by Eden and Law [18]. This plot was obtained by means of a chart recorder added to the system. The recorder is not normally required because all test data and results are available
102
GEOTECHNICAL TESTING JOURNALFIG. 6-Result of constant strain test.
through the computer, but it was used here to illustrate the system performance. Stage I is the incremental pressurization below the lift- off pressure, with noobservable strain. Stage I1 is the constant strain rate loading. The linear strain-time relation indicates that constant strain rate is achieved. The pressure-time curve is not linear because of nonlinear soil behavior. The pressure generally increases with strain in spite of some "wiggles" involving small temporary pressure decreases to maintain constant strain rate. At the end of this stage there was a small strain overshoot into Stage 111 of constant strain. The result shows that the control system can maintain constant strain with remarkable steadiness by varying total pressure. Stage
1V
is the standard procedure for unloading the pressuremeter at 50 kPa/'/2 min.
The cyclic test can be camed out by varying the total pressure at a certain amplitude and frequency. The procedure adopted was to vary the pressure for one complete cycle in a number of steps after reaching a given pressure or strain. The total number of cycles is assigned by the operator.
Figure 7 shows the record of a cyclic test registered on the chart recorder. After pressurizing the probe to 3.5% in constant in- crements, the system switched to the cyclic mode. Ten cycles were camed out, each consisting of six pressure steps, three for loading and three for unloading. After the cyclic stage the probe was inflated to 7.5% and then unloaded in the standard way.
Other test procedures are also possible. The drained test, for in- stance, can be conducted by slowly pressurizing the probe while watching the excess pore pressure. If there is no excess pore pres- sure, the pressurization can be continued; if there is significant ex- cess pressure, the pressurization may be slowed down or even stopped. While such a process is tedious if manually operated for clays, it is well suited to the servo-system.
Input and Output
Preparing the system for a test involves connecting the leads from the pressuremeter through the electronics box supplied by the manufacturer to the data acquisition system. The program, written in BASIC language, is then loaded into the computer from the cassette tape. The operator interacts with the computer in a conver- sational mode to specify the test parameters (Fig. 8). When all the parameters have been supplied, the computer instructs the operator to start testing by turning on the pressure supply.
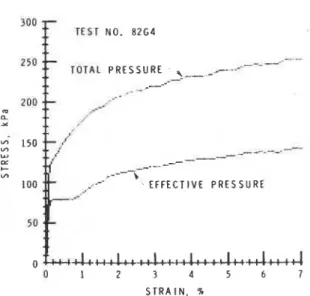
There are three types of output for the tests results. First, the raw data in engineering units are printed out; second, the data are stored on the cassette tape for possible future analyses; and third, the data are plotted on the machine (Figs. 9 and 10). These plots are limited in size and quality. Better plots may be obtained by attaching a com- patible plotter to the computer.
Summary
and
ConclusionA servo-system comprising a portable computer, a data acquisi- tion system, and an electric-to-pneumatic transducer has been de- signed for use with the Cambridge self-boring pressuremter. The computer serves as both controller and data processor. It instructs
C A M B R I D G E S . B . P R E S S U R E M E T E R T E S T K E E P P R E S S U R E V A L V E OFF E N T E R DATE A N D T I M E Y Y M M D D H H M M S S ? a 8 2 0 7 2 1 1 3 2 5 0 0 E N T E R L O C A T I O N ? O T T A W A M - 2 4 E N T E R T E S T N O . ? a 8 2 - M 2 E N T E R C O E F . F O R M E M B R A N E R I G I D I T Y ? a 1 9 . 6 5 3 4 . 4 . 0 6 5 8 8 . 4 . 1 8 3 0 6 . 2 . 3 0 2 6 1 . 0 . 1 7 4 0 1 E N T E R F A C T O R S F O R T P . S T R A I N . E P 1 N k P a . 5. k P a P E R V O L T ? A 1 3 1 6 . 3 8 . 4 6 . 1 4 0 8 E N T E R T E S T C O D E : 1 F O R C O N T R O L L E D S T R E S S 2 F O R C O N T R O L L E D S T R A I N R A T E ? C O R C O N S i A N T S T R A I N 4 F O R C Y C L I C L O A D . ? 3 2 S T R A I N R A T E C O N T R O L L E D T E S T E N T E R S T R A I N R A T E I N % I M I N A I N P U T B Y O P E R A T O R
LAW ON PRESSUREMETER TESTS
103
,0°
f
TEST N O . 8264
' . E F F E C T I V E PRESSURE
STRAIN. %
FIG. 9-Typical arithmetic plor of resultsfrom HPXSS.
'0° T E S T NO. 8 l C l
S T R A I N . %
FIG. 10-Typicul sc~r~zilog plor IJ rcsrrlrs~fror~~ HPR5S.
the data acquisition system when to take a reading and when to transmit a signal to the electric-to-pneumatic transducer to change the pressure to the pressuremeter in accordance with some pre- scribed condition. Different testing procedures can be carried out by feeding the computer appropriate information in a conversational mode. At present, four test types have been incorporated for testing various soils: controlled stress increment test, controlled strain rate test, controlled strain test, and cyclic test. The system performs well, actual test paths following closely the prescribed ones. A wide choice of rates of testing is possible, whether in terms of stress or of strain. For the cyclic test, there is a limitation in that adequate control is dif- ficult with frequencies exceeding 0.067 Hz because of the com- pliance of nitrogen gas. This limitation is inherent if gas is used as the pressurizing fluid. All test results are stored on cassette tapes. printed, and displayed on the plotter of the computer. Thus, the use of computer technology enhances the capability of the pressure- meter, increases its reliability and accuracy, and reduces the time re- quired for data processing and dependence on human limitations.
Acknowledgment
The author would like to express his sincere appreciation to his colleague, W. J. Eden, for his advice during the development of the
system. This paper is a contribution from the Division of Building Research, National Research Council Canada, and is published with the approval of the director of the division.
References
[ I ] Baguelin, F.. Jkzkquel. J. F.. and Shields. D. H.. Pressuremeter and Foundo~iort E~zgineeriizg, Trans Tech Publications. Clausthal, Ger- many, 1978.
121 Baguelin, F., Jkzkquel, J. F., LeMee, E., and LeMehaute, A.. "Ex- pansion of Cylindrical Probes in Cohesive Soils," Journal of the Soil
Mechanics and Foundation Division. Proceedings of the American Society of Civil Engineers. Vol. 98. No. SM1. Nov. 1972, pp. 1129-
1142.
(31 Wroth. C. P. and Hughes. J. M. 0.. "An Instrument for the In Situ Measurement of the Properties of Soft Clays." Proceedings of rhe
Eighth International Conferertce on Soil Mechanics and Engineering. Moscow. U.S.S. R . , Vol. 1, Part 2. 1973, pp. 487-494.
141 Amar, S., Baguelin, F., Jtzkquel, J. F., and LeMehaute, A., "In Situ Shearing of Clays," Proceedings of the American Society of Civil
Engineers Specialty Conference on In Situ Mcasurenzertt of Soil Prop- erties, Vol. 1, American Society of Civil Engineering, New York, 1975, pp. 22-45.
[S] Wmth. C. P., "British Experience with the Self-Boring Pressuremeter,"
Symposium Sur La Pressiometer Et Ses Applications En Mer, Paris, 1982. in press.
[ 6 ] Wroth, C. P., "Cambridge In-Situ Probe." Proceedings of the Sym-
posium on Site Exploration in Soft Ground Using In-Situ Techniaues.
bepartment of Transportation, Federal Highway ~dministrition, Washington, DC. Jan. 1980, pp. 97-135.
[ 7 ] Law. K . T. and Eden. W. J., "Influence of Cuning Shoe Size in Self Boring Pressuremeter Tests in Sensitive Clays," Canadian Geotech-
nrcalJournal, Vol. 17. No. 2, May 1980, pp. 313-319.
[ R ] Law. K. T. and Eden, W. J., "Effects of Soil Disturbance in Pressure- meter Tests," Conferertce on Updating Subsurface Sampling of Soils
and Rocks and Their In Situ Testing, Santa Barbara. CA. Jan. 1982.
[ 9 ] Lacasse, S., Jamiolkowski, M., Lancelotta. R., and Lune, T., "In-Situ Stress-Strain-Strength Characteristics of Two Norwegian Clays," Pro-
ceedings of X International Conferertce on Soil Mechanics and Foun- dation Engineering, Vol. 2. A. A. Balkema, Rotterdam, Netherlands,
1981, pp. 507-512.
[ l o ] Denby. G. M. and Hughes, J. M. 0.. "Horizontal Stress Interpretation of Pressuremeter Tests," Conference on Updating Subsurface Sam-
pling of Soils and Rocks and Their In-Situ Testing, Santa Barbara, CA. Jan. 1982, in press.
[ I l l Gibson, R. E. and Anderson, W. F., "In-Situ Measurement of Soil Properties with the Pressuremeter," Civil Engineering and Public
Works Review. ILondon). Vol. 56, No. 658, May 1961. pp. 615-618.
1121 Prevost. J. H. and Hwg. K., "Analys~s of Pressuremeter in Strain- Softening Soil," Journal of the Geotechnical Engineerirtg Division.
Proceedings of the American Society of Civil Engineers. Vol. 101, No. GT8, Aug. 1975, pp. 717-731.
[I31 Denby. G. M.. "Self-Boring Pressuremeter Study of the San Francisco Bay Mud," Ph.D. dissertation, Standford University, Stanford. CA, 1978.
1/41 Ladanyi. B.. "In Situ Determinat~on of Undrained Stress-Strain Behaviour of Sensitive Clays with the Pressuremeter," Canadian
GeotechnicalJournai, Vol. 9, No. 3. Aug. 1972, pp. 165-173.
!IS] Palmer. A. C.. "Undrained Plane-Strain Expansion of a Cylindrical Cavity in Clay: A Simple Interpretation of the Pressuremeter Test,"
Geotechniquc. Vol. 22. No. 3. Sept. 1972. pp. 451-457.
116) Dalton. J. C. P. and H a ~ k ~ n s . P. G.. "Field of Stress-Some Measure- ments of the In-Situ Stress in a Meadow in the Cambridgeshire Coun- tryside." Ground Engineering. Vol. 15. No. 4. May 1982. pp. 15-23.
[I71 Clarke, B. G., Carter, J-P.. and Wmth, C. P., "In-Situ Determination of the Consolidation Characteristics of Saturated Clays," Proceedings
of the 7th European Conference on Soil Mechanics and Foundation Engineering, Vol. 2, British Geotechnical Society. London. England. pp. 207-213.
[ l a ] Eden. W . J. and Law. K. T., "Comparison of Undrained Shear Strength Results Obtained by Different Test Methods in Sofi Clay."
Canadian Geotechnical Journal, Vol. 17, NO. 3. Aug. 1980, pp. 369-381.