HAL Id: tel-03020198
https://tel.archives-ouvertes.fr/tel-03020198
Submitted on 23 Nov 2020HAL is a multi-disciplinary open access archive for the deposit and dissemination of sci-entific research documents, whether they are pub-lished or not. The documents may come from teaching and research institutions in France or abroad, or from public or private research centers.
L’archive ouverte pluridisciplinaire HAL, est destinée au dépôt et à la diffusion de documents scientifiques de niveau recherche, publiés ou non, émanant des établissements d’enseignement et de recherche français ou étrangers, des laboratoires publics ou privés.
positron emission tomography and high field magnetic
resonance imaging
Emilie Poirion
To cite this version:
Emilie Poirion. Biological mechanisms driving neurodegeneration in Multiple Sclerosis : an in vivo approach combining positron emission tomography and high field magnetic resonance imaging. Human health and pathology. Sorbonne Université, 2019. English. �NNT : 2019SORUS327�. �tel-03020198�
Sorbonne Université
Ecole doctorale Cerveau, Cognition, Comportement (ED3C)
Institut de Cerveau et de la Moelle épinière
Biological mechanisms driving
neurodegeneration in Multiple Sclerosis
An in vivo approach combining positron emission tomography and
high field magnetic resonance imaging
Par Emilie Poirion
Thèse de doctorat de Neurosciences
Dirigée par Bruno Stankoff en co-encadrement avec Alexandre Vignaud
Présentée et soutenue publiquement le 20 septembre 2019 Devant un jury composé de :
Loureiro De Sousa Paulo
Ingénieur de recherche – HDR Rapporteur Inglese Matilde Associate Professor Rapporteur Callot Virginie Directrice de recherche Examinateur Kas Aurélie
Professeur des Universités – Praticienne hospitalière
Examinateur
Vignaud Alexandre
Ingénieur de recherche – HDR
Co-encadrant
Stankoff Bruno
Professeur des Universités – Praticienne hospitalière
2 Cette aventure commence peu avant l’été 2013. Je viens d’être acceptée dans le master de mes rêves ! C’est une opportunité exceptionnelle d’étudier le traitement d’image en apprentissage. Fini les petits boulots le soir et le week-end pour payer le loyer ! Il ne reste plus qu’à trouver une entreprise… de préférence travaillant sur l’IRM… dans le cerveau… En région parisienne, je les cherche encore… Mais attends, il y a ce laboratoire où j’ai fait un stage en 2ème année de licence, l’ICM je crois. La prise de contact est réussie ! Contrairement aux autres ingénieurs de mon master, je n’irai pas dans l’industrie, j’irai dans la recherche !
C’est après tout ce chemin parcouru, plus ou moins sinueux, que je conclus cette aventure. Il est maintenant tant pour moi de remercier toutes les personnes qui ont jalonné mon parcours et m’ont permis d’aboutir à cet instant.
Bruno, je pense qu’il convient de commencer ces remerciements en 2013 après un entretien pour un contrat d’apprentissage. Je ne vous remercierais jamais assez d’avoir crû en cette jeune fille voulant faire de l’imagerie mais ne connaissant rien à la SEP. Merci de m’avoir offert l’opportunité de découvrir le monde de la recherche (et le monde tout court ! Vive les congrès !!), et de m’avoir aidé à prolonger cette aventure par une thèse ! Merci pour m’avoir fait découvrir les neurosciences et d’avoir toujours pris le temps de m’expliquer la pathologie.
Alexandre, malgré le peu de résultats que je présente sur le travail que nous avons effectué ensemble, il est important de souligner à quel point votre encadrement m’a permis d’arriver au bout de cette thèse et de ce manuscrit. Merci pour votre bienveillance au cours de la thèse, votre expertise méthodologique et pour vos précieux conseils sur mon avenir. Durant 4 ans, malgrés les obstacles, vous m’avez encouragé à fournir le meilleur de moi-même. Merci pour votre rigueur de travail et votre organisation, qui j’espère on déteint sur moi !
Benedetta, je te l’ai déjà dit et je te le redis : tu es mon phare dans la nuit. Tu es la personne que je regarde durant mes présentations pour me donner du courage, tu as été là pour moi dans les hauts comme dans les bas de cette thèse (petite pensée pour l’ECTRIMS 2017 et la préparation de l’oral la veille devant les toilettes du centre de congrès…). Tu as été beaucoup plus qu’une collègue pendant ces 6 années ! Tu as été une vraie amie
Melina et Corentine, il n’y a pas de mots pour vous dire à quel point je suis reconnaissante ! Vous m’avez « convaincu » de faire une thèse… Mais quelle aventure en votre compagnie, que ça soit au labo, le soir après le labo autour d’une bolinette de frites ou le we en virée shopping !
Merci à tous ceux qui ont contribué à ce travail : merci à Matteo toujours disponible pour répondre à mes questions ou pour prendre un café, merci à Vito, pour ton aide dans la rédaction de ce manuscrit (tu seras peut-être le seul à l’avoir lu entièrement), merci à Géraldine pour son aide constante dans le pré-processing des données, merci à Charline et Marine d’avoir été autant motivées pour apprendre le python avec moi. Enfin merci à Daniel, qui m’a encadré à mon arrivé dans l’équipe.
3 Je tiens aussi à remercier les membres de l’équipe Stankoff/Lubetzki, en particulier le Pr. Lubetzki pour m’avoir accueilli dans son équipe de recherche, Anne pour ces précieux conseils autant sur la pathologie que sur le design de figures, Marie-Stéphane merci d’avoir en permanence le sourire et de débarquer dans le bureau juste pour papoter ! ainsi que tous les membres présents et passés qui ont participé à rendre cette expérience agréable.
Merci aussi à Cynthia et aux axonautes pour tous ces bons moments passés ensemble. Merci à Ben pour nos #DepressionMonday. Merci à Issac et Julie pour avoir partager avec moi votre intérêt pour la salsa, et votre soutien durant cette thèse.
Au cours de cette thèse, j’ai eu la chance de partager mon temps entre l’ICM et Neurospin. J’ai aujourd’hui la chance de remercier tous les membres de l’équipe METRIC et bien plus pour ces 4 années passées avec eux. Merci à Nicolas Boulant et Vincent Gras pour votre aide dans ce travail et de l’opportunité exceptionnelle d’utiliser vos pulses dans mon protocole. Merci à Franck Mauconduit pour son aide dans les manips, ses conseils et sa disponibilité (surtout pour les manips à 8h du matin).
Merci au « petits spins » qui m’ont accompagné au cours de cette thèse, en particulier à Lisa et Carole, mes co-thésardes avec qui j’ai découvert le monde. Merci à Arthur pour nos discussions à l’interface entre la méthodo et les neurosciences. Merci à Gaël, le voisin d’en face ainsi qu’à Raphaël et Loubna pour leurs blagues au quotidien. Merci à Zo pour ta bonne humeur. Merci à Allegra, Achille et Gabrielle pour notre voyage à Bali. Merci à Caroline, Bruno, Aurélien, et tous les stagiaires pour les pauses café.
Merci à l’équipe des manips de Neurospin, du SHFJ et de l’ICM, les infirmières et les ARCs, en particulier Véronique Joly-Testault, pour leur soutien, et leurs encouragements dans le projet FLUMASEPT.
Je remercie également tous les membres de mon jury : Paulo Loureiro De Sousa pour avoir suivi mon travail durant cette thèse et pour vos conseils autant méthodologiques que personnels, et Dr Matilde Iglese pour avoir, tous les deux accepté d’être rapporteurs de ce travail ainsi que Pr. Virginie Callot et Pr. Aurélie Kas pour avoir examiné ce travail.
Je vais clore ces remerciements par mes proches. Merci à mes amis de toujours : Julie, Toto et Khalil. Merci à toute ma famille, mon papa de toujours me dire qu’il est fier de moi, mamie, Jannick, Ghislaine de toujours me rappeler que je dois me reposer, mon frère Julien, ma belle-sœur Cécile et leur petit bouchon Iloh. Merci à tous d’avoir toujours crû en moi ! David, merci pour tes encouragements, ton soutien pendant ces 4 années et pour ta bonne humeur au quotidien.
4
Remerciements ... 2
Table of Contents ... 4
Abbreviations ... 8
General introduction ... 12
Chapter 1 Multiple Sclerosis ... 14
1.1 Introduction ... 16
1.2 Epidemiology and risk factors ... 16
1.3 Diagnosis of MS ... 18
1.3.1 Since Charcot to McDonald 18 1.3.2 Magnetic Resonance Imaging 20 1.3.3 McDonald criteria for diagnosis of MS: 2017 revision 22 1.4 Evolution and prognosis ... 22
1.4.1 Clinical phenotypes 22 1.4.2 Prognosis and prediction 24 1.5 The clinico-radiological paradox ... 27
1.6 Conclusion ... 29
Chapter 2 Mechanisms involved in the pathology of MS: WM and GM hallmarks 30 2.1 Introduction ... 32
2.2 White matter damage ... 32
2.2.1 Focal demyelination and inflammation 32 2.2.2 Diffuse white matter damage 36 2.3 Grey matter involvement ... 38
2.3.1 Cortical lesions 38 2.3.2 Meningeal inflammation 39 2.4 Conclusion ... 42
Chapter 3 Characterizing physiopathology of MS through the lens of imaging techniques ... 44
3.1 Introduction ... 46
3.2 Pathological mechanisms affecting the WM ... 46
3.2.1 Chronic inflammation 46
5
3.3 Pathological mechanisms affecting the GM ... 73
3.3.1 Imaging cortical lesions: the tip of the ice-berg 73 3.3.2 Characterizing tissue damage in cortical lesions 81 3.3.3 The diffuse gray matter damage 82 3.4 Conclusion ... 86
Chapter 4 Rational of the thesis ... 88
Chapter 5 Individual mapping of innate immune cell activation is a candidate marker of patient-specific trajectories of disability worsening in MS ... 90
5.1 Introduction ... 92
5.2 Material and methods ... 94
5.3 Results ... 101
5.4 Discussion ... 105
5.5 Conclusion ... 107
Chapter 6 A periventricular gradient of innate immune cell activation suggests a CSF-derived neurodegenerative component in MS ... 110
6.1 Introduction ... 112
6.2 Materials and methods ... 114
6.3 Results ... 122
6.4 Discussion ... 129
6.5 Conclusion ... 132
Chapter 7 Individual map of remyelination in the cortex ... 134
7.1 Introduction ... 136
7.2 Methods ... 136
7.3 Results ... 140
7.4 Discussion ... 142
7.5 Conclusion ... 143
Chapter 8 Improving cortical lesion detection in MS ... 144
8.1 Introduction ... 146
8.2 UHF imaging challenges ... 146
8.2.1 B0 heterogeneity 146 8.2.2 B1+ heterogeneity 147 8.2.3 Specific Absorption Rate (SAR) 147 8.3 Solutions to B1+ inhomogeneities ... 147
6
8.4.1 Better sequences for lesions detection 153
8.4.2 Solutions for whole-brain coverage 154
8.4.3 Aims 155 8.5 Methods ... 155 8.5.1 Subjects 155 8.5.2 Imaging protocols 155 8.5.3 Lesion identification 158 8.6 Results ... 158 8.6.1 7T CP MRI vs 7T UP MRI 158 8.6.2 3T MRI vs 7T UP MRI 162 8.7 Discussion ... 165 8.8 Conclusion ... 168
General Conclusions: The answer of the key questions ... 170
1. In vivo characterization of WM pathology at the individual level ... 170
1.1. Individual maps of activated innate immune cells and lesion classification 170 1.2. Regionalization of the activated innate immune cells together with tissue damage 173 2. In vivo characterization of the cortical pathology at the individual level ... 175
2.1. Individual maps of cortical myelin repair 175 2.2. Improve cortical lesion detection 176 3. Ongoing works and future directions ... 177
3.1. Beyond signle mechanism 177 3.2. Other possible targets to image neuroinflammation 180 4. Conclusion ... 181
Bibliography ... 182
Appendices ... 216
Appendix 1. Dynamic imaging of individual remyelination profiles in multiple sclerosis ... 218
Appendix 2. Inflammatory demyelination in the cortex contributes in individual trajectory of disability worsening in MS ... 219
Appendix 3. Enlargement of white matter MS lesions is associated with lesional microglial activation measured in vivo ... 220
7
Appendix 4. Learning myelin content in multiple sclerosis from multimodal MRI through adversarial training ... 221 List of figures ... 222 List of tables ... 226
8 A2AR Adenosine A2A receptors
AD Axial diffusity B0 Static magnetic field
B1+ Radiofrequency transmit field BBB Blood brain barrier
BH Black hole
CB2 Cannabinoid receptor-2
CHARMED Composite hindered and restricted model of diffusion CIS Clinically isolated syndrome
CNR Contrast to Noise Ratio CNS Central nervous system
CNTF Cytokine ciliary neurotrophic factor CP Circular polarization
CSF Cerebro-spinal fluid DGM Deep grey matter
DIR Double inversion recovery DIS Dissemination in space DIT Dissemination in time
DPA+ Voxel characterized by a significant activation of innate immune cells DTI Diffusion tensor imaging
DVR Distribution volume ratio DWI Diffusion weighted imaging
EAE Experimental autoimmune encephalomyelitis EDMUS European database for multiple sclerosis EDSS Expanded disability status scale
FA Fractional anisotropy
FDA U.S. Food and Drug Administration FDG fluorodeoxyglucose
FLAIR Fluid attenuated inversion recovery FMZ Flumazenil
9 Gd Gadolinium
Gd+ Gadolinium-enhancement GM Grey matter
GRE Gradient-echo HAB High affinity binder HC Healthy control
HLA Human leukocyte antigens
HRRT High resolution research tomograph ihMT Inhomogeneous magnetization transfer LAB Low affinity binder
MAB Mixed affinity binder MD Mean diffusivity
MP2RAGE Magnetization prepared 2 rapide gradient-echo MPRAGE Magnetization prepared rapide gradient-echo MRI Magnetization resonance imaging
MS Multiple sclerosis
MSFC Multiple sclerosis functional composite MSSS Multiple sclerosis severity score
MTI Magnetization transfer imaging MToff Without magnetization tranfer MTon With magnetization tranfer MTR Magnetization transfer ratio
NODDI Neurite orientation dispersion and density imaging OPC Oligodendrocyte progenitor cell
PBR Peripheral benzodiazepine receptor PET Positron emission tomography PiB Pittsburg compound
PPMS Primary progressive multiple sclerosis pTx Parallel transmission
PVE Partial volume effect
qMT Quantitative magnetization transfer QSM Quantitative susceptibilty mapping
10 RFPA Radiofrequency power amplifier
ROI Region of interest
RRMS Relapsing-remitting multiplle sclerosis SAR Specific absoption rate
SNR Signal to noise ratio SPINS Spiral non-selective
SPMS Secondary progressive multiple sclerosis SUV Standard uptake value
SWI Susceptibility weighted imaging T1-se T1 spin-echo
T1-w T1-weighted
T1-w+c T1-weighted + contrast agent T2*-w T2*-weighted
T2-w T2-weighted TH Thalamus/Thalami TSPO Translocator protein UHF Ultra-high field UP Universal pulse
USPIO Ultra-small superparamagnetic iron oxide VOP Virtual observation points
12 Multiple Sclerosis (MS) is one of the most common diseases of the central nervous system, affecting almost 2.3 million people worldwide of which 100 000 in France, mainly women with a ratio of 3:1 worldwide. The disease remains a major public health issue as the leading cause of non-traumatic neurological disability among young adults.
MS is classically considered an immune-mediated demyelinating disorder of the central nervous system (CNS), where focal white matter (WM) lesions represent the pathological hallmark of the disease. Current therapies are principally focused on the inflammatory component of the disease, but are poorly effective on the long-term disability progression. Consequently, the possibility of an associated grey matter (GM) damage has been increasingly investigated over the past decade, and a link between disability and neuronal damage leading to neurodegeneration has been demonstrated.
Post-mortem studies and experimental models have led to identify multiple mechanisms leading to the neuro-axonal damage: i) microglial activation, ii) cortical demyelinated lesions, iii) failure of repair, and iv) neuronal loss.
The development of new imaging techniques able to specifically measure the neuronal damage occurring within the grey matter of patients with MS, as well as the biological mechanisms triggering neurodegeneration would represent a cutting edge progress in the investigation of the pathophysiological mechanisms underlying disability worsening.
On conventional structural magnetic resonance imaging (MRI) acquired at 1.5 or 3T, the extent and severity of GM pathology remain poorly visualized. Significant GM tissue loss characterizes patients with MS on anatomical T1-weighted sequences, and correlates with physical and cognitive disability, but such atrophy measurements are inherently non-specific. Metrics derived from non-conventional MRI techniques, such as magnetization transfer imaging, have been proposed to measure the early pathology of GM in MS. However, while being sensitive to the diffuse changes occurring during the course of the disease, none of these techniques has proved to be specific for assessing the damage of the neuronal compartment and to efficiently detect the cortical damage.
13 Cortical demyelinated lesions are poorly detected using convention MRI, with at best a third of cortical lesions being detected. Magnetization transfer imaging showed areas of decreased magnetization transfer ratio in the cortex of MS patients, which could correspond to areas of demyelination. Ultra-high field 7T MRI provides unprecedented high signal- and contrast-to-noise ratio for brain imaging that has the potential to open outstanding perspectives for the investigation of the pathophysiology of MS, allowing the visualization of cortical demyelinated lesions as well as other cortical pathological components.
In parallel to the increase visualization of GM damage, molecular imaging techniques have allowed to specifically assess mechanisms of WM and GM pathology. Positron Emission Tomography (PET) is an imaging technology based on the injection of radiotracers directed against specific molecular targets and has recently allowed the selective quantification in
vivo of the key biological mechanisms relevant to MS pathophysiology: microglial
activation, failure of repair, and neuronal damage.
This manuscript will first attempt to present current concepts of WM and GM damage in MS from a histological, immunological and neuroimaging point of view, highlighting the relationship between demyelination and inflammation in our understanding of disability progression. We will underscore the need for new imaging techniques specific of these two mechanisms to fully understand the origin of the neurodegenerative process and its relevance over the course of the disease. In the second part of this work, we will propose the use of PET with [18F]-DPA714 as marker of innate immune cell activation in MS by presenting the detailed methods and results of two pilot studies conducted at different stages of the disease. Then, we will investigate the cortical pathology and the mechanism of myelin repair using MTR imaging and the UHF 7T in two pilot studies conducted on patients with MS. Finally, the conclusions drawn from all the studies presented in this thesis will be summarized, and the answer to the key questions proposed at the end of the introduction will be provided. Future research perspectives that could originate from the results reported in this thesis will be presented.
14
Chapter 1
Multiple Sclerosis
Chapter Outline
1.1 Introduction ... 16 1.2 Epidemiology and risk factors ... 16 1.3 Diagnosis of MS ... 18 1.3.1 Since Charcot to McDonald 18 1.3.2 Magnetic Resonance Imaging 20 1.3.3 McDonald criteria for diagnosis of MS: 2017 revision 22 1.4 Evolution and prognosis ... 22
1.4.1 Clinical phenotypes 22
1.4.2 Prognosis and prediction 24 1.5 The clinico-radiological paradox ... 27 1.6 Conclusion ... 29
16
1.1 Introduction
Since the first pictorial descriptions of Multiple Sclerosis as a disseminated plaque-like sclerosis by Jean Cruveilhier in his Anatomie Pathologique du corps humain (Cruveilhier, 1842) and Robert Carswell in Pathological Anatomy: Illustrations of the Elementary Forms
of Disease (Carswell, 1838), followed by its identification and classification as a distinct
entity by Jean Martin Charcot in a series of major lectures (Charcot, 1868), a long way has been done in the ability to diagnose and characterize the features of la sclérose en plaques. Multiple Sclerosis is now recognized as one of the most common diseases of the central nervous system (including the brain, the spinal cord and optic nerves), and is a very active field of research. MS is defined as a chronic inflammatory and demyelinating disease, affecting 2.3 million people worldwide of which at least 65 000 in France in 2016 (GBD 2016 MS Collaborators, 2019). However, the latter estimation is thought to be underestimate, with an estimation of 100 000 patients with MS in France, reported by the French MS society ARSEP (https://www.arsep.org/). The disease remains a major public health issue as the leading cause of non-traumatic neurological disability among young adults. Moreover, no cures have been found for MS.
1.2 Epidemiology and risk factors
In a recent paper of the GBD 2016 MS Collaborators, a global analysis of epidemiology of the disease was performed by grouping information from the literature (GBD 2016 MS Collaborators, 2019). Between 1990 and 2016, they have detected an increased prevalence of MS of +10.4% worldwide.
The global prevalence of MS differs by sex, as MS is known to affect more women. Female:male sex ratios of about 2-2.5:1 have been frequently reported (Pugliatti et al., 2006; Trojano et al., 2012). The sex prevalence of MS seems to undergo dynamic changes, with several recent examples of increasing sex ratios summarized by Leray and colleagues (Leray et al., 2016). In a Canadian study comprising all registered cases in Canada, the female:male sex ratio by year of birth increased from about 1.9:1 in cases born in 1936–1940, to almost 3.2:1 in the latest birth cohort from 1976 to 1980 (Orton et al., 2006). The gender ratio has changed due to an increase incidence of MS in women. Such increase might be the result of multiple factors such as environmental changes. Several factors have been suggested, including later pregnancy, use of oral contraception, smoking, obesity, less physical activity and more stress (Leray et al., 2016).
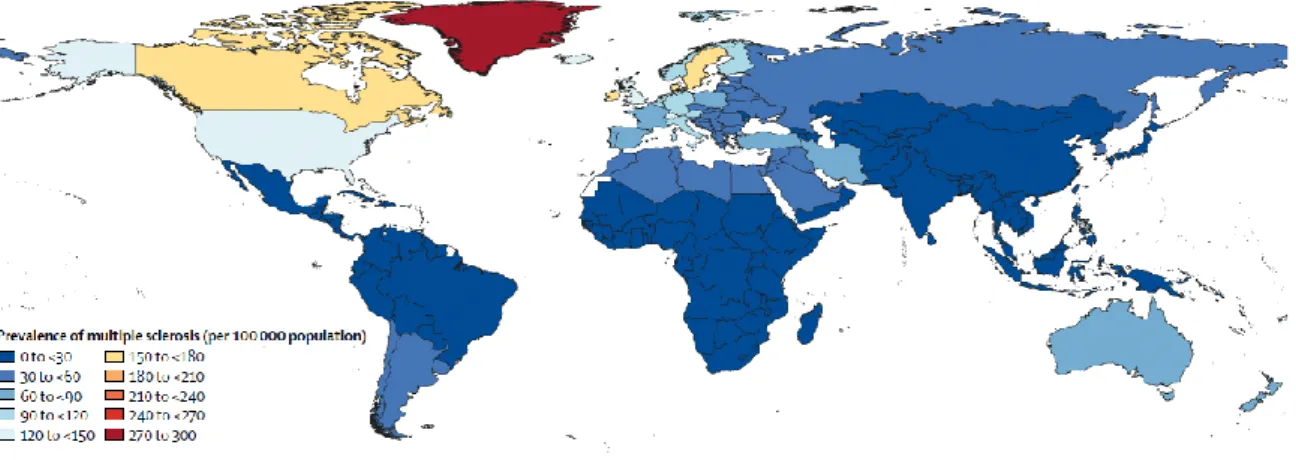
17 MS prevalence varies greatly between continents. Indeed, a demographic heterogeneity has been described in the prevalence of MS worldwide (Figure 1.1), from high levels (>120 cases of MS/100 000 habitants) in North America and some northern European countries to lower levels (<60 cases of MS/100 000 habitants) in Asia and Sub-Saharan Africa. However, the notion of a latitude gradient has been questioned because of the heterogeneity in the diagnosis accuracy and cases ascertainment between the northern and southern hemispheres (Koch-Henriksen and Sorensen, 2011). Moreover, the notion of a latitude gradient is also questioned as genetic and environmental factors are thought to play a key role over geography in the prevalence and incidence of MS. Of particular interest, lower circulating level of vitamin D has been associated with a higher risk of MS (Ascherio et al., 2010, 2014). Other environmental factors such as cigarette smoking (Ramanujam et al., 2015), Epstein-Barr virus infection (Levin et al., 2010), organic solvent, adolescent obesity, and working night shifts have been identified.
Figure 1.1: Age-standardized multiple sclerosis prevalence per 100 000 populations in 2016 for both sexes, by location
From (GBD 2016 MS Collaborators, 2019)
The increased heritability within family provides evidence that genetic factors have a prominent role in the development of MS. The association between MS and variations in the genes encoding human leukocyte antigens (HLA) within the major histocompatibility complex was first observed several decades ago (Jersild et al., 1972; Naito et al., 1972). As an example, it was shown that carriers of the class II variant HLA DRB1*15:01 allele are about three times more likely to develop MS than non-carriers (Patsopoulos et al., 2013). Not less than 110 other non-HLA genes has been identified as heritable risk factors for MS (The International Multiple Sclerosis Genetics Consortium, 2007), such as IL2RA and IL7RA. Interestingly, most of the non-HLA known MS-associated genes regulate adaptive
18 and innate immunity, cytotoxic and regulatory T cell and microglia function, providing further evidence that MS is primary an immune-mediated disease.
However, the lifestyle and environmental risk factors or genetic predisposition only explain a fraction of the disease risk. Certain factors such as smoking, Epstein-Barr virus infection and obesity, can interact with HLA risk genes, and influence adaptive and/or innate immunity (Olsson et al., 2017).
1.3 Diagnosis of MS
1.3.1 Since Charcot to McDonald
Since the first description of clinical features of MS by Jean Martin Charcot, the diagnostic criteria has changed considerably over time (Przybek et al., 2015). The first guideline provides by Charcot, followed by Marburg, outlines triads of symptoms, which appeared to be not specific enough to MS and occurred in others neurological disorders (Charcot, 1868; Marburg, 1906). In 1954, Allison and Milliar have classified their pathological cases “according to an arbitrary scheme”, introducing for the first time clinical classification of patient as “early”, “probable” or “possible” MS (Allison and Millar, 1954). This classification recognized the appearance of symptoms at different time points involving different regions of the CNS, giving the definition of the dissemination in time (DIT) and the dissemination in space (DIS), still used to diagnose MS. The classification mentioned above were used by Schumacher and colleagues to develop new guidelines for the diagnosis of “clinically definite“ form of MS and to exclude alternative diagnoses (Schumacher et al., 1965). Over the next few years, it was pointed out that the Schumacher’s criteria were too restrictive, leading to multiple attempts to improve these guidelines, without much success. In 1983, a committee of MS experts have established a formalized guidelines for the diagnosis of MS (Poser et al., 1983) (Figure 1.2). These were based on previous Schumacher’s criteria (Schumacher et al., 1965). To improve the diagnosis, Poser and colleagues have proposed to classify patients in two major groups, definite and probable (Poser et al., 1983). The main clinical feature was a “relapse” defined as the occurrence of neurological symptoms, typical of MS, and lasting for at least 24 hours. Poser criteria allows the diagnosis of definite MS when there are at least two separate attacks (proof for DIT), separated from 30 days since the start of the first attack recovery until the onset of the second attack, with clinical evidences of two separate lesions (only one if paraclinical evidence of another) involving two different parts of the CNS (proof for DIS) or laboratory support by
19 examination of the cerebro-spinal fluid (CSF) (presence of oligoclonal band or increased production of immunoglobulin G). Laboratory support performed by CSF examination assists in the differential diagnosis by providing evidences of MS (oligoclonal bands present in the patient’s CSF), helpful in ruling out other infectious or inflammatory conditions. Paraclinical evidences of a lesion aim to detect lesion that has not produced clinical signs of neurological dysfunction. Such tests and procedures could be achieved by a variety of technics, including evoked potential, hyperthermia, or specific urological studies.
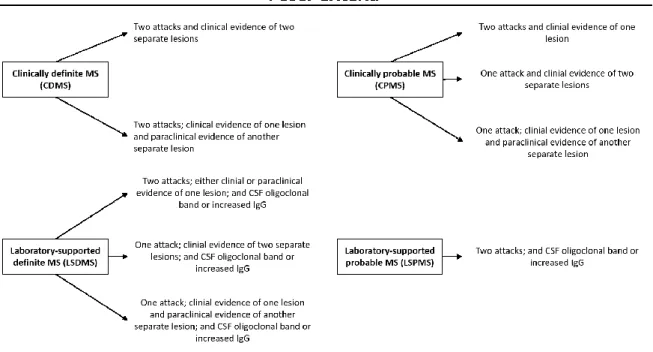
Figure 1.2: Poser Criteria for diagnostic of Multiple Sclerosis
In the Poser Criteria, two attacks must involve different parts of the CNS, must be separated by a period of at least one month, and must each last a minimum of 24 hours
The development of technology as MRI scans has led to an update of the MS criteria in 1997 based on the recommendations by Barkhof and colleagues (Barkhof et al., 1997), followed in 2000 by Tintoré and colleagues (Tintoré et al., 2000). The criteria for the diagnosis of definite MS was then revised in 2001 by a consensus of MS experts under the supervision of Ian McDonald (McDonald et al., 2001), revised in 2005 (Polman et al., 2005a), 2011 (Polman et al., 2011) and 2017 (Thompson et al., 2018). These successive revisions aimed to simplify the diagnosis criteria, with increasing sensitivity without modifying the specificity, and thus allowed and earlier diagnosis. Based on the McDonald criteria, a diagnosis of MS can be reached on clinical assessment alone if the patient have experienced two or more attacks associated to clinical evidence of at least two lesions. In other case (two
20 attacks with evidence of a single lesion, one attack, progressive course), MRI should be used to assess either DIS or DIT.
1.3.2 Magnetic Resonance Imaging
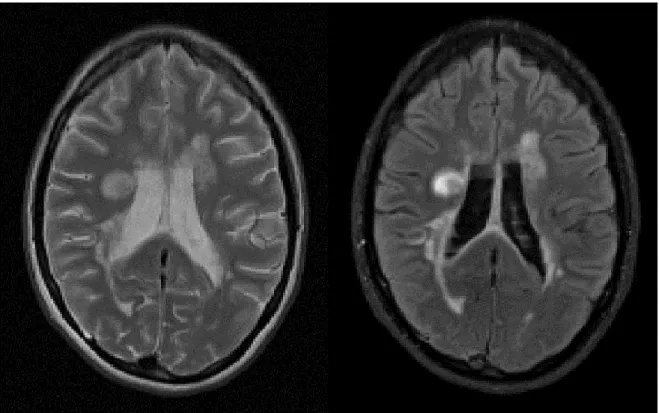
Over the years, MRI has been more and more used in the diagnosis of MS and it is currently the most useful paraclinical tool to assess this diagnosis. MS is characterized by the presence of visible focal areas of demyelination in the CNS, detectable by MRI using T2-weighted (T2-w) or Fluid attenuated inversion recovery (FLAIR) sequences (Figure 1.3). Lesions appear hyperintense on these two sequences compared to WM signal. On MRI, WM lesions tend to appear round or ovoid in shape and their size ranges from few millimeters to more than one centimeter in diameter. Signal alteration between or surrounding lesions can be observed on T2-w image of the brain characterizing the “dirty” WM, which occurs mainly in the deep and periventricular WM. A high propensity of WM lesions has been detected in the deep and periventricular WM areas using MRI (Narayanan et al., 1997), but can also be seen in juxtacortical or infratentorial areas.
Figure 1.3: MS lesions visible as hyperintensities on T2-w and FLAIR sequences.
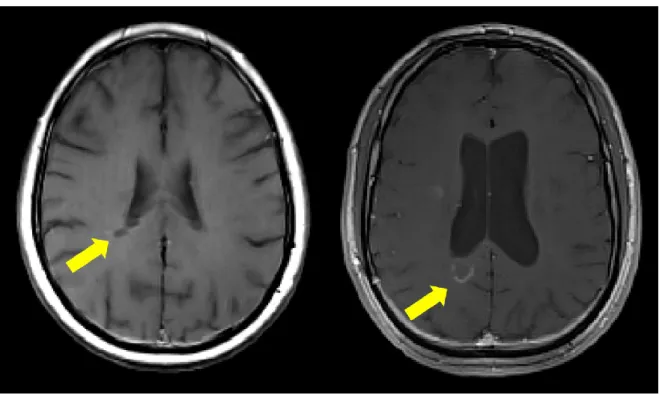
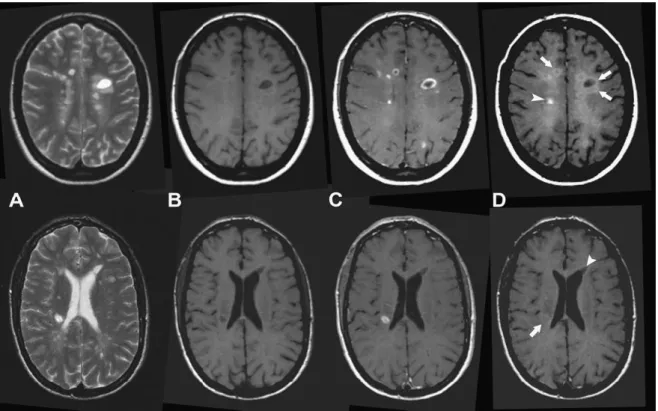
Part of the T2-w hyperintensities are also visible on T1-weighted (T1-w) as areas of low signal intensity (hypointense) compared to the normal appearing WM (NAWM) (Figure 1.4). Chronic areas of hypointensity are also known as persisting “black holes” indicating areas of more severe tissue damage visible on specific T1-w spin-echo sequence (van
21 Walderveen et al., 1998). The dynamic component of WM lesions can be assessed by injecting contrast agent before performing T1-w acquisition. The blood-brain barrier (BBB) disruption, indicated by contrast enhancement in WM lesions, is characteristic of new lesions or of the recurrence of inflammation within preexisting lesions.
Figure 1.4: Different types of MS lesions visible on T1-w images: Black holes (left) and gadolinium enhancing lesions (right)
While earlier diagnostic criteria using MRI were based on the number of T2-w hyperintensities (Filippi et al., 1994; Lee et al., 1999; Morrissey et al., 1993; O’riordan et al., 1998), revised and simplified criteria have been proposed and now focused on the location of T2-w hyperintensities (infratentorial, juxtacortical, periventricular, spinal cord) for demonstrating DIS based on the recommendations by Barkhof and colleagues, and Tintoré and colleagues (Barkhof et al., 1997; Tintoré et al., 2000). The latter recommendations to prove DIS has been included as criteria for the diagnosis of definite MS defined by a consensus of MS experts under the supervision of Ian McDonald (McDonald et al., 2001), revised in 2005 (Polman et al., 2005a), 2011 (Polman et al., 2011) and 2017 (Thompson et al., 2018). In the latest revision of the McDonald criteria (Thompson et al., 2018), DIS can de demonstrated by one or more T2-w hyperintense lesions in two or more of four areas of the CNS. Confirmation of DIT can be achieved on a single MRI with presence of enhancing and non-enhancing lesions, or otherwise by detection of additional lesions on follow-up scans.
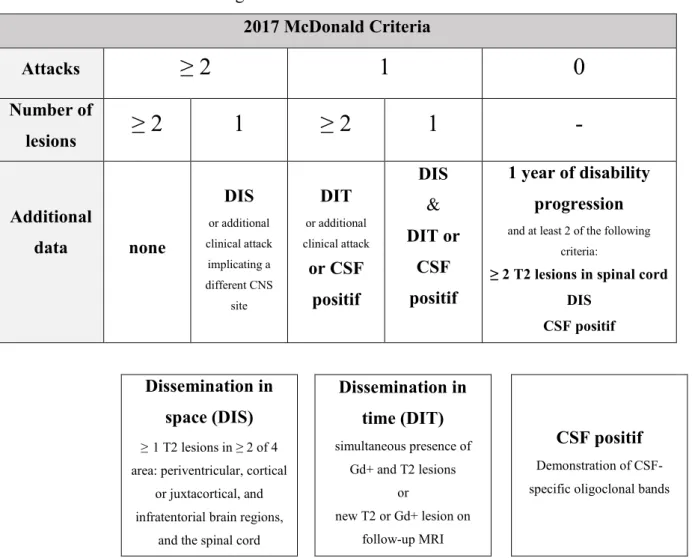
22 1.3.3 McDonald criteria for diagnosis of MS: 2017 revision
2017 McDonald Criteria Attacks
≥ 2
1
0
Number of lesions≥ 2
1
≥ 2
1
-
Additional data none DIS or additional clinical attack implicating a different CNS site DIT or additional clinical attack or CSF positif DIS & DIT or CSF positif 1 year of disability progressionand at least 2 of the following criteria:
≥ 2 T2 lesions in spinal cord DIS
CSF positif
Dissemination in space (DIS)
≥1 T2 lesions in ≥ 2 of 4 area: periventricular, cortical
or juxtacortical, and infratentorial brain regions,
and the spinal cord
Dissemination in time (DIT) simultaneous presence of Gd+ and T2 lesions or new T2 or Gd+ lesion on follow-up MRI CSF positif Demonstration of CSF-specific oligoclonal bands
Figure 1.5: The 2017 McDonald criteria for diagnosis of multiple sclerosis in patients with an attack at onset
DIS: Dissemination in space, DIT: Dissemination in time, CSF: Cerebro-spinal fluid, Gd+: Gadolinium-enhancing lesion, CNS: Central nervous system, MRI: Magnetic resonance imaging. Adapted from (Louapre, 2014)
1.4 Evolution and prognosis
1.4.1 Clinical phenotypes
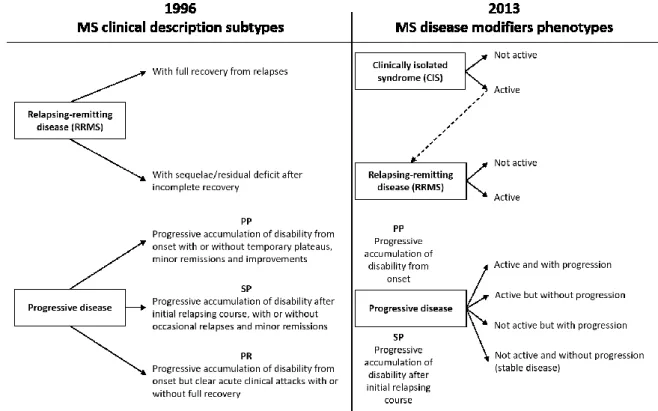
MS is characterized by different subtypes of disease, each one following a particular clinical course. The main clinical subtypes of MS were defined 30 years ago by (Lublin et al., 1996) as relapsing and progressive disease (Figure 1.6). The relapsing-remitting MS phenotype (RRMS), is characterized by “clearly defined disease relapses with full recovery or with sequelae and residual deficit upon recovery; period between disease relapses characterized by a lack of disease progression” (Figure 1.7). This subtype affects more than 85% of the patients diagnosed with MS. On the opposite end of the spectrum, 15% experience a “disease progression from onset with occasional plateaus and temporary minor improvements
23 allowed”, called primary progressive MS form (PPMS). A majority of patients diagnosed with an initial RR form do eventually progress into secondary progressive MS (SPMS). The latter has been defined as “initial RR disease course followed by progression with or without occasional relapses, minor remissions, and plateaus”.
Since then, clinical phenotypes have been reviewed in 2014 (Lublin et al., 2014) to include clinically isolated syndrome (CIS) in the spectrum of MS phenotypes. Two important modifiers have been introduced: the consideration of disease activity, and the consideration of disease progression. It is important to note that progressive form does not progress in a uniform fashion and may remain clinically stable over months and to distinguish disease progression from disability worsening, which have been used to describe worsening induced by relapses or onset of progressive phase.
Figure 1.6: The 1996 vs 2013 multiple sclerosis phenotype descriptions(Lublin et al., 2014)
Activity is determined by clinical relapses and/or MRI activity (contrast-enhancing lesions; new or unequivocally enlarging T2 lesions assessed at least annually). Adapted from (Lublin et al., 2014)
24
Figure 1.7: Graph representing the disease course of different types of multiple sclerosis.
Relapsing-remitting MS (RRMS, top left) characterize by relapses with full recovery or with sequelae, upon recovery, period between relapses characterized by a lack of disease progression. A majority of RRMS patients evolved toward a secondary progressive form of the disease (SPMS, top right), characterized by clinical exacerbations. Primary progressive MS (PPMS, bottom) evolved with a linear course with or without periods of relative stability.
1.4.2 Prognosis and prediction
It is important to understand clinical phenotypes as a dynamic process. Patient with CIS may convert to RRMS, and patients with RRMS may subsequently follow a SP course. Brownlee and colleagues followed 157 patients with CIS over 6 years: 71 (45%) had a second attack and thus developed clinically definite MS, 36 (23%) had MRI-only MS, and 50 (32%) didn’t have MS according to 2010 McDonald criteria at the end of the follow-up period (Brownlee et al., 2015). Several independent risks factors for conversion to MS have been identified: young age (Mowry et al., 2009), presence of cognitive impairment at onset (Feuillet et al., 2007), genetic factors such as HLA-DRB1 (Zhang et al., 2011), and vitamin D deficiency (Martinelli et al., 2014). One of the most significant predictors of conversion to MS from CIS is the presence of brain abnormalities on baseline MRI (O’riordan et al., 1998; Tintoré et al., 2006), with number, location and activity of the lesions all providing prognostic information. Another study confirmed the previous results (Kuhle et al., 2015). Data from 1047 CIS in 33 centres have explored clinical and biochemical variables predicting conversion from CIS to clinically definite MS. The authors concluded that MRI lesion load,
25 oligoclonal bands and age at CIS were the strongest independent predictors of conversion to clinically definite MS.
While relapses may have unforgiving consequences in rare cases, the socio-economic impact of the disease is mostly driven by the increasing disability progression that can follow the RR phase. In a longitudinal study, Scalfari and colleagues evaluated the factors affecting the rate of conversion to SPMS (Scalfari et al., 2014). They followed 806 patients annually or semi-annually for 28 years (shortest follow-up=16 years). At the end of the study, 66.3% of patients had developed a SP course. The authors demonstrated that the rate of conversion to SPMS increases proportionally to disease duration. However they highlighted the fact that individual prognosis was highly variable. About 25% of patients will become progressive within 5 years of the disease onset, while on the opposite end of the spectrum, 25% of patients will remain RRMS at 15 years. This study also confirmed previous findings suggesting that male sex (Vukusic and Confavreux, 2003) and older age of onset (Stankoff et al., 2007) were significant risk factors for conversion to SPMS.
Progression of physical disability can be assessed using the Expanded Disease Severity Scale (EDSS) (Kurtzke, 1983). This scale quantifies disability in eight functional systems. These ratings are then used in conjunction with observations and informations concerning gait and use of assistive devices to rate the EDSS from 0 (normal neurological examination) to 10 (death due to MS). In a longitudinal study, Tintoré and colleagues performed a multivariate analysis to identify and stratify which baseline demographic, clinical, radiological and biological characteristics could predict MS development and disability accumulation (Tintoré et al., 2015). Their work performed on a prospective cohort of 1015 patients with CIS highlights the importance of radiological and biological metrics to more accurately assess early risk of disability. In particular, they found that oligoclonal bands in the CSF, as well as the presence of over 10 lesions on baseline MRI were associated with a higher risk of accumulation of disability (up to EDSS= 3.0)
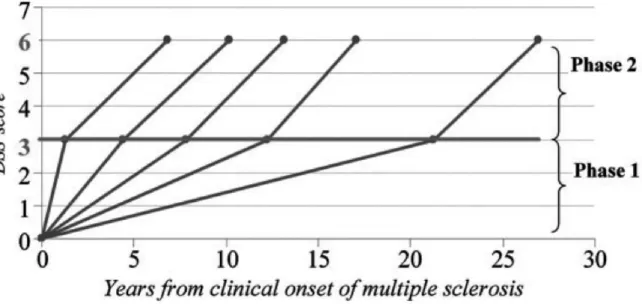
Beyond the early stages of the disease, focal MS pathology appears less relevant to disease progression. Particularly, once a threshold of disability is reached, progression may not be influenced by relapses either before or after onset of the SP phase (Confavreux et al., 2003). Leray and colleagues proposed the concept of MS as a 2-stage disease (Figure 1.8) (Leray et al., 2010). The early phase is defined from clinical onset to irreversible EDSS= 3.0 and is thought to be mainly dependent on focal damage in the WM. The second or late phase, from
26 irreversible EDSS=3.0 to irreversible EDSS=6.0, is thought to be independent of focal inflammation and may instead be underpinned by diffuse inflammatory and neurodegenerative changes. In an observational study of 2054 patients, Leray and colleagues were able to show that disability progression in the first phase of MS does not influence progression during the second phase (Leray et al., 2010). Duration of the early phase was found to be highly variable while the duration of the late phase was relatively constant. The dissociation between the 2 phases of MS, with different underlying mechanisms, is supported by MRI evidence. Calabrese and colleagues followed RRMS patients with at least 5 years of clinical history (mean>10 years) and showed that at this stage, variables such as T2 lesion volume did not influence the risk of entering the secondary progressive phase of the disease (Calabrese et al., 2013).
Figure 1.8: Duration of the 2 phases of Multiple Sclerosis
Disability progression during Phase 2 (mean time from EDSS 3 to EDSS 6) in five subgroups defined according to the duration of Phase 1 (mean time from MS clinical onset to EDSS 3) in 718 MS patients who have reached both EDSS 3 and EDSS 6. From (Leray et al., 2010)
Patient prognostication is a complex and dynamic task in MS, as different clinical, radiological and biological factors can influence outcome depending on the disease stage. This reality reflects the variety of pathological mechanisms thought to underpin disability progression in MS.
27
1.5 The clinico-radiological paradox
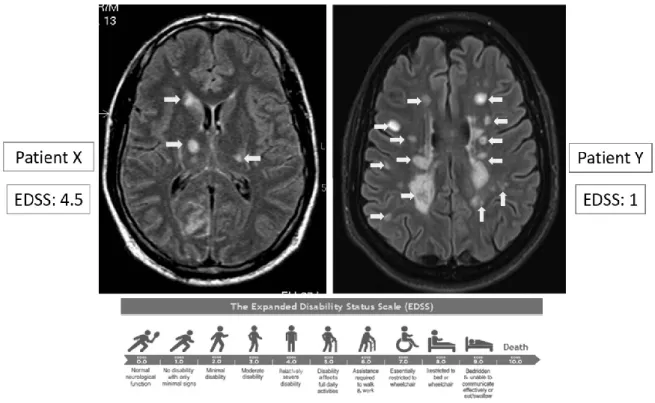
MRI has become a key tool in the diagnosis of MS, based on its ability to show WM lesions. In a clinical setting, WM lesions are easily detected using standard MRI sequences allowing an early and specific diagnosis. However, the number and volume of WM lesions fail to fully explain the extent of MS-related disability and severity of clinical progression over time (Figure 1.9), especially with regard to cognitive impairment (Barkhof, 1999; Bar-Zohar et al., 2008). The concept of a clinico-radiological dissociation has been formalized by Barkhof (Barkhof, 1999; Barkhof and Filippi, 1995), and this mismatch has been term the clinico-radiological paradox.
Figure 1.9: The clinico-radiological paradox
A large number of studies have been presented over the years looking at the correlation between T2 lesion number or volume and disability as measured by the EDSS, the most popular disability score in clinical practice. While it may be evident that patients with MS presenting new lesions are worse off than those without new lesions, the association between clinical findings and radiological extent are globally poor. In 2002, trying to solve the clinic-radiological paradox, Barkhof has raised limitations leading to this dissociation (Barkhof, 2002). Several factors contribute to the clinic-radiological paradox: i) limitations of the clinical scoring, ii) the histopathological heterogeneity of WM lesions, and iii) abnormalities not visible using standard MRI sequences.
28 The first limitation came from the EDSS itself; it is a composite score of symptoms and signs in eight functional systems, walking ability and activities of daily living, leaving a large space for intra- and inter-variability when scoring, in particular with score below 4. Moreover, this test does not assess cognitive impairment or others clinical manifestations of MS. To overcome the limitations of the EDSS, attempts to develop new scales have been done, such as the Multiple Sclerosis Functional Composite (MSFC) (Kalkers et al., 2001), which address three independent clinical domains (ambulation, upper limb function and cognition). This score has shown a better correlation with WM lesions than the EDSS (Kalkers et al., 2001). Even so MSFC has shown better results than EDSS, the latter remains the most popular disability score in clinical practice.
Another limitation came from the histopathological heterogeneity of WM lesions and the limited histopathological specificity of MRI. While WM abnormalities are easily detectable (Geurts et al., 2005a) on MRI sequences, such as T2-w (63% identified on T2-w relative to histology) or FLAIR (70% identified on FLAIR relative to histology), the pathological processes underlying these lesions can be diverse. Using standard MRI sequences, it is not possible to distinguish inflammatory lesions than chronic lesions. However, subset of WM lesions visible on T2-w are also visible on T1-w images. Without the use of contrast agent, hypointense lesions so called ‘black holes’ have been shown to reflect lesions with the greater axonal injury (van Walderveen et al., 1998). Using contrast agent such as Gadolinium, subtype of lesions appears hyperintense on T1-w because of the blood-brain barrier disruption. This transitory phase characterize the inflammatory phase of lesion development (Gaitán et al., 2011).
While T2-w image is a sensitive tool to detect WM abnormalities such as lesions, it appears that tissue presenting normal signal intensity in between WM lesions contains clear abnormalities, defining the normal appearing WM. A large number of studies have evaluated intrinsic abnormalities of the NAWM using advances MRI techniques, which appears to correlate with disability score (Filippi et al., 2017). For example, in NAWM, the MTR has shown to correlate with clinical score; however it not only correlates with myelin content but also with gliosis (Schmierer et al., 2004, 2007a), neuroinflammation and axonal damage (Moll et al., 2011), leading to a lack of specificity.
29 Another limitation raised by Barkhof (Barkhof, 2002) is the presence of cortical damage, in particular cortical lesions, which were not considered in the diagnosis of MS before the 2017 revision, and which are very difficult to measure with standard MRI sequences. Post-mortem studies have described that focal demyelinating GM lesions were hardly detected by MRI, and in particular that subpial lesions totally escaped from classical MRI: overall less than 5% are cortical lesions are detected with FLAIR at 1.5T (Geurts et al., 2005a). Moreover, such cortical damage has a strong impact on clinical parameters, from physical disability to cognitive impairment (Magliozzi et al., 2018a).
1.6 Conclusion
From the existing literature presented in this chapter, it become clear that MS is a highly heterogeneous disease as well in the disease phenotype than the disability progression. In particular, this heterogeneity illustrated the clinic-radiological paradox. This paradox has raised confounders affecting the clinical outcomes, which are not visible on conventional MRI: i) histopathological heterogeneity of T2 lesions, ii) NAWM abnormalities, and iii) cortical lesions. Post-mortem and pathological studies have described the physiopathology underlying these confounders, and will be summarized in the following chapter.
30
Chapter 2
Mechanisms involved in the pathology of
MS: WM and GM hallmarks
Chapter Outline
2.1 Introduction ... 32 2.2 White matter damage ... 32 2.2.1 Focal demyelination and inflammation 32 2.2.2 Diffuse white matter damage 36 2.3 Grey matter involvement ... 38
2.3.1 Cortical lesions 38
2.3.2 Meningeal inflammation 39
31
Figure 2.1: Multiple sclerosis pathology
This is a section from the forebrain of a patient who died with multiple sclerosis. The section is stained with luxol fast blue to reveal areas of myelination in the subcortical white matter. The green arrows indicate three areas from which the myelin stain is absent, representing three foci or plaques of chronic demyelination. The demyelinated axons in these lesions are vulnerable to atrophy. The red arrows indicate ‘shadow plaques’, in which the demyelinated axons have undergone remyelination. This section illustrates two important points: first, that remyelination can occur as a spontaneous regenerative response in the adult human brain; and second, that this process does not always occur and many lesions remain demyelinated. From (Franklin, 2002)
32
2.1 Introduction
Multiple sclerosis is traditionally seen as a chronic inflammatory and demyelinating disease of the CNS, which leads to delineated demyelinated plaques in the CNS with axonal preservation and reactive astrocytic scar formation. These basic hallmarks of the MS pathology were defined during the 19th century, starting with the macroscopic drawings of brain and spinal cord alterations by (Carswell, 1838; Cruveilhier, 1842). Following these descriptions, Charcot was the first to define MS as a focal inflammatory demyelinating disease of the white matter, and thus its principal pathological hallmarks (Charcot, 1868). For some time, the view on MS pathology centered on focal demyelinated plaques in the white matter. Later it became clear that lesions are also present in the gray matter, including the cortex, the deep GM, and the GM of the spinal cord (Brownell and Hughes, 1962). Furthermore, there is neurodegeneration, which affects the brain and spinal cord.
Since the first characterization, the general pathology of MS has been well described and the pathological hallmarks of MS include now inflammation, demyelination, remyelination, gliosis, neurodegeneration, which affect the WM and the GM both focally and diffusely (Lassmann, 2018).
2.2 White matter damage
2.2.1 Focal demyelination and inflammation
The principal hallmark of MS is the presence of focal demyelinating lesions (Figure 2.1), consisting of a loss of myelin surrounding the axon, leading to the degeneration of the axon in an extent that is variable between patients and between plaques. These lesions appear abundantly in the WM. However, the demyelination process can be reversed by the generation of a new sheath of myelin around the axon, a process termed remyelination. Lesions can be fully remyelinated or only partially with some remyelinated area.
33
Figure 2.2: Pathologic changes in different stages of active multiple sclerosis lesions In the normal-appearing white matter (NAWM) moderate microglia activation is seen, also reflected by the presence of microglia nodules. Massive microglia activation characterizes the initial stage of demyelination. In early active (EA) lesions myelin is already destroyed and macrophages contain myelin degradation products, reactive for all myelin proteins. In late active (LA) lesions minor myelin proteins are degraded in macrophages; the myelin debris still contains remnants of major myelin proteins. In this stage of the lesions new oligodendrocyte progenitor cells (OPC) appear and remyelination starts in a subset of lesions. In inactive lesion areas demyelinated axons are embedded in a dense astrocytic scar tissue. A subset of such inactive lesions may show profound remyelination (shadow plaques). From (Kutzelnigg and Lassmann, 2014)
34 Based on demyelination and cellularity infiltration, demyelinating WM lesions can be divided into four categories: active (demyelinating), chronic active, chronic inactive, and remyelinating lesions (Trapp et al., 1999; van der Valk and Groot, 2000). At the early stage of the disease, active lesions are associated with perivascular inflammation, BBB damage and microglial activation. Inflammation is a characteristic feature of both active and inactive plaques; however, the density of inflammatory infiltrates is much higher in active compared to inactive lesions, as it has been demonstrated recently on brain samples of patients with MS (Machado-Santos et al., 2018; Zrzavy et al., 2017). The inflammatory infiltrates are composed of mononuclear cells, in particular lymphocytes, macrophages and plasma cells (Frischer et al., 2009). In the recent study from Machado and colleagues, the authors described that, within a lesion, the major subpopulation of lymphocytes are activated CD8+ T-lymphocytes and B-lymphocytes, together with a lesser degree of CD4+ T-lymphocytes (Figure 2.2) (Machado-Santos et al., 2018). They found similar extent of T-lymphocytes population in other inflammatory diseases, such as acute disseminated encephalomyelitis, while inflammatory T-cells were sparse or absent in non-inflammatory disease controls and normal controls. The results of the study show that substantial inflammation by T- and B-cells is present in patients with early active (acute/relapsing) as well as progressive disease, but that the overall extent of inflammation is lower in the progressive stage compared to earliest stages. In the study performed by Zrzavy and colleagues, the authors described a higher amount of microglial activation in the normal appearing WM of patients with MS compared to healthy controls, which increased with disease duration (Zrzavy et al., 2017). They also found that early active lesions contained microglia and macrophages with pro-inflammatory phenotype, while at later stages the phenotype of these two cell changes to be intermediate between pro-inflammatory and anti-inflammatory activation. In inactive lesions, the density of microglia/macrophages was significantly reduced.
Beyond acute active lesions, chronic active lesions contained a broad rim of macrophages with myelin degradation products at the edge and macrophages with later stages of myelin degradation products in the lesion center. Without evidence of active demyelination in lesional core, chronic active lesions are termed smoldering or slowly expanding lesions showing an inactive center surrounded by a rim of macrophages and activated microglia (Brück et al., 1995; Frischer et al., 2009, 2015; Kutzelnigg and Lassmann, 2014; Kutzelnigg et al., 2005; Lassmann, 2018; Prineas et al., 2001; Stadelmann et al., 2019). In the study from Frischer and colleagues, they classified lesions from 120 post-mortem MS brain as
35 active (early or late), smoldering, inactive and shadow plaques, to investigate the distribution of lesion type among different form of MS. While active lesions are most frequent in the early stages of MS and become rare in the progressive stage, smoldering lesions show the opposite distribution in relation to MS course (Frischer et al., 2009). Smoldering plaques were frequently and almost exclusively found in progressive MS. The presence of either active or slowly expanding demyelination has been associated with younger age of death and a shorter disease duration as compared to pathologically inactive disease.
Inactive demyelinated lesions represent an end stage of lesion formation without ongoing myelin destruction and inflammation, comparable to a scar. In histological section, they are identified as demyelinated lesions with very few if any residual myelin sheaths and a sharp border to the periplaque white matter, and are characterized by reduced cellularity and axonal reduction.
Demyelination in WM lesions can be reversed by spontaneous remyelination, which might occured in early lesions simultaneously of active demyelination. In the CNS, myelin has two major function: it provides metabolic support to the axon, and allows rapid transmission of action potentials along the axon. After demyelination, these 2 functions are altered leading to axonal injury and loss. Remyelination is important, first, to restore metabolic support to the axon, limiting the axon degeneration that is responsible for progressive disability, and then to restore the structures that are required to facilitate conduction and hence function. In a recent review, Franklin and Ffrench-Constant provide an overview on remyelination and the importance of identifying remyelination drugs for its neuroprotective effect (Franklin and Ffrench-Constant, 2017). Following demyelination in the CNS, remyelination is initiated by activation of oligodendrocyte progenitor cells (OPCs). This activation enables the OPCs to divide and form new oligodendrocytes, processes termed proliferation and migration, respectively. Finally, OPCs undergo differenciation, process allowing the generation of new myelin which wraps around the axon to form the newly formed myelin sheath. Two recent studies have challenged the concept of remyelination by newly generated oligodendrocytes (Jäkel et al., 2019; Nave and Ehrenreich, 2019; Yeung et al., 2019). Using C14-based birth-dating technique of human oligodendrocytes from post-mortem samples, Yeung and colleagues found that oligodendocytes in remyelinated lesions were as old as the patient, and therefore could not have been generated from newly recruited OPCs (Yeung et al., 2019). These studies put in light the complexity of the remyelination process, and the difference between processes studied in animal model and MS brain samples.
36 Remyelination usually occurs at the lesion edge but can also concern an entire lesion. Lesions associated to a complete remyelination have been called “shadow plaques”. They mainly occur around small or medium sized vein and are characterized by a uniform reduction of the myelin sheat thickness. Other features are a moderate reduction of axonal density, the absence of macrophages containing early myelin debris, and a low number of perivascular inflammatory infiltrates (Patrikios et al., 2006). Patrikios and colleagues investigated the extent of remyelination across an heterogeneous cohort of patient with MS, by analyzing 51 autopsies of patients with different clinical courses and disease durations (5 acute MS, 7 RRMS, 18 SPMS, and 11 PPMS). The authors found that the extent of remyelination is heterogeneous among patients ranging from 0% to 25% for low remyelinators, 25% to 60% for mild remyelinators, and 60% to 96% for high remyelinators (Patrikios et al., 2006), independently of the total plaque area or the disease type (Patani et al., 2007). Moreover, this extent is also heterogeneous across the brain with a lower remyelination rate in lesions close to the ventricles, only 11% of shadow plaques over perventricular lesions compared to 39% in other plaques (Patrikios et al., 2006). The authors also demonstrated that the extent of remyelinated lesions or lesion area were associated with an older age of death and a longer disease duration (Patrikios et al., 2006), suggesting a neuroprotective role of this remyelination.
2.2.2 Diffuse white matter damage
Beside the presence of focal demyelinated plaques in the WM, the brain of patients with MS is affected by pathological changes in a more global sense. Changes in the NAWM consists of a diffuse inflammatory process associated with a diffuse activation of the microglia. In addition, there is a diffuse axonal injury throughout the whole brain, which occurs independently from demyelination (Kutzelnigg et al., 2005). In 2005, Kutzelnigg and colleagues provided a clear picture of the NAWM pathology by analyzing 52 post-mortem brain samples of patients with different clinical courses (11 acute MS, 6 RRMS, 20 SPMS, and 14 PPMS). They described a global reduction in the intensity of myelin staining due to decreased fiber density as well as diffuse axonal injury that is more significant in progressive disease compared with RRMS or patients with acute MS. The axonal injury and loss are visible by the presence of focal axonal swelling, axonal end bulbs and degenerating axons throughout the WM. Axonal degeneration affects the whole WM, with some increase around demyelinated plaques and in defined fiber tracts emerging from the WM lesions.
37
Figure 2.3: Representative types of cortical demyelinated plaques in early multiple sclerosis on immunohistochemical staining for proteolipid protein
(A) Leukocortical demyelination; (B) Subpial demyelination (arrows delineate an area of cortex with
preserved myelin); (C) Intracortical demyelination (arrows), with neurons in the demyelinated lesion (inset); and (D) Subpial and leukocortical demyelination in the same tissue section From (Lucchinetti et al., 2011)
38 Diffuse changes in NAWM also occur in presence of inflammatory infiltrates, mainly composed of CD8+ T-lymphocytes associated with profound microglial activation, which was more present in patients with progressive disease compared to RRMS (Kutzelnigg et al., 2005). An interesting result of the study from Kutzelnigg and colleagues was the absence of correlation between the focal WM lesion load and microglial activation or axonal injury in the NAWM suggesting that diffuse WM injury can develop independently from demyelinating WM lesions. Moreover, the diffuse WM injury appeared to be correlated with the extent of cortical demyelination. This founding implies that neurodegeneration in cortical plaques could have a stronger impact on WM injury than WM lesions, through anterograde degeneration, or that cortical lesions appear predominantly in area connected to WM damages, through retrograde degeneration (Calabrese et al., 2015).
2.3 Grey matter involvement
2.3.1 Cortical lesions
MS is generally considered a disease affecting the WM, although it has been demonstrated since the first pathological study that the GM, and in particular the cortex is also affected (Brownell and Hughes, 1962). Brownell and Hughes showed that about 22% of all brain lesions were located at least partly in the cerebral cortex and 4% in the deep grey matter (DGM) structures. The introduction of new techniques for myelin staining allowed more reliable investigations of GM demyelination. Neuropathologists found that demyelination within the cortex is extensive, in particular in patients with progressive disease (Bø et al., 2003a; Kutzelnigg et al., 2005). On 20 brain samples of patients with MS (3 RRMS, 10 SPMS, and 7 PPMS), Bø and colleagues described an average of 26% of cortical area that was demyelinated. Demyelination in the cortex was mainly due to purely cortical lesions: intracortical lesions account for 84% of the cortical lesions and 86% of the cortical demyelinated area (Bø et al., 2003a). Cortical demyelination may lead to four different patterns of lesion described in histopathology (Figure 2.3): i) the leukocortical lesion, which extends across both the WM and the GM (type 1), ii) the intracortical lesion, found both in cerebellar and hemispheric cortical regions, which often occurs around a blood vessel (type 2), iii) the subpial lesion, which extends inward the surface of the brain affecting the largest cortical area (type 3), and iv) lesions which extends throughout the full width of the cerebral cortex without entering the subcortical WM (type 4).
At the earliest stage of the disease, leukocortical lesions were found to be the most frequent (50%), compared to subpial (34%) or intracortical (16%) lesions, and are often active, as
39 reflected by the presence of myelin-laden macrophages (Lucchinetti et al., 2011). In the study performed by Lucchinetti and colleagues, inflammatory infiltrates were observed in all lesion types by the presence of perivascular CD3+ T-cells and CD8+ T-cells, in respectively 82% and 77% of the studied lesions (Lucchinetti et al., 2011). B-cells were observed in 27% of the cortical lesions and all of the studied lesions contained microglial activation. By contrast cortical lesions found at the latter stage of the disease are most frequently subpial and less inflammatory (Bø et al., 2003b).
As in WM lesions, spontaneous remyelination occurs in cortical lesions. It has been demonstrated that up to 75% of cortical lesions show signs of remyelination. In a recent study, Strijbis and colleagues have demonstrated that 75% of cortical lesions show subtle to substantial remyelination, ranging from 1% to 60% (Strijbis et al., 2017). The authors shown that remyelination was more extensive in cortical lesions than in WM lesions, in average 50%, with a trend toward a higher percentage of remyelination in PPMS cases compared to patients who underwent relapsing onset of MS (RRMS, SPMS). As OPCs and mature oligodendocytes are necessary for remyelination, the authors also investigated the number of these two cells in brain samples. They found more OPCs in remyelinated and nonremyelinated cortical lesions vs remyelinated and nonremyelinated WM lesions, which confirmes the higher extent of remyelination in GM than in WM. These results are in line with a previous study from Chang and colleagues, exploring the remyelination potential of cortical lesions, in particular as a specific target for new pro-remyelinating therapies (Chang et al., 2012).
2.3.2 Meningeal inflammation
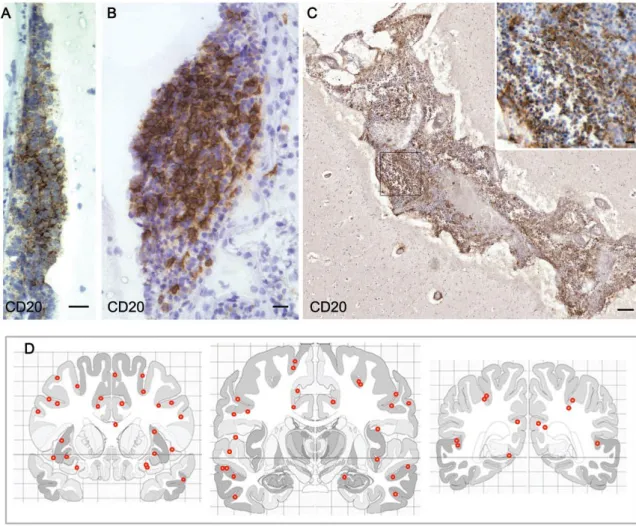
At latter stage of the disease, the lack of inflammatory infiltrates in MS cortical lesions suggested that mechanisms underlying GM and WM damages might differ. Several studies on post-mortem samples investigated the role of meningeal inflammation in causing damage in adjacent cerebral cortex (Bevan et al., 2018; Howell et al., 2011; Lucchinetti et al., 2011; Magliozzi et al., 2007, 2010, 2018b, 2018a; Serafini et al., 2004). Meningeal inflammation was characterized as ectopic B-cells follicle-like structures mainly accumulated in the deep infoldings of the cerebral sulci (Figure 2.4). These structures appear to be present exclusively in SPMS patients (Magliozzi et al., 2007). In particular, it was shown that 87% SPMS are characterized by a high level of inflammatory infiltrates, among which 40% present B-cell follicle-like structures (Howell et al., 2011). The presence of these structures was linked to
40 a higher extent of subpial demyelination (Figure 2.5), earlier age of disease and disability onset, and earlier age of death (Howell et al., 2011; Magliozzi et al., 2007).
In addition, an increased meningeal inflammation, only found in SPMS presenting B-cell follicle-like structures, was associated to a “surface-in” gradient of neuronal loss, oligodendrocytes and astrocytes loss. Those gradients from the most external cortical layers close to the CSF surface onto the most inner ones close to the WM were associated with a gradient of microglial activation (Magliozzi et al., 2010).
Figure 2.4: Follicle-like structures are variable in size and anatomical location
Aggregates of B-cells in follicle-like structures can vary greatly in overall size and cell density from relatively modest (A and B) to large and extensive aggregates filling an entire cerebral sulcus (C).
(D) Schematics represent the three coronal levels analyzed per F + SPMS case where whole coronal
sections were available (nine cases) onto which the location of the 61 separate meningeal follicle-like aggregates identified were plotted (red dots). Our analysis demonstrates that follicle-follicle-like structures are frequently associated with the deep infoldings of the cerebral sulci and are widely distributed throughout the extent of the sampled forebrain. Scale bars: (A), (B) and inset in (C) = 20mm, (C) = 200 mm. From (Howell et al., 2011)
41
Figure 2.5: Cortical demyelination, but not white matter demyelination, is significantly increased in F + SPMS
Representative myelin oligodendrocyte glycoprotein immunostained sections in which colour masks have been applied to illustrate the variable extent of white matter (blue) and grey matter (red) pathology in F- (A and C) and F+ (B and D) SPMS. (E and F) Quantitative analysis of WM lesions and GM lesions load from seven F- and nine F+ cases revealed F+ SPMS to have significantly greater area of forebrain demyelination (E) and ~6-fold greater GM lesions area in comparison to F- cases (F). (E) Mann–Whitney test, (F) ANOVA and Dunn’s multiple comparison post test. Scale bars: (A–D) = 20 mm. From (Howell et al., 2011)
42
2.4 Conclusion
In conclusion, many studies of post-mortem tissues have shown that the primary pathological features of MS are demyelination followed by an inconstant process or remyelination and inflammation. Post-mortem studies have demonstrated the clinical relevance of these two mechanisms occurring both in the WM and the GM of patients with MS. It is crucial to further assess the relationship between demyelination/remyelination and acute or persisting inflammation. Development of pathology-specific imaging techniques, in particular techniques able to assess specifically demyelination/remyelination and innate immune cell activation, are necessary to push forward our understanding of mechanisms involved in the pathology of MS. They will also prove uniquely useful to monitor individual patients in the clinical setting or in the context of clinical trials focused on anti-inflammatory or repair therapies.