• Aucun résultat trouvé

Dynamic Active Area Clustering with Inertial Information for Fingerprinting based Indoor Localization Systems

N/A
N/A
Protected

Academic year: 2021

Partager "Dynamic Active Area Clustering with Inertial Information for Fingerprinting based Indoor Localization Systems"

Copied!
10
0
0

Texte intégral

(1)

HAL Id: hal-01206384

https://hal.archives-ouvertes.fr/hal-01206384

Submitted on 23 Apr 2020

HAL is a multi-disciplinary open access

archive for the deposit and dissemination of

sci-entific research documents, whether they are

pub-lished or not. The documents may come from

teaching and research institutions in France or

abroad, or from public or private research centers.

L’archive ouverte pluridisciplinaire HAL, est

destinée au dépôt et à la diffusion de documents

scientifiques de niveau recherche, publiés ou non,

émanant des établissements d’enseignement et de

recherche français ou étrangers, des laboratoires

publics ou privés.

Dynamic Active Area Clustering with Inertial

Information for Fingerprinting based Indoor

Localization Systems

Fan Yang, Jialiang Lu, Fabrice Theoleyre, Wei Shu, Min-You Wu

To cite this version:

Fan Yang, Jialiang Lu, Fabrice Theoleyre, Wei Shu, Min-You Wu. Dynamic Active Area Clustering

with Inertial Information for Fingerprinting based Indoor Localization Systems. IFIP Networking,

May 2015, Toulouse, France. �10.1109/IFIPNetworking.2015.7145332�. �hal-01206384�

(2)

Dynamic Active Area Clustering with Inertial

Information for Fingerprinting based Indoor

Localization Systems

Fan Yang

, Jia-Liang Lu

, Fabrice Theoleyre

, Wei Shu

∗‡

and Min-You Wu

∗ ∗Dept. of Computer Science & Engineering, Shanghai Jiao Tong University, Shanghai, China

CNRS, ICUBE, University of Strasbourg, France

Dept. of Electrical & Computer Engineering, University of New Mexico, USA Email: {jialiang.lu, xcyangfan, mwu}@sjtu.edu.cn, theoleyre@unistra.fr, shu@ece.unm.edu

Abstract—Fingerprinting based localization is one of the most widely used indoor localization methods. This method is divided into two phases: during the off-line training phase, fingerprints within the area of interest are collected and stored in a fin-gerprint database; during the on-line mapping phase, the real-time location of a device is estimated by mapping itself to the most accurate fingerprint in the database. The efficiency of the mapping process is one of the key challenges of the on-line phase, and is mostly characterized by the localization accuracy and the response time. Clustering methods have been introduced to reduce computational overhead. In this paper, we propose a dynamic clustering method leveraging the inertial information of the target device. An active area is dynamically computed around the prior position. The target mapping space is significantly reduced with this active area. This method can be integrated with other clustering algorithms to overcome the edge problem and remove outliers. We evaluate this method compared with the state-of-the-art methods on a body sensor based localization system. The results show that the accuracy, precision and response time of the system are improved greatly.

I. INTRODUCTION

The rapid development of wireless communication technol-ogy and smart mobile devices has resulted in a great aware-ness on the research of localization. Indoor localization has significant importance for an increasing variety of emerging pervasive commercial, consumer and enterprise applications. While the satellite-based positioning technique (used by GPS, GLONASS, GALILEO and BEIDOU) becomes the standard for out-door civil positioning [1], indoor localization is still a battle field that various technology options such as infrared (IR), ultrasound, radio-frequency identification (RFID), wire-less local area network (WLAN), Bluetooth, sensor networks, ultra-wideband (UWB), magnetic signals, vision analysis and audible sound [2] are available for building solutions.

Each localization technology needs appropriate methods and algorithms to locate the target efficiently. Response time and accuracy are the most common performance metrics for indoor localization systems. Response time is the time consumption of a position estimation by a localization system, including signal sampling phase, collecting time, computing and matching operation time. In localization systems, the

accuracy is characterized by the average value of the Euclidean distance between the estimated results and the real location, also known as average distance error. It is important to evaluate the distribution of the error distance of a localization system. Therefore the cumulative distribution function of error distance is also used. Table I gives a classification of well-known indoor localization systems and summarizes them with their associated technologies and the performance metrics.

Generally, localization algorithms can be classified into 2 categories: signal-propagation-based and fingerprint-based systems. Fingerprinting is the widely adopted approach in Received Signal Strength (RSS) based systems. The key point of fingerprint-based localization is to accurately cover the whole area of interest. There are two phases: during the off-line training phase, fingerprints within the area of interest are collected and stored in a fingerprint database; during the on-line mapping phase, the real-time location of a device is estimated by mapping itself to the most accurate fingerprints within the database. The efficiency of the mapping process is the key challenge of the on-line phase. In [11], a graph theoretic approach using Voronoi regions is used to filter erroneous user data while organically growing a localization database as supposed to do a site survey. In [12], [13], the clustering methods which preprocess fingerprints are adopted in order to reduce the computational overhead in mapping process.

Clustering methods mentioned above are based on static analysis which is related to the stochastic properties of the off-line collected fingerprints. None of them uses real-time information in an on-line mapping phase. We introduce Dy-namic Active Area Clustering in this work to build a target area on-the-fly. The mapping will be limited within this target area, so that the data set is highly reduced. To dynamically generate the active area, the system uses inertial information collected from the target device. Although the inertial based localization [14] suffers from cumulative errors, it accurately and quickly estimates the shift distance from the previous position. This property is exploited in our solution and ensures the locality of the active area. The contribution of this work is threefold: 1) Compared with traditional clustering algorithms, our ISBN 978-3-901882-68-5 c 2015 IFIP

(3)

TABLE I

COMPARISON OFINDOORLOCALIZATIONSYSTEMS[3]

System Technology Localization Method Accuracy Precision Response Time

RADAR [3], [4] WLAN RSS Fingerprinting kNN, Viterbi-like 3−5m 90% within 5.9m ≈ 4s

50% within 2.5m

Horus [5], [6] WLAN RSS Fingerprinting with Probabilistic method 2m 90% within 2.1m ≈ 4 − 5s

WhereNet [3], [7] UHF TDOA RSS Least Square/RWGH 2−3m 50% within 3m ≈ 5s

Ubisense [8] unidirectional UWB TDOA+AOA Least Square within 0.5m 99% within 0.3m ≤ 1s

LANDMARC [9] Active RFID RSS KNN 2m 50% within 1m ≈ 8s

90% within 1.8m

Zee [10] WLAN RSS Fingerprinting with Probabilistic method ≈ 5m 50% within 1.2m Not mentioned

Inertial sensors Paritcle Filter 80% within 2.3m

method can adapt the clustering area on-the-fly. It ef-ficiently reduces the mapping space and saves computa-tional resources;

2) We not only utilize the inertial information to realize a real-time localization in short distance, but also over-come its shortage of error accumulation by combining fingerprinting based localization and Dynamic Active Area Clustering;

3) We built a wireless localization system with body and environmental sensors and implemented the proposed solution. This system demonstrates the ease of deploy-ment of such solution with great performance.

The rest of the paper is organized as follows: Section II re-views several localization and clustering methods proposed in the literature. We present our Dynamic Active Area Clustering method in Section III followed by the system implementation with body and environmental sensors in Section IV. The performance evaluation through experiments is discussed in Section V. The results show that the accuracy, precision and response time of the localization system are improved with 17%, 121% and 17% compared with affinity propagation clus-tering, and even higher compared with region-based clustering. Section VI discusses the potential of this work and future directions.

II. RELATEDWORK A. Pedestrian Dead-Reckoning

Pedestrian Dead-Reckoning (PDR) systems utilize inertial sensory data to estimate the relative instead of absolute position, which means the change from last location. These systems need very little deployment or infrastructure installed in the buildings and have a good reliability in short period. However, they may suffer from error accumulation seriously without other reference [15].

PDR systems can estimate a user’s displacement and di-rection via a variety of inertial sensors such as accelerome-ter, gyroscope, magnetometer etc. The displacement can be calculated by double integration of acceleration or detecting steps and estimating step length. The heading change is provided by single integration of gyroscope readings. Mostly magnetometers can be fused with the gyroscope signals to perform better heading estimation [16].

However, the integration of sensory data usually results in drift. For aviation and military, highly accurate sensors can keep the low-level drift and the long-term tracking. But for PDR systems, these highly accurate sensors are too expen-sive. Micro Electro-Mechanical Systems (MEMS) sensors are smaller and cheaper but the integration of MEMS inertial sensors is feasible within one or two minutes before the drift dominates [17].

There are several works that aim at reducing the drift and cope with the error accumulation. In [16], Foxlin proposed Zero Velocity Updates (ZUPTs) to counter drift by limiting integrations only in the swing phase of the foot. Since it is a such short period, the drift is controlled. An Extended Kalman Filter (EKF) is also used for modeling the accelerometer and gyroscope biases [16] [18]. To address the error accumulation, a PDR system is likely to need corrections from other local-ization methods. In [14], Hu et al. exploited the cooperative efforts of PDR and radio-based localization system. They employed an EKF to minimize the effect of drift and provide a better location estimation with real-time inertial measurements and RSSI information from environmental sensors. In [18], [19], Woodman et al. combined the Particle Filter (PF) based PDR with WiFi fingerprinting method to provide a hybrid positioning system, which aims at overcoming shortcomings of both. In [20], Frank et al. presented an indoor positioning system combining WLAN RSS fingerprinting with inertial positioning method, which employed the cascaded EKF to achieve real-time processing.

B. Fingerprinting Based Localization

Generally, there are two kinds of indoor localization systems utilizing RSS from wireless access points (APs) or other radio-frequency (RF) devices: signal-propagation based and fingerprint-based systems.

For a signal-propagation based localization system, first it builds a signal propagation model which is used to convert the RSS value to a certain propagation distance. After that, it employs localization algorithms (such as trilateration) to calculate the final position. However, building such an accurate and general signal propagation model is not an easy job as wireless channels are not always stable and lots of factors affect the propagation of wireless signal such as walls, people and objects in the room etc. Furthermore, the system needs the positions of APs which may be hard to get in practice.

(4)

Instead of building a signal propagation model to calculate the distance between the APs and the device, a fingerprint database which describes the wireless signal signature of an indoor environment is established in a fingerprinting based system. There are two phases in a fingerprinting based local-ization system: off-line training phase and on-line mapping phase.

During an off-line training phase, the RSS readings are collected at each Reference Point (RP). The set of RSS readings collected at RP j is denoted {RSSj(t), t = 1, 2...n},

where n presents the total number of the wireless APs. As the position of RP j is (xj, yj), the fingerprint of j is represented

as Fj= {(xj, yj), RSSj(t), t = 1, 2...n}.

During an on-line mapping phase, a user carries a de-vice collecting current RSS readings. The user’s position is estimated by comparing the on-line RSS readings from all APs with the off-line collections in the pre-built fingerprint database.

There are serval kinds of algorithms applied to fingerprint-ing based system. The Nearest-Neighbor (NN) and the k-Nearest-Neighbor (KNN) approaches are reference solutions in this research area [4], [9]. They use Euclidean distance to describe the dissimilarity between on-line readings and fingerprints. The Euclidean distance D between the on-line RSS readings at location l and the fingerprint of RP j is defined as follows: D = v u u t n X i=1 (RSSl(i) − RSSj(i))2 (1)

In the NN algorithm, the device is estimated at the most similar measuring point (i.e. with the minimal euclidean distance). The KNN computes the center of k closest neighbors and uses Euclidean Distance as the weight of each neighbor. These algorithms are easy to be implemented but they can not provide highly accurate estimations [4], [9].

Other approaches in fingerprinting based systems are to localize the target by statistical methods such as kernel func-tions and Bayesian theory [21], [22]. Though these methods can provide more accurate results, but they suffer from high computational overhead.

C. Clustering Techniques for fingerprinting based systems To reduce computational overhead, several approaches [12], [13] use the clustering algorithms to preprocess the refer-ence points. In such systems, once the collection of all the fingerprints is finished during an off-line training phase, the reference points will be partitioned into several clusters ac-cording to certain characteristics such as radio signal similarity (Euclidean distance), the geographic location or the strongest AP coverage area. In the on-line phase, firstly the signal samples are classified into one cluster, then the estimation will be calculated based on the elements of the cluster.

Although the clustering method could improve the system efficiency, reduce computational overhead, and shorten the response time, it still faces two following problems:

B1

B2 A

Fig. 1. Edge problem

A RP1 RP2 RP3 RP4 B2 A RP1 RP2 RP3 RP4 B1 (a) (b)

Fig. 2. Outliers problem

• Edge problem: if a user is located on the border between clusters, choosing any of them may induce inaccurate matching results. As shown in Fig. 1, the user is on the position A which is the boundary of two clusters. If A is assigned to the left cluster, the final estimation result is B1, otherwise the result is B2. However, both B1and B2

are far from the real position A.

• Outliers problem: during the on-line mapping phase, collecting outliers of RSS may cause an unreasonable clustering and decrease the accuracy. For example, there are 4 reference points distributed in the target area. A user is now located on position A. Fig. 2. (a) shows an inappropriate clustering on these points which generates a bad positioning result B1 caused by an outlier RP4. If

we can eliminate the outlier, adopting a better clustering will improve the accuracy of the system as shown in Fig. 2. (b).

1) Clustering Filtered KNN: Ma et al. [12] propose a Clus-tering Filtered KNN (CFK) method which aims at improving the precision of the KNN method by using clustering to filter out some of the neighbors. The first step of CFK is to find K neighbors, which is same as KNN. Instead of consider-ing all these neighbors to calculate the final position, CKF employs Hierarchical Clustering method to divide neighbors into several clusters, which are based on physical distance of each neighbor. However, during the on-line phase, this method only chooses one cluster of neighbors to estimate the location, which may lead to the edge problem.

2) Region-based fingerprinting: Xiao et al. [13] propose a Region-Based fingerprinting method which divides reference points into several groups and each group covers a part of the target area. In their approach, each fingerprint is a region-based group of the reference points instead of an individual reference point. They calculate the sum of Euclidean distance (SED) between the radio measurements and fingerprints in each group to determine a best matching one. The region with the minimum SED will be selected as the matched region. But it remains shortcomings that the division of the groups is done by human. If the system needs to update its fingerprint database or be deployed to another place, the partition of reference points has to be changed which is laborious and static.

(5)

3) Affinity Propagation Clustering: In our system, we adopt Affinity Propagation Clustering (APC) [23] to improve the performance of fingerprinting method. The APC algorithm divides roughly the database (and so the localization area) into several parts (called clusters). It is a process done in the off-line phase, right after the database recording. Since we collect and build 4 RSSI databases for 4 directions (i.e. north, east, south and west), we apply APC to these databases individually to generate clusters for different directions. A cluster regroups several reference points. An exemplar is the most representative RP in the cluster. At beginning of this algorithm, we need to initiate a set of exemplars which are randomly chosen and refine this set to achieve a minimal sum of squared errors. Because the initial set of exemplars is randomly generated. It will take several trials to get a good clustering unless the initial set is very close to the optimal set. On the contrary, the APC algorithm views every RP as a node in a network and considers all RPs as potential exemplars. In the APC algorithm, clusters and exemplars are generated by passing real-valued messages between each RP in the database. More details can be found in [23].

The APC algorithm is performed after recording RSSI databases for 4 directions to divide all the RPs into several groups based on similarities of pairs of RPs. However, it cannot help with the edge problem and outliers problem be-cause it only utilizes the previous radio information statically and collecting outliers is inevitable. In the next section, we propose a new clustering method utilizing inertial information to help APC deal with these two problems and achieve a better performance.

III. DYNAMICACTIVEAREACLUSTERING

Traditional clustering methods are based on static analysis which are related to the stochastic properties of off-line collected fingerprints. However the mapping occurs during the on-line phase. It is helpful to use real-time information to reduce the mapping space. Inertial information is more and more adopted for personal devices. Although inertial based lo-calization suffers from cumulative errors, it provides accurate distance shift from previous position in short time interval. Therefore we consider inertial information as reference in clustering method.

There are two kinds of possible estimated results in tradi-tional fingerprint-based indoor localization systems. For sys-tems with clustering methods, the estimated position is in one of the clusters. The clustering of Reference Points (RPs) is based on the similarities in wireless signal characteristics, physical distance or wireless access point coverage region. Most of these methods neglect the importance of user’s real-time state. Meanwhile, the radio signal changes complexly in indoor environment which increases the instability of the partition of RPs as the fingerprint database needs to be updated frequently. For systems without clustering, the result is generated among all the RPs. More uncertain factors (such as outliers) will affect the performance of the system compared with systems with clustering.

We propose a Dynamic Active Area Clustering (DAAC) method as demonstrated in Fig.3 to improve the positioning performance by taking advantages of clustering methods while solving their problems. The particle-filter-based inertial posi-tioning module not only provides high accuracy and real-time localization in short distance, but also becomes a preprocessing module for fingerprinting. When the user is moving, the system estimates his/her position by the particle-filter-based inertial module in real-time. When the user stops, the system switches to the RSSI fingerprinting localization module.

According to the user’s inertial information (orientation, steps), we set up his/her active area dynamically by the particle filter to divide all the RPs into 2 clusters: active area RPs set and inactive area RPs set. The estimated area restricts the possibilities. The fingerprinting module also pro-vides correction for the particle filter, which is different from some previous works requiring the floor map information to constrain particles or position estimation [10], [24], [25]. Coupling both sources of information increases the accuracy. All of these calculations are performed in the positioning server, so the clustering during the on-line phase wouldn’t put too much load on the mobile nodes in our solution.

Particle-Filter-based Inertial positioning module Step detection Adaptive Step Length algorithm Heading estimation RSS Fingerprinting localization module Correction Dynamic Active Area Real-time position Particle-Filter-based Inertial positioning module Step detection Adaptive Step Length algorithm Heading estimation RSS Fingerprinting localization module Correction Dynamic Active Area Real-time position

Fig. 3. Dynamic Active Area Clustering

A. The Particle Filter

The particle filter is one kind of approximate nonlinear Bayesian filters [26]. It is based on a set of weighted samples (i.e., the particles), which represent possible 2-Dimensional positions. The weight of a particle is the probability of mobile target being that position. The particle filter is iterative and each iteration has three important steps [15]:

• Prediction phase: each particle updates its position ac-cording to the motion model;

• Correction phase: the weight of each particle is up-dated based on the similarity between the new observa-tions/measurements and the motion model estimation;

• Resampling phase: in this phase, a new set of particles is generated which ensures that the particles propagate over likely positions.

B. Generation of an Active Area

As introduced above, an active area is the set of the user’s most potential positions. To generate such an area, we adopt

(6)

the particle filter and incorporate RSSI fingerprinting to ensure the existing particles with high weights.

The user’s motion status at time k is defined by a vector xk= [xk yk θk]T, where xk and ykdenote the coordinates

and θk is the orientation. The probability density function

(PDF) of user based on measurements Z0:k (inertial sensors

measurements) is denoted as p(xk|Z0:k), which is

approxi-mated by a set of N particles Sk = {s1k, ..., s N

k}. The i-th

particle has the state vector xik and wki as the weight. At the beginning (i.e. k = 0), all the particles are initialized with identical weights. The weights are normalized such that PN

i w

i

k= 1.

1) Prediction phase: During this step, all the particles propagate and update their locations according to the motion model. The step detection module and the adaptive step length algorithm [14] can provide the steps and the step length of the user. The heading angle is measured by an inertial measure-ment unit (IMU) with gyroscope. Based on these information, the particle motion status at time k can be predicted by the following equation:   xk yk θk  =   1 0 cos(θk−1) 0 0 0 1 sin(θk−1) 0 0 0 0 0 1 ∆t         xk−1 yk−1 SLk−1 θk−1 ˆ θk−1       +   ηxk−1 ηyk−1 ηθk−1  , (2)

where SLk−1denotes the (k − 1)th step length and ∆t is the

elapsed time between the (k − 1)th and the k-th step, ˆθk−1is

the average angular velocity sensed by the gyroscope during ∆t. Furthermore, ηxk−1,ηyk−1and ηθk−1 are the discrete white

zero-mean noise processes.

When the number of particles is large, the posterior discrete probability density function p(xk|Z0:k) and the expectation of

state estimation xbk|k can be approximated by the following

equations [26]: p(xk|Z0:k) = N X i=1 wki · δ(xk− xik) (3) b xk|k= E[xk|Z0:k] = Z xk·p(xk|Z0:k)dxk ≈ N X i=1 wki · xik (4)

where δ(·) is the Dirac delta function.

2) Correction phase: Due to the measurement noises from the inertial sensors, most of the particles may occasionally propagate towards wrong positions, which leads to failed estimations. Hence, the external location estimation from RSSI fingerprinting localization module should be considered to correct the weights of the particles [18], [19].

The proposal importance density q(·) can exert serious impact on the efficiency of localization. In [26], Arulampalam et al. proposed to choose the importance density to be the prior:

q(xk|xik−1, Zk) = p(xk|xik−1) (5)

with the weight of particle:

wki = wk−1i · p(Zk|xik) (6)

After updating the weights of particles, we can generate active areaby selecting particles with relatively high weights (i.e. larger than a threshold σk) and building an extremal

polygons region [27]. In this work, the threshold σk is

dy-namically chosen on the basis of the motion status: at the beginning of the system and shortly after each stop, the inertial positioning module can provide a good estimation. Thus, the σk is set relatively lower to include more particles. After a

long continuous movement, the σk is set higher in order to

filter out the particles with low possibilities.

Since the active area is the region where the user locates with high possibilities, it can be used to reduce the number of candidate reference points by choosing them only within this region. Once the RSSI fingerprinting localization module returns a position denoted Xrss, it is possible to correct the

weight of particles: p(Zk|xik) = Ae −||Xrss−Xxi k ||2 (7) where A is the weighting factor and Xxi

k denotes the

coordi-nates [xkyk]T.

3) Resampling phase: A common problem of the particle filter is the particle degeneracy, which means a large amount of computation is updating particles whose contribution to the approximation to p(xk|Z0:k) is zero. A suitable measure of

degeneracy is the the effective sample size defined as [26]:

b Nef f = 1 N P i=1 (wi k) 2 (8)

When the bNef f is lower than a threshold, it indicates severe

degeneracy and the particle filter needs to resample. We adopt the resampling algorithm proposed in [28], since it introduces a new diversity locally and adds a small noise to the particle’s position to avoid degeneracy.

Since the active area is generated by user’s inertial informa-tion instead of similarities between different RPs. Even if there exists outliers, they would not affect the clustering results. Therefore, the DAAC can deal with the outliers problem. After the clustering, the mapping operation will be only applied within the RPs inside the active area, where the user locates with high probabilities. In this way, the DAAC overcomes the edge problem.

(7)

IV. SYSTEMIMPLEMENTATION

The main contribution of this work is proposing the DAAC algorithm for fingerprinting based indoor localization systems. The DAAC algorithm can be implemented in various ways with different specific hardwares. In this work, we implement the DAAC in a prototype system with on-body inertial sensors and environmental sensors. As depicted in Fig. 4, the improved system consists of two phases:

1) Off-line phase with RSSI fingerprinting: the system has an off-line phase in which RSSI samples at specific positions within the area of interest are collected. Each RP is stored as a RSSI distributions in the database. Affinity Propagation Clustering algorithm is performed to divide all RPs into several Clusters with exemplars, which is discussed in II-C3;

2) On-line phase combining real-time RSSI distribution with inertial information: the online phase is composed of a coarse positioning and a fine positioning. The inertial data can be used for short-distance real-time positioning and as a input of DAAC algorithm, which divides the whole RSSI collection into active area RPs and inactive area RPs collection. The fine positioning takes only the active area RPs into account.

Recording Reference Points RSSI values for 4

directions Building Reference Points databases for 4 directions Processing Affinity Propagation Clustering algorithm Offline phase Online phase Final position Clusters Matching algorithm Dynamic Active Area Clustering algorithm Kernel regression and Kullback-Leibler divergence algorithms Inertial data

Coarse positioning Fine positioning

Current RSSI distribution

Inertial Positioning Module

Fig. 4. System Block Diagram

A. RSSI fingerprinting module

We use IRIS sensor nodes [29] instead of WLAN or WiFi access points to implement this module based on the following reasons: firstly, we plan to build an indoor localization system with low power consumption on-body sensors, hence the IRIS nodes are more suitable. Besides, the IRIS nodes are programable and can be deployed quickly.

There are 8 environmental IRIS sensor nodes deployed on the edge of the target area. During the off-line training phase, the user is tied an IRIS node which is broadcasting packets on his chest. The frequency of it is 50 Hz. When the environmental IRIS sensors receive broadcasting packets, they will calculate the RSSI values of them and send the values to

the sink node which connects to the positioning server directly through a serial port. It is better to let the IRIS node tied on the user instead of the environmental nodes broadcast packets due to the memory and energy constraints of the sensor node. The environmental nodes will lose their energy in a short time if they are continuously broadcasting. In our solution, the environmental nodes do not transmit unless they receive the broadcasting packets.

A RSSI sample contains 8 RSSI values from all the en-vironmental IRIS sensors. We collect 40 RSSI samples at 4 directions (north, east, south and west) of each RP to establish a RSSI distribution for environmental IRIS sensors and build 4 RSSI databases for each direction. After that, the APC algorithm divides each of them into several clusters of RPs. Each cluster is affected with one exemplar.

During the on-line phase, the system switches between the inertial positioning module and RSSI fingerprinting module according to the user’s real-time motion status. If the user is moving within a short distance (i.e. small number of stpes), the system utilizes the inertial data directly to perform a dead-reckoning positioning. Otherwise, the system will first perform the coarse positioning with the DAAC and clusters matching. Then the position is estimated within the active area by Kernel regression as discussed in IV-C2.

B. Inertial positioning module

This module is based on gyroscopes and accelerators which supply the orientation information and acceleration values used to infer the person’s orientation and steps. We de-signed a inertial sensor node based on a Razor Wireless Inertial Measurement Unit (WIMU) sensor [30]. We select Razor WIMU because it incorporates three sensors: ITG-3200 (MEMS triple-axis gyro), ADXL345 (triple-axis acceler-ator), and HMC5883L (triple-axis magnetometer) to give nine degrees of inertial measurement. For sending those inertial information, we also connect a XBee adapter with a XBee 2 RF module with it. Both of them are supplied with a rechargeable 900 mAh lithium battery. All of these modules are placed in a 6cm×4cm×1.5cm plastic box. Two inertial sensor nodes fixed on ankles are used to detect steps, while the inertial sensor node tied on the shoulder is used for orientation estimation. In order to reduce the sliding friction between the clothes and the body, we use tapes to secure the sensor nodes. By installing an XBee chip and an Ethernet adapter on an Arduino Mega board, inertial data can be transmitted to the Arduino Mega board in wireless and forwarded to the positioning server through the Ethernet.

C. Coarse and fine positioning

The localization process works in two parts. During the coarse localization, the system selects a part of the area (the database) where the target locates. In the fine localization it runs more accurate algorithms consuming memory and computation time. Hence, we first need to reduce the size of potential RPs.

(8)

1) Clusters Matching combined with DAAC algorithm: Given the RSSI readings from the current position of the target and the orientation information, the clusters matching (CM) algorithm selects a part of clusters computed previously. The CM algorithm will compute the pairwise similarity values between the RSSI readings and the exemplars RSSI values and select the exemplars which are the closest to the current position of the target. Once the exemplars are determined, the system selects the corresponding clusters.

Given the user’s inertial data, the DAAC algorithm com-putes an active area where the target may locate. The results of the CM and the DAAC algorithm are then compared. If they share some RPs, the system chooses intersection elements as the final clustering result. Otherwise, the system keeps only the DAAC results since DAAC can overcome the edge problem and the outliers problem.

2) Probability kernel based mapping algorithm: During the on-line mapping phase, the position is estimated by the method that takes the full RSSI distribution into account for computing similarities among fingerprints in the final clustering result using Kullback-Leibler divergence (KLD). Then the system performs localization through kernel regression similar to [21]. In information theory, the KLD is a non-symmetric measure of the difference between two probability distributions. In the discrete case, where the random variable RSSI takes discrete values, for RSSI distribution at RP j and k, we have: KL(Dj||Dk) = Prss(Dj(rss) log(Dj(rss)/Dk(rss))). The

symmetrized KLD between Djand Dk can be simply defined

as:

KLD(Dj, Dk) = KL(Dj||Dk) + KL(Dk||Dj). (9)

A kernel function k(Dj, Dk) is a symmetric function to

calculate the dissimilarity of the two distribution which is equal to one if Dj = Dk and decaying to zero as the

dissimilarity increases. Follow [31], and for a data-dependent range of values α, A kernel function can be defined as follows: k(Dj, Dk) = e−αP KLD(Dj,Dk) (10)

Using DAAC we obtain a set of RPs {F , l ∈ F }. We per-form the Weighted Kernel Regression to estimate the location using on-line sampled RSSI distribution Dj :

(xj, yj) = P l(xl, xl)k(Dj, Dl) P lk(Dj, Dl) (11)

V. EXPERIMENTS ANDEVALUATION

In this section, we introduce our experiment environment and evaluate the performance of the DAAC method with some previous works. All of the solutions are implemented on the same devices in the experiments.

A. Experiment set-up

We deploy our system in an indoor environment which is 18m long and 3m wide as shown in Fig. 5. The experiments are operated under real scenarios (i.e. other people may walk through this area during the experiments) to demonstrate the validity of our approach. We perform our experiments with

IRIS node Sink node

Arduino mega WIMU

Fig. 5. Experiment equipments and target area

different numbers of RPs from 10 to 40. For 10,20,30,40 RPs, the average distance between 2 RPs is 2.42m, 1.53m, 1.43m and 1.34m respectively. To evaluate the performance of DAAC, we do experiments under different number of steps from 2 to 10 steps.

As discussed in I, the efficiency of localization systems consists of:

1) the accuracy is measured as the average distance from the estimated position to the real position on all tested points;

2) the precision is measured as the cumulative distribution function of the error distance on all points. The precision being 90% within 3.4 m means that 90% of test points fall into a distance error smaller than 3.4 m;

3) the response time is recorded from the moment that a new query occurs to present the final result on the screen. So it includes the time for collecting enough samples, clustering, computing, matching operation and displaying the final estimated position.

We also explore the effect of number of steps on the performance of the DAAC. Two metrics are considered in the experiments: correct cluster matching rate and average cluster size. The first metric means the rate of correctly choosing a cluster in which the user is located. It has an impact on the maximum error distance of a positioning system. Because the main reason for the maximum error distance is choosing a wrong cluster. The average cluster size also affects the performance of localization because the clustering method constrains the error distance within the size of one cluster. B. Experiment Results

The DAAC is evaluated with the Region-Based Clustering (RBC) [13], APC and a raw fingerprinting mapping algorithm without clustering. Identical parameters are used in all exper-iments.

Fig. 6 shows the average accuracy of the localization system using RBC, APC, DAAC, APC combined with DAAC, and without clustering is 6.16 m, 5.34 m, 4.58 m, 4.21 m and

(9)

10 15 20 25 30 35 40 0 2 4 6 8 10 12 A v e r a g e E r r o r D i s t a n c e ( m )

Number of Reference Points Without Clustering

DAAC+APC

DAAC

RBC

APC

Fig. 6. Average Accuracy

0 2 4 6 8 10 12 0% 20% 40% 60% 80% 100% P r o b a b i l i t y Error Distance(m) Without Clustering DAAC+APC DAAC RBC APC

Fig. 7. Error Distance CDF

10 15 20 25 30 35 40 1.0 1.5 2.0 2.5 3.0 3.5 4.0 4.5 5.0 5.5 6.0 R e s p o n s e T i m e ( s )

Number of Reference Points Without Clustering

DAAC+APC

DAAC

RBC

APC

Fig. 8. Average response time

8.29 m. Stated otherwise, the average accuracy of system using DAAC is improved by 17%, 34% and 81% compared with APC, RBC and without clustering respectively. It is easy to understand that clustering methods constrain the maximum error distance within the scale of one cluster. Moreover, the APC combined with DAAC method achieves the highest average accuracy, which indicates that DAAC can help to improve other clustering methods.

With increasing number of RPs, all clustering methods achieve better accuracy due to the decrease of average distance between 2 RPs. The reason why the performance of DAAC is better than RBC and APC under every different numbers of RPs is that DAAC has a self-adapted cluster size according to the movement of the target. The clusters formed in DAAC are based on the active area which is the user’s most potential position set and ensures the accuracy. Compared with static clustering such as RBC and APC, DAAC is more efficient in term of mapping space reduction in an indoor environment.

Fig. 7 is the error distance CDF plot for different techniques. We can deduce from this figure that the precision of system using DAAC is 90% within 2.4 m, while the precision using RBC , APC and without clustering are 90% within 5.7 m, 5.3 m, and 9.5 m respectively. In another word, the precision of system using DAAC technique is improved by 121%, 138% and 332% compared with APC, RBC and without clustering respectively. Since the APC combined DAAC method chooses the intersection elements of these two methods, it achieves a better precision and robustness. It also demonstrates the high relevancy of inertial information on the localization.

Fig. 8 shows the average response time for different tech-niques. The system without using clustering takes more time to locate the user due to no preprocessing on the RPs. The av-erage response time increases in a linear way according to the number of RPs. The average response time for DAAC, RBC, APC and without clustering is 2.53 s, 3.45 s, 2.96 s and 4.19 s. Stated otherwise, the average response time of system using DAAC is improved by 17%, 37% and 67% compared with APC, RBC and without clustering respectively. The time for collecting samples and the mapping algorithm are the same in these three methods. The decrease of response time indicates the clustering methods can reduce the computational overhead of the mapping process. The size of each cluster in RBC

and APC is bigger than that in DAAC (as shown in Fig.10), which means the system needs to process more RPs. That also explains DAAC outperforms the other two methods in term of response time with even better accuracy and precision (as shown in Fig. 6 and Fig. 7). The APC combined DAAC method spends more time than APC when the number of PRs is relatively small (i.e. 10 and 20). Because it takes more operations to perform DAAC and get the intersection elements. When the databases become larger, the time of processing the on-line RSSI collections dominates the response time. Hence, the APC combined DAAC method spends less time than APC with the help of DAAC in reducing the number of potential RPs. 1 2 3 4 5 6 7 8 9 10 40% 50% 60% 70% 80% 90% 100% C o r r e c t C l u s t e r M a t c h i n g R a t e Number of Steps DAAC APC RBC

Fig. 9. Correct Cluster Matching Rate

The correct cluster matching rate is shown in Fig.9. We can see the average rate of DAAC is about 93%, which is higher than the rate of APC and RBC under different number of steps. It is because the DAAC method utilizes the current and previous inertial information to ensure the user is standing within the potential area. However, the other two methods only rely on the statistical analysis of the RSSI variation, which is affected by many factors. The DAAC method maintains higher rate under different steps which also shows its good robustness. The average cluster size is shown in Fig.10. With the growing number of steps, the cluster size of DAAC also increases. However, the step number does not impact on the cluster size of APC or RBC greatly. This is because the Active Area is growing with increasing number of steps, which will

(10)

1 2 3 4 5 6 7 8 9 10 0 2 4 6 8 10 12 14 16 18 20 22 C l u s t e r S i z e Number of Steps DAAC APC RBC

Fig. 10. Average Cluster Size

cover more and more RPs.

VI. CONCLUSION

A new clustering algorithm exploring inertial information, Dynamic Active Area Clustering, was proposed for fingerprint-ing based indoor localization in this paper. Compared with previous works, our solution can set up clusters of RPs in real-time to reduce computational overhead by utilizing user’s inertial information in mapping process. We implemented it in our body sensor platform. Performance of DAAC was evaluated through experiments and compared with Region-Based Clustering and a raw fingerprinting system without clustering. It was shown that DAAC can improve significantly the accuracy, precision and response time of the localization system. Our implementation is also portable and easy to deploy for providing localization information to other applications. One of target applications is interactive stage performance that is under development with Shanghai Conservatory of Music.

ACKNOWLEDGEMENTS

This research was supported partially by NSF of China under grant No. 61100210, STCSM Project No. 13511507800, Doctoral Program Foundation of Institutions of Higher Educa-tion under grant No. 20110073120021, by the French NaEduca-tional Research Agency (ANR) project IRIS under contract ANR-11-INFR-016.

REFERENCES

[1] J. Thurston. GALILEO, GLONASS And NAVSTAR A Report on GPS for GIS People. In GISCafe.com, 2002.

[2] Y. Gu, A. Lo, and I. Niemegeers. A Survey of Indoor Positioning Systems for Wireless Personal Networks. IEEE Communications Surveys & Tutorials, 11(1):13–32, Mar. 2009.

[3] H. Liu, H. Darabi, P. Banerjee, and J. Liu. Survey of wireless indoor positioning techniques and systems. IEEE Transactions on Systems, Man, and Cybernetics, Part C: Applications and Reviews,, 37(6):1067– 1080, 2007.

[4] P. Bahl and V. Padmanabhan. RADAR: an In-building RF-based User Location and Tracking System. IEEE INFOCOM,Tel Aviv, Israel, 2:775– 784, Mar. 2000.

[5] M.A. Youssef, A. Agrawala, and A. Udaya Shankar. Wlan location determination via clustering and probability distributions. In IEEE PerCom 2003, pages 143–150, 2003.

[6] M. Youssef and A. Agrawala. Handling samples correlation in the horus system. In IEEE INFOCOM 2004., volume 2, pages 1023–1031 vol.2, 2004.

[7] WhereNet : http://www.zebra.com/. [8] Ubisubisense : http://www.ubisense.net/.

[9] L.M. Ni, Y. Liu, Y. C. Lau, and A.P. Patil. Landmarc: indoor location sensing using active rfid. In IEEE PerCom 2003, pages 407–415, 2003. [10] A. Rai, K. K. Chintalapudi, V.N. Padmanabhan, and R. Sen. Zee: Zero-effort crowdsourcing for indoor localization. In Proceedings of the 18th Annual International Conference on Mobile Computing and Networking, Mobicom ’12, pages 293–304, New York, NY, USA, 2012. ACM. [11] J. Park, B. Charrow, D. Curtis, J. Battat, E. Minkov, J. Hicks, S. Teller,

and J. Ledlie. Growing an organic indoor location system. Proc. of the 8th international conference on Mobile systems, applications, and services, Califonia, U.S.A, pages 271–284, June 2010.

[12] J. Ma, X. Li, X. Tao, and J. Lu. Cluster filtered KNN: A WLAN-based indoor positioning scheme. In WoWMoM, Newport Beach, U.S.A, pages 1–8. IEEE, 2008.

[13] W. Xiao, W. Ni, and Y. K. Toh. Integrated wi-fi fingerprinting and inertial sensing for indoor positioning. In IPIN, pages 1–6, 2011. [14] W.Y. Hu, J. Lu, S. Jiang, W. Shu, and M.Y. Wu. WiBEST: A hybrid

personal indoor positioning. Proc. of IEEE Wireless Communications and Networking Conference (WCNC), Shanghai, China, pages 2149 – 2154, 2013.

[15] R. Harle. A survey of indoor inertial positioning systems for pedestrians. Communications Surveys Tutorials, IEEE, 15(3):1281–1293, Third 2013. [16] E. Foxlin. Pedestrian tracking with shoe-mounted inertial sensors. IEEE

Comput. Graph. Appl., 25(6):38–46, November 2005.

[17] O. J. Woodman. An introduction to inertial navigation. Technical Report UCAM-CL-TR-696, University of Cambridge, Computer Laboratory, August 2007.

[18] O. Woodman and R. Harle. Pedestrian localisation for indoor envi-ronments. In Proceedings of the 10th International Conference on Ubiquitous Computing, UbiComp ’08, pages 114–123, New York, NY, USA, 2008. ACM.

[19] O. Woodman and R. Harle. Rf-based initialisation for inertial pedestrian tracking. In Pervasive Computing, pages 238–255. Springer, 2009. [20] K. Frank, B. Krach, N. Catterall, and P. Robertson. Development and

evaluation of a combined wlan & inertial indoor pedestrian positioning system. In ION GNSS, 2009.

[21] P. Mirowski, H. Steck, P. Whiting, R. Palaniappan, M. MacDonald, and Ho T.K. KL-Divergence kernel regression for non-Gaussian fingerprint based localization. International Conference on Indoor Positioning and Indoor Navigation, Guimaraes, Porgutal, pages 1–10, September 2011. [22] R. Singh, L. Macchi, C. S Regazzoni, and K. N. Plataniotis. A statistical modelling based location determination method using fusion technique in wlan. Proc. IEEE IWWAN, 2005.

[23] B. J. Frey and D. Dueck. Clustering by passing messages between data points. science, 315(5814):972–976, 2007.

[24] C. Wu, Z. Yang, Y. Liu, and W. Xi. Will: Wireless indoor localization without site survey. Parallel and Distributed Systems, IEEE Transactions on, 24(4):839–848, 2013.

[25] Y. Liu, M. Dashti, and J. Zhang. Indoor localization on mobile phone platforms using embedded inertial sensors. In Positioning Navigation and Communication (WPNC), 2013 10th Workshop on, pages 1–5, March 2013.

[26] M.S. Arulampalam, S. Maskell, N. Gordon, and T. Clapp. A tutorial on particle filters for online nonlinear/non-gaussian bayesian tracking. Signal Processing, IEEE Transactions on, 50(2):174–188, Feb 2002. [27] James E. Boyce, David P. Dobkin, and Leo I Guibas. Finding extremal

polygons. In Proc. 14th Annual ACM Symp. on Theory of comput, pages 282–289, 1982.

[28] Christian Musso, Nadia Oudjane, and Franois Le Gland. Improving Regularized Particle Filters. 2001.

[29] IRIS mote : http://www.memsic.com/wireless-sensor-networks/. [30] Sparkfun 9 dof razor imu: http://www.sparkfun.com.

[31] P.J. Moreno, P.P. Ho, and N. Vasconcelos. A kullback-leibler divergence based kernel for svm classification in multimedia applications. In Advances in neural information processing systems, 2003.

Figure

Fig. 1. Edge problem
Fig. 3. Dynamic Active Area Clustering
Fig. 4. System Block Diagram
Fig. 5. Experiment equipments and target area
+3

Références

Documents relatifs

When the number of students is large, an optimal static 6-clustering will isolate four groups and split one in two halves in every snapshots ; whereas the optimal dynamic

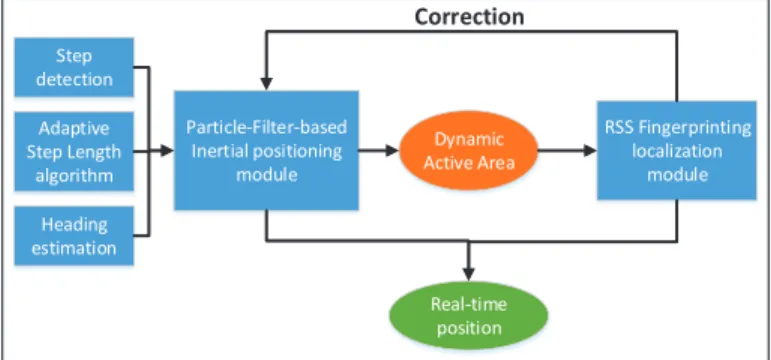
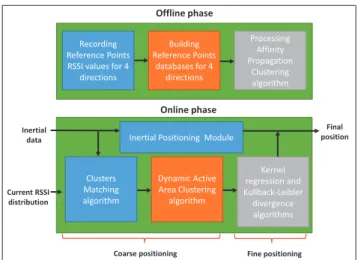
In the online phase, when getting a RSSI measurement with an unknown location at an unknown floor, we use a complete parallel network to determine the floor and then to estimate

The method converts environmental ultrasounds into spectrograms and builds a non- linear regression model based on the spectrograms using a convolutional neural network to

In this paper, a proposal which couples a dynamic clustering method with an on-line trend extraction algorithm that works incrementally on the incoming data is presented.. The

between samples (to cluster) or between samples and clusters so that samples/clusters are gathered according to increasing distance order. Besides, in the perspective of

We first sum- marize related work, and then we give a brief domain-independent overview of compression- based clustering: the ideal distance metric based on Kolmogorov complexity

Abstract – This paper presents a new Time-frequency interleaving in a Multi-code Multicarrier CDMA MCMC-CDMA system, which allows two-dimensional spreading in both time and

Celui-ci doit permettre plusieurs traitements et parmi ceux-ci, on peut citer: - la création d’images, - la capture d’images directement à partir d’un scanner ou d’une autre