Publisher’s version / Version de l'éditeur:
Vous avez des questions? Nous pouvons vous aider. Pour communiquer directement avec un auteur, consultez la première page de la revue dans laquelle son article a été publié afin de trouver ses coordonnées. Si vous n’arrivez pas à les repérer, communiquez avec nous à PublicationsArchive-ArchivesPublications@nrc-cnrc.gc.ca.
Questions? Contact the NRC Publications Archive team at
PublicationsArchive-ArchivesPublications@nrc-cnrc.gc.ca. If you wish to email the authors directly, please see the first page of the publication for their contact information.
https://publications-cnrc.canada.ca/fra/droits
L’accès à ce site Web et l’utilisation de son contenu sont assujettis aux conditions présentées dans le site LISEZ CES CONDITIONS ATTENTIVEMENT AVANT D’UTILISER CE SITE WEB.
Internal Report (National Research Council of Canada. Institute for Research in Construction), 1988
READ THESE TERMS AND CONDITIONS CAREFULLY BEFORE USING THIS WEBSITE. https://nrc-publications.canada.ca/eng/copyright
NRC Publications Archive Record / Notice des Archives des publications du CNRC :
https://nrc-publications.canada.ca/eng/view/object/?id=a3022e4e-99a1-4812-8406-6b572006b75d https://publications-cnrc.canada.ca/fra/voir/objet/?id=a3022e4e-99a1-4812-8406-6b572006b75d
NRC Publications Archive
Archives des publications du CNRC
For the publisher’s version, please access the DOI link below./ Pour consulter la version de l’éditeur, utilisez le lien DOI ci-dessous.
https://doi.org/10.4224/20358588
Access and use of this website and the material on it are subject to the Terms and Conditions set forth at Fire Resistance of Circular Hollow Steel Columns Filled with Silicious Aggregate Concrete: Test Results
Ref
I
Ser I ITH1 atlonal Research Consell national R427 lounCil Canada
n. 570
1
de recherches Canada- -- Institute for lnstitut de
I Research in recherche en
I Construction construction
I
!RC PUB
,
Flre Reslstance of Circular Hollow Steel
Columns
Fllled with Silicious Aggregate
Concrete: Test Results
T.T.
Lie and S.E. CaronInternal Report No. 570
ANALYZED
Date of issue: August 1988
NRC
-
CISTF L I B R A R Yx f ~
28 1 % : ~ B I B L I O T H S Q U E CNnC-
ICIST--
Thls Is an internal report of the Institute for Research in Construction. Although
not Intended for general distribution, it may be cited as a reference in other publlcatlons.
INTRODUCTION
Studies on the fire resistance of concrete-filled hollow steel columns were started a few years ago at the National Research Council of Canada. Filling of hollow steel columns with concrete has several benefits. One of the main benefits is a substantial increase in the load bearing capacity of the column due to the concrete filling. In addition a high fire resistance can be obtained without the necessity of protection of the steel. Another benefit is that the tubular form of the steel eliminates the need for framework.
These benefits have stimulated research into the structural and fire resistance performance of concrete-filled hollow steel sections. At present considerable research in this area is being undertaken in a number of laboratories in the world.
A series of fire resistance tests on concrete-filled steel columns, carried out at the Institute for Research in Construction (IRC) of the National Research Council of Canada, has now been completed. In this report are described the results of the tests on circular hollow steel columns filled with silicious aggregate concrete.
PROGRAM
The Institute for Research in Construction (IRC) has worked out a multi-phase program for the study of the behaviour of full sized concrete filled steel columns exposed to fire. The study variables in the program include the following:
a) area of cross-section b) steel shell thickness C) shape of cross-section
d) percentage of longitudinal reinforcing steel
e) concrete mixture (influence of aggregate type, of additives and of steel fibre reinforcement)
f) concrete strength g) end conditions h) load intensity
i) eccentricity of loading
The studied effects include:
a) column temperatures b) column deflections c) time to failure
The program will contribute to the development of mathematical models capable of predicting the fire resistance of concrete-filled hollow structural members [I].
This report deals with the First phase of the program, which involved the testing of thirteen specimens. The columns were designed and manufactured in the Fire Research Section of IRC in Ottawa. The variables studied in the first phase of the program were:
a) steel shell thickness b) area of cross section c) load intensity
A general description of the specimens and the test conditions followed by an in-depth description of each test including study parameters, type of failure, numerical results, drawings and photographs of the specimens are given in this report.
1 GENERAL DESCRIPTION OF SPECIMENS AND TESTS 1.1 TEST SPECIMENS
-
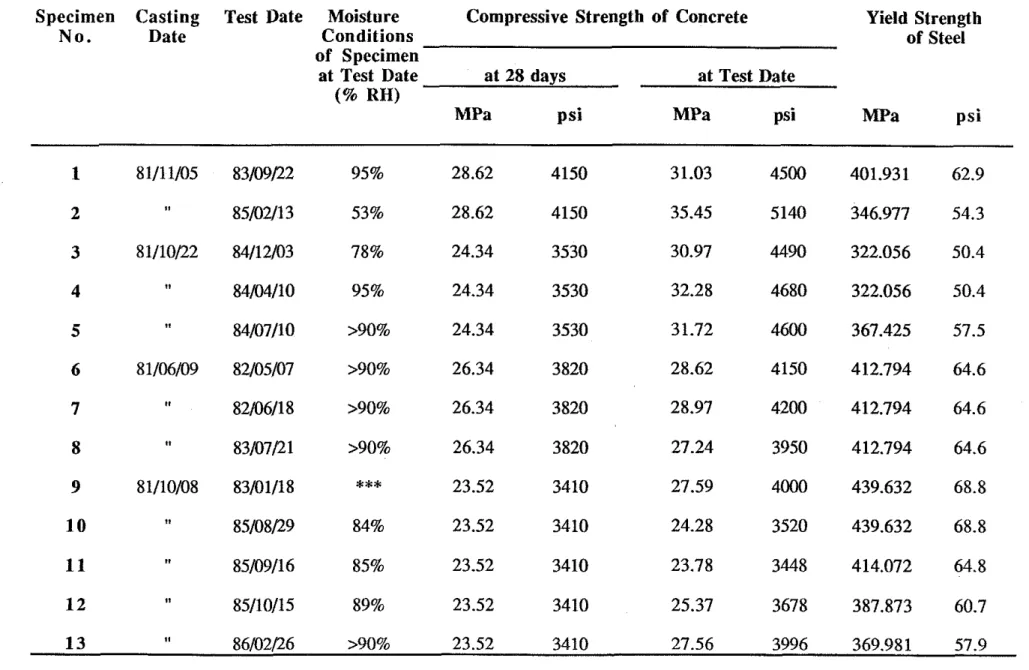
PROPERTIESIn the first phase of this program a series of thirteen concrete filled steel columns were fabricated and tested. The variables under study for their impact on fire resistance were: the section diameter, the steel thickness and the load intensity. Details concerning the first phase specimens are listed in Table 1.1.
1.1.1 Dimensions
All columns were 3810 m m (12 ft 6 in.) long from end plate to end plate. All columns were of circular cross-section. Their outer diameter ranged from 141.0 mrn
(5.56 in.) to 406.4 mm (16.00 in.), while their wall thickness varied from 4.8 mm (0.26 in.) to 12.7 mm (0.50 in.). Dimensions for each column are listed in Table 1.3.
1.1.2 Materials
i. Steel:
The hollow structural sections (HSS) consisted of steel meeting the requirements of CSA Standard G 40.21-M [2], Class H, and had a specified strength of 350 MPa. Individual yield strength and ultimate strengths for each column section are listed in Table 1.1. The sections were supplied by S telco Inc.
The end plates were constructed using mild steel.
ii. Cement:
Type I Cement, a general purpose cement for construction of concrete structures, was used.
iii. Aggregate:
Four pours were made with somewhat similar fine and coarse aggregate distributions. The aggregates were of near homogeneous silicious composition. Rose quartz from Nonhbrook, Ontario was used as coarse aggregate. The fine aggregate was silicious sand supplied by Indusrnin Ltd. from St Canut, Quebec. The maximum size of the aggregate was 19 mm (314 in.). Sieve analyses were conducted. Gradation curves for the two aggregates are shown in Fig. 1.1.
1.1.3 Concrete Mix
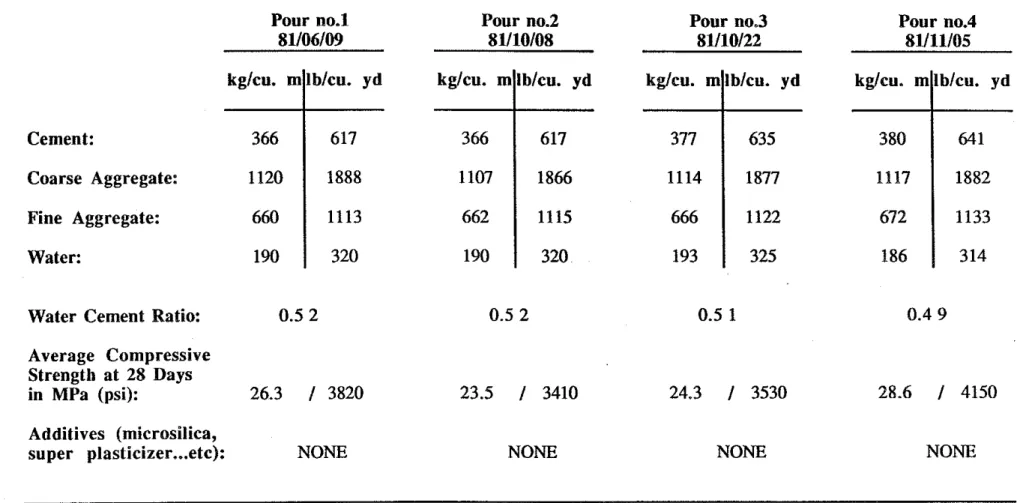
Four somewhat similar concrete mixes were poured for this series of tests. The concrete was non-air-entrained and no additives (micro silica, super plasticizer, etc.) were included in the mix in this phase. An average water cement ratio of 0.51 was used. Batch quantities of concrete are given in Table 1.2.
1.1.4 Fabrication
i. Steel Column:
The hollow steel sections were fabricated by cutting the supplied sections to appropriate lengths. Steel end plates were then welded at the section extremities. Accurate centering and perpendicularity of the end plates was given special attention. Plate thickness and dimensions varied for each pipe cross-section. The components of the column were cut to length so that their length was 3810 (12 ft 6 in.) including the plate thickness. Before assembly, a hole with a diameter approximately 2-54 mm (1 in.) smaller than the inner diameter of the hollow steel section was cut in each plate. The smaller diameter of the holes created, after assembly, a lip of 13.0 mm (112 in.), as shown in Fig. 1.4.A.
Five small holes were also drilled in the section wall. Two pairs, 13 mm (112 in.) in diameter, located 1448 mm (57 in.) above and below mid-height, were provided as vent holes for the water vapour pressure produced during the experiment. The fifth, 1829 mm (72 in.) above mid-height, was used to bring in the thermocouple wires (see Fig. 1.4).
Using the gas metal welding process, the hollow steel sections and end plates were first joined by a groove weld. Secondly, a fillet weld was added around the outside diameter of the pipe. AWS 5.18 Type E705-6 welding rods were used on both welds.
ii. Concrete Placement:
Concrete was mixed in a ruck mixer. A large funnel was used to deposit the concrete in the steel column. An internal vibrator was carefully applied to consolidate the concrete. The top surface of the column was screeded and finished with a small trowel. To avoid possible moisture leaks, the section was sealed at both ends with a plastic sheet and tape.
Columns were then left at room temperature with no particular curing measures being taken.
iii. Thermocouples:
Butt-welded chromel-alumel thermocouples with a thickness of 0.91 mm (20 ga.) were used to make thermocouple trees for measuring concrete temperatures at several locations in the mid-height cross-section of the columns. Each frame consisted of a number of thermocouples tied to steel rods that was secured to a bar running along the longitudinal axis of the column. The bar was fixed at both ends of the column (see Fig. 1.5).
Temperatures were recorded across the mid-height section at several locations along a single axis. In addition, a thermocouple was also mounted at mid-height into the steel wall of the column (see Fig. 1.6 and Fig. 1.7).
1.2 TEST
APPARATUS
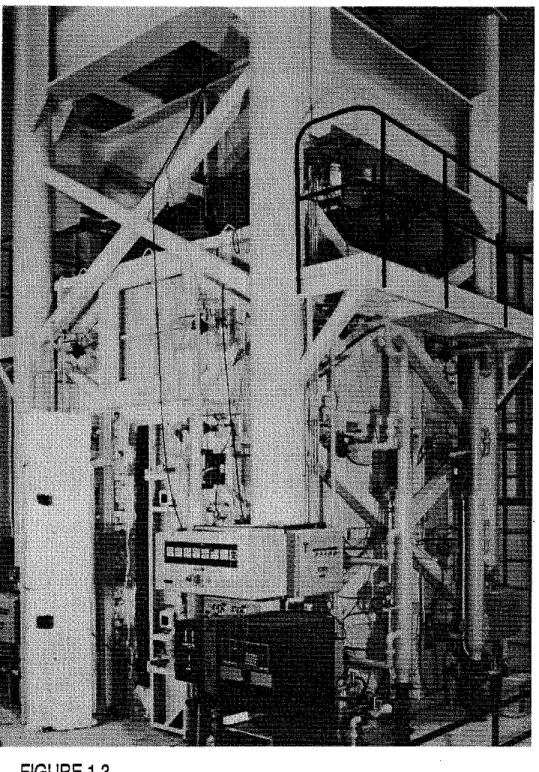
The tests were carried out by exposing the columns to heat in a furnace specially built for testing loaded columns and walls. The test furnace was designed to produce the conditions to which a member might be exposed during a f i e , i.e. temperatures, structural loads, and heat transfer. It consists of a steel framework supported by four steel columns, with the furnace chamber inside the framework (Fig. 1.2). The characteristics and instrumentation of the furnace are described in detail in Ref. [3]. Only a brief description of the furnace and the main components is given here.
1.2.1 Loading Device
A hydraulic jack with a capacity of 1000 t produced a load along the axis of the test column. The jack is located at the bottom of the furnace chamber. The plate on top of this jack can be used as a platform to which the column can be attached.
1.2.2 Furnace Chamber
The furnace chamber has a floor area of 2642 x 2642 mm (8 ft 8 in.) and is 3048 mrn (10 ft) high. The interior faces of the chamber are lined with insulating materials that efficiently transfer heat to the specimen. There are 32 propane gas burners in the furnace chamber, arranged in eight columns containing four burners each. The total capacity of the burners is 4700 kW (16 million Btulh). Each burner can be adjusted individually, which allows for a high degree of temperature uniformity in the furnace chamber. The pressure in the furnace chamber is also adjustable. It was set somewhat lower than atmospheric pressure.
1.2.3 Instrumentation
The furnace temperatures are measured with the aid of eight chromel-alumel thermocouples. The junction of each thermocouple was located 305 mm (1 ft) from the test specimen, at various heights. Two thermocouples were placed opposite each other at intervals of 610 mm (2 ft) along the height of the furnace chamber. The location of their junctions and their numbering are shown in Fig. 1.2. Thermocouples 4 and 6 were located at a height of 610 mm (2 ft) from the floor, thermocouples 2 and 8 at 1220 mm (4 ft), thermocouples 3 and 5 at 1830 mm (6 ft) and thermocouples 1 and 7 at 2440 mm (8 ft). The temperatures measured by the thermocouples are averaged automatically and the average temperature used as the criterion for controlling the furnace temperature.
The loads are controlled and measured using pressure transducers. The accuracy of controlling and measuring loads is about 20 kN (5 kips) at lower load levels and relatively better at higher loads.
The axial deformation of the test specimen is determined by measuring the displacement of the jack that supports the column. The displacement is measured using transducers with an accuracy of 0.002 mm.
1.3 TEST CONDITIONS AND PROCEDURES
The columns were installed in the furnace by bolting the end plates to a loading head at the top and a hydraulic jack at the bottom. For this purpose eight 19 rnrn (314 in.) bolts spaced regularly around the column were used at each end. On the bottom plates of the Columns 4 through 13, a clamping system, more easily secured, was used instead of the bolts. In either case, the end conditions were fixed.
Before each test, the moisture condition in the centre of the column was measured by inserting a resistance moisture sensor in a hole drilled in the concrete through one of the vent holes. The readings are recorded in Table 1.1.
1.3.1. Loading
All columns were tested under a c o n c e n ~ c load applied in 4 or more stages, the last stage being applied at least 40 minutes before the test. The load intensity varied in a wide range.
1.3.2 Fire Exuosure
The ambient temperature at the s t m of the test was about 20°C. During the test the column was exposed to heating controlled in such a way that the average temperature in the furnace followed as closely as possible the ASTRa-El19 141 or ULC-
SlOl [5] standard temperature-time curve. This curve can be approximated by the following equation:
Tf = 20
+
750 [ 1-
exp ( -3.79553G)]
+
170.416
where: Tf = Temperature in OCz = Time in hours. or by:
where
Tf
=Temperature in OF.During the test, temperatures in the furnace and in the column were measured at the locations described earlier.
1.3.3 Recording of Results
Temperature readings were taken at each thermocouple location at intervals of 2, 5 or 10 minutes. Axial strain was also measured.
The columns were considered to have failed, and the tests were terminated, when the hydraulic jack, which has a maximum speed of 76 mmlmin (3 in./min), could no longer maintain the load.
REFERENCES
1 Lie, T.T., A Procedure to Calculate Fire Resistance of Structural Members, National Research Council of Canada, Division of Building Research, NRCC 23574, 1984.
2 Structural Quality Steels. Canadian Standards Association Standard, G 40.21-M, Toronto.
3 Lie, T.T., New Facility to Determine Fire Resistance of Columns, Canadian Journal of Civil Engineering, Vol. 7, 1980.
4 Standard Methods of Fire Tests of Building Construction and Materials, ANSI/ASTM
El
19-79, American Society for Testing and Materials.5 Standard Methods of Fire Endurance Tests of Building Construction and
GENERAL DESCRIPTION OF SPECIMENS AND TESTS. INDEX OF TABLES AND FIGURES.
Table 1.1 Table 1.2 Table 1.3 Figure 1.1 Figure 1.2 Figure 1.3 Figure 1.4 Figure 1.4.A Figure 1.5 Figure 1.6 Figure 1.7
Details Concerning First Phase Column Test Specimens. Batch Quantities and Properties of Concrete.
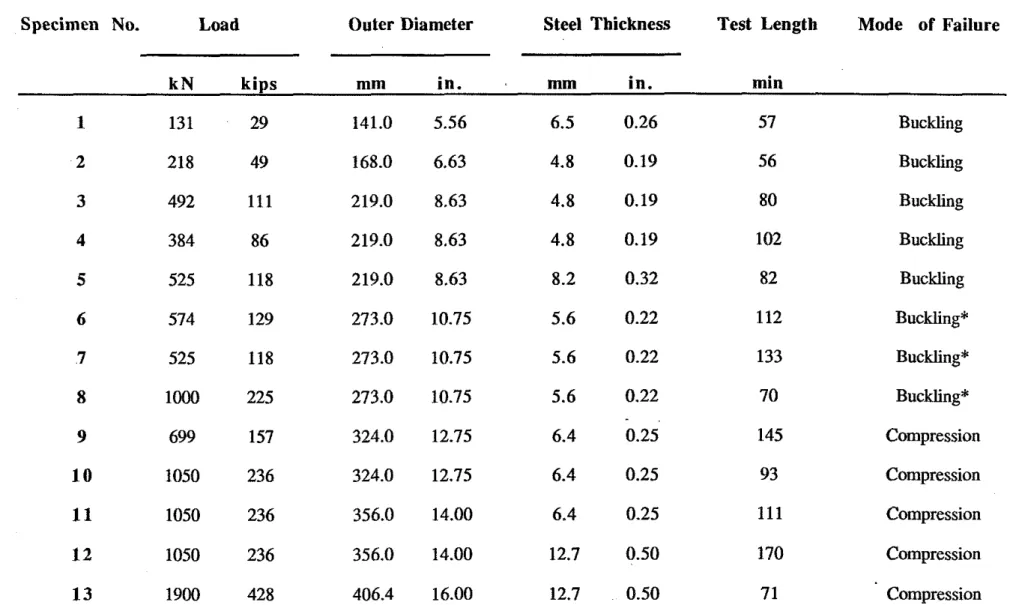
Load, Dimension And Performance of the Columns.
Gradation Curves of Aggregate Used in Pour No. 1.
Location and Numbers of Thermocouples in Column Furnace Chamber.
Column Furnace.
Column Specimen Details and Dimensions. Column End Plate Detail.
Layout of Thermocouple Frame.
Location and Number of Thermocouples in a Section: Columns Nos. 1 and 2.
Location and Number of Thermocouples in a Section: Columns Nos. 3 to 13.
Table 1.1 Details Concerning First Phase Column Test Specimens
Specimen Casting Test Date Moisture Compressive Strength of Concrete Yield Strength
N o . Date Conditions of Steel
of Specimen
at Test Date at 28 days at Test Date
(% RH)
Table 1.2 Batch Quantites and Properties of Concrete. Pour no.1 81/06/09 Pour no.2 81110/08 kg/cu. m lb/cu. yd
I
Cement: 366 Coarse Aggregate: 1120Water Cement Ratio: 0.5 2 617 1888 Fine Aggregate: 660 Water: 190 Average Compressive Strength at 28 Days in MPa (psi): 26.3 / 3820 1113 320 Additives (microsilica,
super plasticizer
...
etc): NONE23.5 / 3410 NONE Pour no.3 81/10/22 24.3 / 3530 NONE Pour no.4 8V11105 NONE
Table 1.3 Load Dimensions and Performance of the Columns. (Column Height is 3180 mm (12 ft 6 in.)).
Specimen No. Load Outer Diameter Steel Thickness Test Length Mode of Failure
k N kips mm in. mm in. min
1 131 29 141.0 5.56 6.5 0.26 57 Buckling 2 218 49 168.0 6.63 4.8 0.19 56 Buckling 3 492 111 219.0 8.63 4.8 0.19 80 Buckling 4 384 86 219.0 8.63 4.8 0.19 102 Buckling 5 525 118 219.0 8.63 8.2 0.32 82 Buckling 6 574 129 273.0 10.75 5.6 0.22 112 Buckling* 7 525 118 273.0 10.75 5.6 0.22 133 Buckling* 8 loo0 225 273.0 10.75 5.6 0.22 70 Buckling* 9 699 157 324.0 12.75 6.4 0.25 145 Compression 10 1050 236 324.0 12.75 6.4 0.25 93 Compression 1 1 1050 236 356.0 14.00 6.4 0.25 111 Compression 1 2 1050 236 356.0 14.00 12.7 0.50 170 Compression 13 1900 428 406.4 16.00 12.7 0.50 71 Compression
STANDARD SIZE OF SQUARE MESH SIEVE
FIGURE 1.1
GRADATION CURVES OF AGGREGATE USED IN POUR N0.1.
(GRADATION CURVES FOR POURS NO.
2 , 3
AND 4 ARE NOT
SIGNIFICANTLY DIFFERENT).
( E A S T S I D E ) S I D E V I E W
I
F I G U R E 1 . 2 L O C A T I O N A N D N U M B E R S OF T H E R M O C O U P L E S I N C O L U M N F U R N A C E C H A M B E RFIGURE
1.3
Columns 1,2 Columns 2 to 8 Columns 9 to 13
+-+
25 mm+
I
L
19 mm 38 mrn 3-
END PLATE DETAIL
13 mrn DIA.
I
I
HOLE LOCATIONS
FIGURE
1.4FIGURE 1.4.A
FIGURE 1.5
SECTION A-A
FIGURE
1.6
LOCATION AND NUMBER OF THERMOCOUPLES
IN A SECTION: COLUMNS NOS.l AND
2.
b
SECTION A-A
FIGURE
1.7
LOCATION AND NUMBER OF THERMOCOUPLES
IN A SECTION: COLUMNS NOS.3 TO
13.
2 TEST DESCRIPTIONS AND RESULTS
This chapter contains results and observations for each of the 13 tests. The basic characteristics already given in Table 1.1 are reiterated for each specimen.
Where original measurements were made in imperial units, these values appear in parentheses following the converted value in metric units. Elevation, cross section and finishing details for each column appear on Figs. 1.4.and 1.4.A.
2.1 COLUMN N0.l
Date tested: September 22 , 1983.
Loading: 131 kN (29 kips), Concentric. Location of Thermocouples in Cross Section: see Fig. 1.6.
S~ecimen Dimensions;
Length: 3810 mm (12 ft 6 in.). Outer Diameter: 141.0 mm (5.56 in.). Steel Shell Thickness: 6.5 mm (0.26 in.). Measured Prouerties:
Cylinder strengths: 28.62 MPa (4150 psi) at 28 day test. 31.03 MPa (4500 psi) on test date. Steel Yield Stress: 401.93 MPa (62.9 ksi).
Relative humidity: 95%.
Test duration: 57 min. Type of failure: Buckling. Temperatures: Table 2.l.a. Axial deformations: Table 2.1.b.
2.2 COLUMN N0.2
Date tested: February 13, 1985. Loading: 218 kN, Concentric.
Location of Thermocouples in Cross Section: see Fig. 1.6.
S~ecimen Dimensions;
Length: 3810 mm (12 ft 6 in.). Outer Diameter: 168.0 mm (6.63 in.). '
Measured Prooerties:
Cylinder strengths: 28.62 MPa (4150 psi) at 28 day test. 35.45 MPa (5140 psi) on test date. Steel Yield Stress: 346.98 MPa (54.3 ksi).
Relative humidity: 53%.
Test duration: 56 min. Type of failure: Buckling. Temperatures: Table 2.2.a. Axial deformations: Table 2.2.b.
Date tested December 03,1984. Loading: 492 kN, Concentric.
Location of Thermocouples in Cross Section: see Fig. 1.7.
Length: 3810 mrn (12 ft 6 in.). Outer Diameter: 219.0 mm (8.63 in.). Steel Shell Thickness: 4.800 mm (0.19 in.). Measured Prooerties:
Cylinder strengths: 24.34 MPa (3530 psi) at 28 day test. 30.97 MPa (4490 psi) on test date. Steel Yield Stress: 322.06 MPa (50.4 ksi).
Relative humidity: 78%.
Test duration: 80 rnin. Type of failure: Buckling. Temperatures: Table 2.3.a. Axial deformations: Table 2.3.b.
Date tested: April 10,1984
Loading: 384 kN, Concentric.
Location of Thermocouples in Cross Section: see Fig. 1.7.
Soecimen Dimensions:
Length: 3810 mm (12 ft 6 in.). Outer Diameter: 219.0 mm (8.63 in.). Steel Shell Thickness: 4.800 rnm (0.19 in.).
Measured Pmuerties:
Cylinder strengths: 24.34 MPa (3530 psi ) at 28 day test. 32.28 MPa (4680 psi ) on test date. Steel Yield Stress: 322.06 MPa (50.4 ksi).
Relative humidity: 95%.
Test duration: 102 min. Type of failure: Buckling. Temperatures: Table 2.4.a. Axial deformations: Table 2.4.b.
Date tested: July 10, 1984.
Loading: 525 KN (118 kips), Concentric. Location of Thermocouples in Cross Section: see Fig. 1.7.
hecimen Dimensions:
Length: 3810 mm (12 ft 6 in.). Outer D i e t e r : 219.0 mm (8.63 in.). Steel Shell Thickness: 8.200 mm (0.32 in.). Measured Prouerties:
Cylinder strengths: 24.34 MPa (3530 psi) at 28 day test. 31.72 MPa (4600 psi) on test date. Steel Yield Stress: 367.43 MPa (57.5 ksi).
Relative humidity: >go%.
Test duration: 82 min. Type of failure: Buckling. Temperatures: Table 2.5.a. Axial deformations: Table 2.5.b.
Date tested: May 7, 1982.
Loading: 574 KN (129 kips), Concentric. Location of Thermocouples in Cross Section: see Fig. 1.7.
Specimen Dimensions:
Length: 3810 mm (12 ft 6 in.). Outer Diameter: 273.0 mm (10.75 in.) Steel Shell Thickness: 5.6 mm (0.22 in.).
Cylinder strengths: 26.34 MPa (3820 psi) at 28 day test. 28.62 MPa (4150 psi) on test date. Steel Yield Stress: 412.79 MPa (64.6 ksi).
Relative humidity: >go%.
Test duration: 112 min. Type of failure: Buckling. Temperatures: Table 2.6.a. Axial deformations: Table 2.6.b.
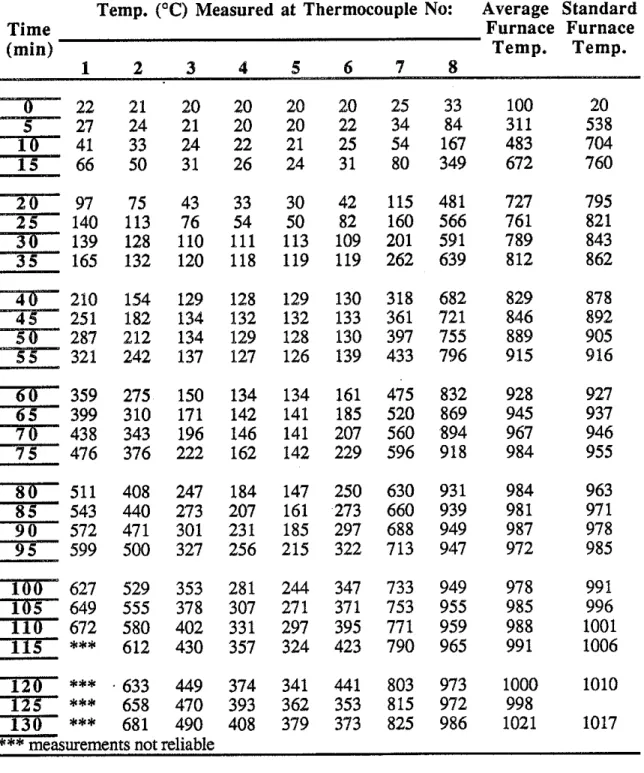
2.7 COLUMN N0.7
Date tested: June 18, 1982.
Loading: 525 KN (118 kips), Concentric. Location of Thermocouples in Cross Section: see Fig. 1.7.
S~ecimen Dimensions:
,
Length: 3810 mm (12 ft 6 in.). Outer Diameter: 273.0 mrn (10.75 in.). Steel Shell Thickness: 5.6 mm (0.22 in.). Measured Pro~erties:
Cylinder strengths: 26.34 MPa (3820 psi) at 28 day test. 28.97 MPa (4200 psi) on test date. Steel Yield Stress: 412.79 MPa (64.6 ksi).
Relative humidity: >go%.
Test duration: 133 min. Type of failure: Buckling. Temperatures: Table 2.7.a. Axial deformations: Table 2.7.b.
2.8 COLUMN N0.8
Date tested: July 21, 1983.
Loading: 1000 KN (225 kips), Concentric. Location of Thermocouples in Cross Section: see Fig. 1.7.
S~ecimen Dimensions:
Length: 3810 mm (12 ft 6 in.). Outer Diameter: 273.0 mrn (10.75 in.). Steel Shell Thickness: 5.600 mm (0.22 in.).
Measured h e r t i e s :
Cylinder strengths: 26.34 MPa (3820 psi) at 28 day test. 27.24 MPa (3950 psi) on test date. Steel Yield Stress: 412.79 MPa (64.6 ksi).
Relative humidity: >go%.
Test duration: 70 min. Type of failure: Buckling. Temperatures: Table 2.8.a. Axial deformations: Table 2.8.b.
Date tested: January 18,1983.
Loading: 699 KN (157 kips), Concentric. Location of Thermocouples in Cross Section: see Fig. 1.7.
s~ecimen Dimensions:
Length: 3810 mm (12 ft 6 in.). Outer D i e t e r : 324.0 mm (12.75 in.). Steel Shell Thickness: 6.400 mm (0.25 in.). Measured hooerties:
Cylinder strengths: 23.52 MPa (3410 psi) at 28 day test. 27.59 MPa (4000 psi) on test date. Steel Yield Stress: 439.63 MPa (68.8 ksi).
Relative humidity: unavailable.
Test duration: 145 min. Type of failure: compression. Tempe'ratures: Table 2.9.a. Axial deformations: Table 2.9.b.
Date tested: August 29, 1985.
Loading: 1050 KN (236 kips), Concentric. Location of Thennocouples in Cross Section: see Fig. 1.7.
S~ecimen Dimensions:
Length: 3810 mm (12 ft 6 in.). Outer Diameter: 324.0 mm (12.75 in.) Steel Shell Thickness: 6.4 mm (0.25 in.);
Measured Pro~ertie~:
Cylinder strengths: 23.52 MPa (3410 psi) at 28 day test. 24.28 MPa (3520 psi) on test date. Steel Yield Stress: 439.63 MPa (68.8 ksi).
Relative humidity: 84%.
Test duration: 93 min. Type of failure: compression. Temperatures: Table 2.10.a. Axial deformations: Table 2.10.b.
Date tested: September 16, 1985.
Loading: 1050
KN
(236 kips), Concentric. Location of Thermocouples in Cross Section: see Fig. 1.7.Soecimen Dimensions:
Length: 3810 mm (12 ft 6 in.). Outer Diameter: 356.0
mm
(14.00 in.). Steel Shell Thickness: 6.400 mm (0.25 in.). Measured Provertiex:Cylinder strengths: 23.52 MPa (3410 psi) at 28 day test. 23.78 MPa (3448 psi) on test date. Steel Yield Stress: 414 07 MPa (64.8 ksi).
Relative humidity: 85%.
Test duration: 11 l min. Type of failure: compression. Temperatures: Table 2.1 1.a. Axial deformations: Table 2.1 l.b. 2.12 COLUMN N0.12
Date tested: October 15, 1985.
Loading: 1050 KN (236 kips), Concentric. Location of Thermocouples in Cross-Section: see Fig. 1.7.
S~ecimen Dimensions:
Length: 3810 mm (12 ft 6 in.). Outer Diameter: 356.0 mm (14.00 in.). Steel Shell Thickness: 12.700 mm'(0.50 in.).
Measured Provertie%:
Cylinder strengths: 23.52 MPa (3410 psi) at 28 day test. 25.37 MPa (3678 psi) on test date. Steel Yield Stress: 387.87 MPa (60.7 ksi).
Relative humidity: 89%.
Test duration: 170 min. Type of failure: compression. Temperatures: Table 2.12.a. Axial deformations: Table 2.12.b.
Date tested: February 26, 1986.
Loading: 1900 KN (236 kips), Concentric. Location of Thennocouples in Cross Section: see Fig. 1.7.
Specimen Dimensions:
Length: 3810 mm (12 ft 6 in.). Outer Diameter: 406.0 mm (16.00 in.). Steel Shell Thickness: 12.700 mm (0.50 in.).
Measured Properties:
Cylinder strengths: 23.52 MPa (3410 psi) at 28 day test. 27.56 MPa (3996 psi) on test date. Steel Yield Stress: 369.89 MPa (57.9 ksi).
Relative humidity: >go%.
Test duration: 71 min. Type of failure: compression
.
Temperatures: Table 2.13.a. Axial deformations: Table 2.13.b.Test Descriptions and Results: Index of Tables and Figures. Table 2.1.a Table 2.1.b Figure 2 . 1 Table 2.2.a Table 2.2.b Figure 2.2 Table 2.3.a Table 2.3.b Figure 2.3 Table 2.4.a Table 2.4.b Figure 2.4
Temperature Measured in Column No.1 Cross Section. Measured Axial Deformation of Column No.1.
Column Specimen No.1 after Test.
Temperature Measured in Column No.2 Cross Section. Measured Axial Deformation of Column No.2.
Column Specimen No.2 after Test.
Temperature Measured in Column No.3 Cross Section. Measured Axial Deformation of Column No.3.
Column Specimen No.3after Test.
Temperature Measured in Column No.4 Cross Section. Measured Axial Deformation of Column No.4.
Column Specimen No.4 after Test.
Table 2.5. a Temperature Measured in Column No.5 Cross Section. Table 2.5. b Measured Axial Deformation of Column No.5.
Figure 2 . 5 Column Specimen No.5 after Test.
Table 2.6. a Temperature Measured in Column No.6 Cross Section. Table 2.6. b Measured Axial Deformation of Column No.6.
Figure 2.6 Column Specimen No.6 after Test.
Table 2.7. a Temperature Measured in Column No.7 Cross Section. Table 2.7. b Measured Axial Deformation of Column No.7.
Figure 2 . 7 Column Specimen No.7 after Test.
Table 2.8. a Temperature Measured in Column No.8 Cross Section. Table 2.8. b Measured Axial Deformation of Column No.8.
Figure 2.8 Column Specimen No.8 after Test.
Table 2.9. a Temperature Measured in Column No.9 Cross Section. Table 2.9. b Measured Axial Deformation of Column No.9.
Figure 2.9 Column Specimen No.9 after Test.
Table 2.10. a Temperature Measured in Column No. 10 Cross Section. Table 2.10. b Measured Axial Deformation of Column No.10.
Figure 2.10 Column Specimen No.10 after Test.
Table 2.11 .a Temperature Measured in Column No.11 Cross Section. Table 2.11. b Measured Axial Deformation of Column No.11.
Figure 2.1 1 Column Specimen No.11 after Test.
Table 2.12.a Temperature Measured in Column No.12 Cross Section. Table 2.12. b Measured Axial Deformation of Column No.12.
Figure 2.12 Column Specimen No.12 after Test.
Table 2.13. a Temperature Measured in Column No. 13 Cross Section. Table 2.13. b Measured Axial Deformation of Column No. 13.
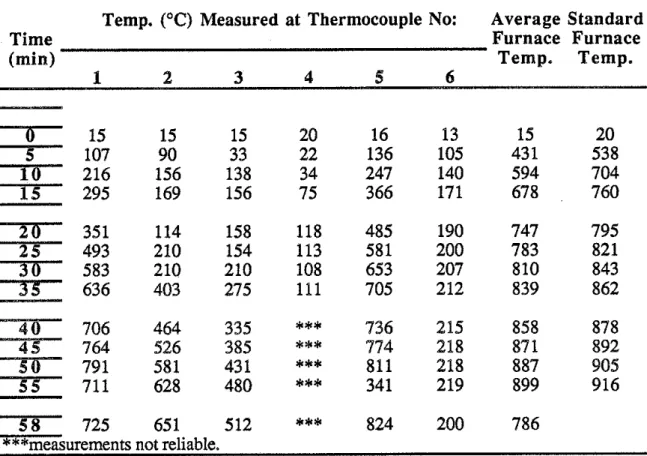
Table 2.1.a Temperatures Measured in Column No. 1 Cross Section
I
Temp. ("C) Measured at Thermocouple No: Average Standard
Time Furnace Furnace
(min) Temp. Temp.
5 8 725 65 1 512
***
824 200 786 ***measurements not reliable.Table 2.1.b Measured Axial Deformation of Column No. 1
Time Expan- Time Expan- Time Expan-
sion sion sion
FIGURE 2.1
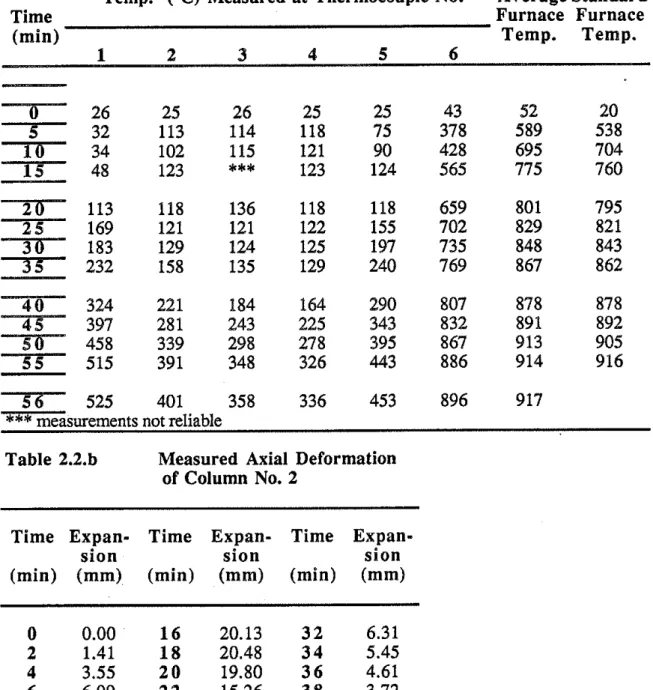
Table 2.2.a Temperatures Measured in Column No. 2 Cross Section
Temp. (OC) Measured at Thermocouple No: Average Standard
Time Furnace Furnace
fmin) Temp. Temp.
3
6
525 401 358 336 453 896 917***
measurements not reliableTable 2.2.b Measured Axial Deformation of Column No. 2
Time Expan- Time Expan- Time Expan-
sion sion sion
FIGURE
2.2
Table 2.3.a Temperatures Measured in Column No. 3 Cross Section
Temp. (OC) Measured at Thermocouple No:
Average Standard
Time Furnace Furnace
(min) 1 2 3 4 5 6 7 8 Temp. Temp.
60
174 519 335 212 178 205 217 863 909 927-63
213 563 370 246 209 242***
870 907 937 7 2 5 2 602 406 278 246 280***
889 926 9467 5 291 632 440 310 287 291
***
902 935 9558 0 324 324 475 341 324 323 314 924 938 963
***
measurements not reliable.Table 2.3.b Measured Axial Deformation of Column No. 3
Time Expansion Time Expansion Time Expansion
FIGURE 2.3
Table 2.4.a Temperatures Measured in Column No. 4 Cross Section
Temp. (OC) Measured at Thermocouple No: Average Standard
Time Furnace Furnace
(min) Temp. Temp.
1 2 3 4 5 6 7 8
r***
***
575 464 420 441 885 954 973 99 1102
***
***
581 472 430 450***
960 978***
measurements not reliable.Table 2.4.b Measured Axial Deformation of Column No. 4
Time Expansion Time Expansion Time Expansion
(min) (mm) (min) (mm) (min) (mm)
0 0.00 3 0 8.60 7 0 1.48 5 4.40 3 5 7.17 8 0 0.05 1 0 10.89 4 0 6.09 9 0 -2.58 1 5 16.65 4 5 5.22 95 -9.11 2 0 18.77 5 0 4.27 100 -24.50 2 5 11.55 6 0 3.25 102 -27.91
FIGURE 2.4
Table 2.5.a Temperatures Measured in Column No. 5 Cross Section
I
Temp. (OC) Measured at Thermocouple No: Average Standard
Time Furnace Furnace
(min) Temp. Temp.
1 2 3 4 5 6 7 8
*** ***
351 361 338 426***
922***
96384***
***
363 371 357 437***
902***
***
measurements not reliable.Table 2.5.b Measured Axial Deformation of Column No. 5
Time Expansion Time Expansion Time Expansion
FIGURE 2.5
Table 2.6.a Temperatures Measured in Column No. 6 Cross Section
Temp. (C) Measured at Thermocouple No: Average Standard
Time Furnace Furnace
(min) Temp. Temp.
1
(
1
0
***
432 332 271 257***
456 356 294 281***
479 379 317 304***
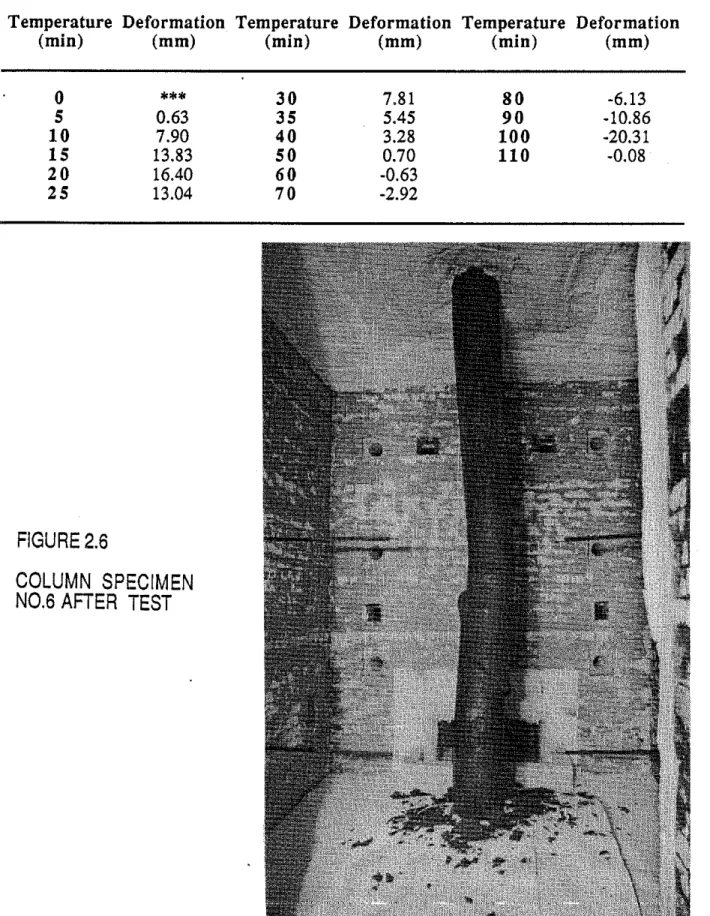
measurements not reliableTable 2.6.b Measured Axial Deformation of Column No.6
Temperature Deformation Temperature Deformation Temperature Deformation (min) (mm) (rnin) (mm) (min) (mm)
FIGURE 2.6
COLUMN SPECIMEN
N0.6 AFTER TEST
Table 2.7.a Temperatures Measured in Column No. 7 Cross Section
Temp. (OC) Measured at Thermocouple No: Average Standard
Time Furnace Furnace
(min) Temp. Temp.
I
1 2 3 4 5 6 7 87
22 21 20 20 20 20 25 33 100 20 5 27 24 21 20 20 22 34 84 311 538--i'iS-
41 33 24 22 21 25 54 167 483 704 1 5 1 6 6 50 31 26 24 31 80 349 672 760-%b
97 75 43 33 30 42 115 481 727 795 7 1 4 0 113 76 54 50 82 160 566 761 821 139 128 110 111 113 109 201 591 789 843 3 5 165 132 120 118 119 119 262 639 812 862 7 2 1 0 154 129 128 129 130 318 682 829 878 4 5 251 182 134 132 132 133 361 721 846 892 T 2 8 7 212 134 129 128 130 397 755 889 905 T 3 2 1 242 137 127 126 139 433 796 915 91660
359 275 150 134 134 161 475 832 928 927-65
399 310 171 142 141 185 520 869 945 937 7 4 3 8 343 196 146 141 207 560 894 967 946 7 5 476 376 222 162 142 229 596 918 984 955***
,633 449 374 341 441 803 973 1000 1010m***
658 470 393 362 353 815 972 998r***
681 490 408 379 373 825 986 1021 1017Table 2.7.b Measured Axial Deformation of Column No.7
Time Deformation Time Deformation Time Deformation (min) (mm) (min) (mm) (min) (mm)
FIGURE 2.7
COLUMN SPECIMEN
N0.7 AFTER
TEST.
Table 2.8.a Temperature Measured in Column No. 8 Cross Section
Temp. ("C) at Thermocouple No: Average Standard
Time Furnace Furnace
(min) Temp. Temp.
1 2 3 4 5 6 7 8
530 363 139 138 139 480 138 840 914 927 6 5 5 7 5 396 143 142 143 524 142 857 921 937
6 9 464 231 204 144 143 568 145
***
930***
measurements not reliableTable 2.8.b Measured Axial Deformation of Column No. 8
Time Expansion Time Expansion Time Expansion
FIGURE
2.8
Table 2.9.a Temperature Measured in the Column No. 9 Cross Section
I
Temp. (OC) Measured at Thermocouple No: Average Standard
1
Time Furnace Furnace(min) Temp. Temp.
1
2 1 2 2 2 3 2 4 2 5 26 27 2 81
7 5 2 30 1 21 19 20 19 19 19 19 19 20 19 63 25***
21 530 69 538 20 7 5 5 31 21 20 19 23 104***
606 704 76 46 27 22 20 30 142***
626 760 T I 0 3 64 38 28 27 41 201 511 685 795 131 83 53 40 42 59 275 573 746 8213
0
136 100 75 74 75 90 269 600 786 84335
139 111 94 114 120 108 328 669 822 8627
178 126 114 123 128 121 404***
843 878 231 140 128 133 133 131 466***
856 8927
281 143 131 127 127 129 514***
875 905 T 3 2 5 155 125 122 122 124 564***
887 916 7 3 6 9 185 129 127 127 129 615***
902 927 6 5 413 219 137 135 135 137 665***
911 9377
0
454 251 145 141 140 146 705***
926 946 7 5 491 281 155 144 144 161 738***
927 955 8 0 525 308 170 145 145 179 769***
941 9638
5
556 335 188 144 144 199 794***
947 97 17
584 360 206 143 143 219 817***
947 97 8 9 5 610 385 224 146 141 240 838***
953 985 634 408 243 158 140 260 857***
966 99 1 656 430 261 173 139 280 875***
973 996 7 6 7 7 451 279 188 140 301 889***
973 1001 696 472 297 204 150 321 903***
982 1006 m 7 1 5 493 314 221 163 341 914***
989 1010 1 2 5 732 512 332 238 190 359 924***
995 r 7 5 0***
349 255 214 377 932***
997 1017 1 3 5 764 549 366 274 237 394 941***
1007 T 7 7 8 567 384 291 256 409*** ***
1012 1024r***
582 400 308 273 422*** ***
1016Table 2.9.b Measured Axial Deformation of Column No.9
Time Deformation Time Deformation Time Deformation (min) (mm) (min) (mm) (min) (mm)
FIGURE
2.9
COLUMN
SF
Table 2.10.a Thermocouples Measured in Column No. 10 Cross Section
Temp. (OC) Measured at Thermocouple No: Average Standard
Time Furnace Furnace
(min) Temp. Temp.
1 2 3 4 5 6 7 8
8 5 707 402 87 126 126 196 487
***
965 97 1729 429 88 123 123 217 514
***
974 978***
measurements not reliable.Table 2.10.b Measured Axial Deformation of Column No. 10
Time Expansion Time Expansion Time Expansion
FIGURE
2.10
Table 2.11.a Temperature Measured in the Column No. 11 Cross Sectio
i
Temp. (OC) measured at Thermocouple No: Average Standard
I
Time (min) Furnace Furnace Temp. Temp.1 2 3 4 5 6 7 8 1 9 18 18 18 18 18 19 29 76 20 - 5 6 9 23 18 18 18 18 55 205 559 538
7
130 40 20 18 18 20 104 341 698 7041
5
194 68 26 19 19 25 163 474 754 760-20
242 96 36 23 21 34 223 596 798 79525
308 116 62 32 26 51 278 662 823 8213
7
)
375 131 88 54 41 74 341 724 876 8437
433 142 111 85 65 91 412 745 869 8627
449 161 120 113 91 121***
715 894 878 4 5 417 173 119 115 108 123***
689 903 892 7 4 4 4 180 117 116 117 120***
732 912 905 493 193 118 117 119 120***
772 926 9166
0
555 213 123 121 123 124***
812 940 927 6 5 626 239 132 129 130 132.***
844 943 9377
0
678 269 139 136 138 139***
844 954 946 7 5 721 302 143 141 142 142 643 867 964 9558
0
752 335 147 143 145 144 730 886 965 963 8 5 775 365 152 138 139 139 772 917 970 97 1 9 0 7 9 7 393 162 133 134 161 806 935 984 978 814 419 175 130 130 184 826 936 979 985 5-cju- 827 443 190 128 128 205 840 944 991 991-
1
1
0
856 486 220 129 123 242 865 950 1004 1001***
measurements not reliable.Table 2.11.b Measured Axial deformation of Column No. 11
Time Expansion Time Expansion Time Expansion
(min) (mm) (min) (mm) (min) (mm)
0 0.00 2 6 6.79 7 0 -0.07 5 3.05 2 8 6.05 8 0 -1.71 1 0 10.03 3 0 5.55 9 0 -4.01 1 5 15.46 3 5 4.12 1 0 0 -7.31 2 0 16.08 4 0 3.30 1 1 0 -12.22 2 2 10.7 1 5 0 1.78 115 -15.28 2 4 7.89 6 0 0.76
FIGURE 2.1 1
Table 2.12.a Temperatures Measured in Column No. 12 Cross Section
Temp. (OC) Measured at Thermocouple No: Average
Time Furnace (min) Temp. 1 2 3 4 5 6 7 8 Standard Furnace Temp. -?TjiT 884 496 261 155 169 178 835 948 986 99 1 r 9 1 1 528 263 163 161 199 840 958 994 996 922 583 173 158 157 221 838 965 998 1001 926 606 168 155 156 239 856 971 1005 1006 1 2 0 9 3 4
***
171 150 153 153 875 976 1011 1010-125
***
***
181 161 150 243 883 979 1013*** ***
215 188 164 192 892 984 1019 1017 7 5 3 - 9 3 8 678 216 211 205 212 902 990 1026r***
***
231 233 228 231 911 997 1032 1024r***
***
249 251 247 248 921 1005 1038'm***
***
267 267 265 265***
1008 1038 1031 1 5 5***
***
282 282 281 283***
1013 1042T * * *
***
298 298 298 298***
1020 1050 1038 1 6 5***
***
312 312 314 313***
1025 1049l'fO***
***
327 326 328 328***
1030 1055 1045Table 2.12.b Measured Axial Deformation of Column No.12
Time Expansion Time Expansion Time Expansion (min) (mm) (min)
.
(mm) (min) (mm)FIGURE 2.12
COLUMN SPEClME
N0.12
AFFER
TEST
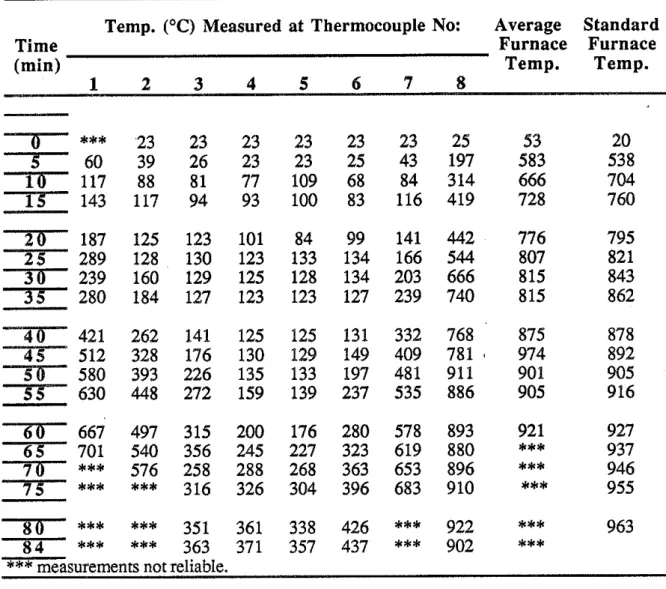
Table 2.13 Temperatures Measured in Column No. 13 Cross Section Temp. (OC) Measured at Thermocouple No: Average Standard
Time Furnace Furnace
(rnin) Temp. Temp.
-60
414 140 132***
140 139 708 705 929 9276 5 597 148 141
***
149 147 751 749 943 9377
0
685 154 147***
152 152 782 786 948 946***
measurements not reliable.Table 2.13.b Measured Axial Deformation of Column No. 13
Time Expansion Time Expansion Time Expansion