Engineering Systems Division
Working Paper Series
ESD-WP-2004-07
C
ONNECTIVITY
L
IMITS OF
M
ECHANICAL
A
SSEMBLIES
M
ODELED AS
N
ETWORKS
Daniel E. Whitney
Engineering Systems Division
MIT
Connectivity Limits of Mechanical Assemblies Modeled as Networks
Daniel E Whitney
Engineering Systems Division MIT
Cambridge MA 02139 ABSTRACT
This paper applies network connectivity analysis to mechanical assemblies. Assemblies have extensive intentional structure while simultaneously displaying some of the
properties of previously analyzed networks. Fundamental principles impose restrictions on the structure of assemblies, as do some practical principles. Fundamental restrictions stem from the desire to avoid over-constraining the assembly. Practical restrictions stem from the desire to limit the complexity of the assembly or any significant subassembly. These restrictions play a role analogous to the cost of connection. For these reasons, mechanical assemblies are unlikely to exhibit scale-free properties common in many natural systems and some man-made ones.
Introduction
Mechanical assemblies are ubiquitous in everyday life, but serious study of them began only recently. [Nevins and Whitney] Assemblies can be regarded as mere collections of parts, as complex hierarchical systems, and as networks. Automobiles reportedly have approximately 10,000 parts. Large commercial aircraft reportedly have 100,000 individually designed parts, one million part numbers, and over 7 million individual parts. The network properties of assemblies are of interest during their design, manufacture, and testing, to name a few instances. Analyses of the effect on final assembly configuration of variation in the shape of individual parts depend on drawing and analyzing “tolerance chains” that extend through the network. [Björke] Elucidation of the feasible assembly sequences, necessary in order to design assembly lines, is accomplished by analyzing cut-sets in the assembly network. [Bourjault] [Nof, Wilhelm, and Warnecke] Typical products with only a handful of parts may have thousands of assembly sequences. Decisions about modularity of mechanical products are strongly influenced by whether the product processes large amounts of power or whether it is essentially a signal processor. [Whitney, 1996] Substitution of one subassembly for another permits products to be customized economically for thousands of individual customers. [Lee] Feasible subassemblies form the basis for divide-and-conquer approaches to design, manufacture, and debugging of complex products.
Assemblies may appear unique when looked at individually. Are there any common properties that can help us understand and overcome their complexity? [Albert and Barabási] are among many researchers looking for common themes in diverse domains based on a network view. [Barabási] shows that networks as diverse as biological reactions in yeasts, the World-Wide Web, and databases of film actors display “scale free” properties. A scale-free network is characterized by a hub and spokes structure in which there appears to be hardly any limit as to how many nodes a hub can be linked to.
A histogram of network connectivity of nodes (how many nodes a given node links to, called the nodal degree) in a scale-free network has a slope in log-log coordinates of approximately –2, give or take a fraction. This means that there are many nodes with small nodal degree and fewer and fewer nodes with larger and larger nodal degree. Larger networks have hubs with larger nodal degrees, and for the family of scale free networks there is no typical nodal degree. Numerous suggestions have been made concerning how this phenomenon might arise.
In this paper, we focus on the average nodal degree of mechanical assemblies and show theoretically and empirically that an equivalent measure (the number of connections between parts divided by the number of parts, equivalently half the average nodal degree) rarely exceeds 2 regardless of the number of parts (nodes) in the assembly.
Assemblies as Networks
Since founding research on assembly sequences by [Bourjault], the liaison diagram has become the canonical network representation of an assembly. Each part is a node and each deliberate or incidental contact between parts is an edge. See Figure 1 for an example product and its liaison diagram.
Figure 1. Example Product and Its Liaison Diagram. The product is a 4-cylinder
automobile engine, shown for illustrative purposes and to define part names. The liaison diagram pertains to a V-8 engine having 242 parts. V-8 engines are essentially two 4-cylinder engines that share a crank shaft.
[Milo et al] discuss repeating characteristics of networks. An informal survey of dozens of common mechanical products indicates that three types of liaison diagram can be found: chains, hub-spokes, and general networks. Structures like automobile bodies typically are hub-spokes or nested hub-spokes. Machinery typically is a general network, the most common type overall. In very large products, each subassembly may play the role of a hub, but for reasons discussed next, there are no subassemblies with hundreds of arcs linking them to other subassemblies or parts within other subassemblies.
Even though cars and aircraft have thousands or millions of parts, they are typically regarded as being collections of subassemblies. Subassemblies may be defined as physically coherent collections of parts. Since subassemblies are typically composed of smaller sub-subassemblies, the definition of subassembly is somewhat arbitrary. For practical reasons, few subassemblies exceed a dozen or so parts. It is too hard to test and diagnose anything much larger, and transportation from nearby subassembly production locations or distant suppliers to final assemblers would be cumbersome and fraught. For this reason, most assemblies are made of subassemblies that may be considerably
complex within themselves but, to simplify final assembly, have only a few well-defined interfaces to other subassemblies. This in turn means that assemblies are unlikely to show the range of nodal degrees that is observed in other systems, whether natural or man-made.
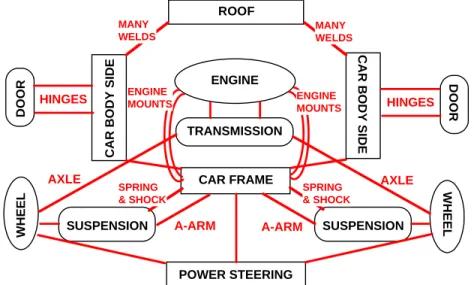
Figure 2 shows an incomplete but reasonably accurate liaison diagram of a car. It is highly hierarchical, consisting of complex subassemblies that join to each other with relatively few liaisons. Within each subassembly are many sub-subassemblies with the same character, recursively. Thus at each stage of assembly, the joints between coherent units are few and simple, but within each such unit there may be many joints. Well down the hierarchy one can find hubs, such as the circuit board inside the radio or the frame inside the seat. But these hubs do not serve the function of directly cross-linking distant and diverse nodes in the same sense that hubs do in the World Wide Web.
ENGINE
TRANSMISSION
CAR FRAME
CAR BODY SIDE
CAR BODY SIDE
SUSPENSION SUSPENSION WHEEL WHEEL DOOR DOOR ROOF HINGES HINGES AXLE AXLE A-ARM A-ARM SPRING & SHOCK SPRING & SHOCK ENGINE MOUNTS MANY WELDS MANY WELDS ENGINE MOUNTS POWER STEERING
Figure 2. Notional Liaison Diagram of Car. A car is made of a large number of
complex subassemblies containing from dozens to hundreds of parts. They join to each other at relatively few places. Except for the liaison called “many welds,” the liaisons in the figure are shown in their correct cardinality. Thus, the door joins the body side via the two hinges shown. The engine joins the transmission via the crankshaft and a bolted joint. Not shown are other complex subassemblies with the same properties, such as seats and instrument panel. Within each complex subassembly are other complex sub-subassemblies that in turn join to their parents via a relatively few liaisons. An example is the cylinder head, containing 30 to 40 parts, which joins to the engine block via one face to face joint and several bolts. Another is the radio, which joins to the instrument panel with two screws. Within the cylinder head subassembly, the head itself is a hub. Similarly, within the radio, the circuit board is a hub.
Figure 3 shows the distribution of average network connectivities (number of arcs or liaisons divided by number of nodes or parts; equivalently half the average nodal degree) for several commercial products such as mechanical toys, cordless screwdrivers, car and truck transmissions, and staple guns. Also shown are the theoretical maximum and minimum values for this metric for each product. It is notable that, with one exception discussed below, the products shown do not have nearly the connectivity that they theoretically could, based on how many nodes they have, if they were either random graphs or Albert-Barabási growth-preferential attachment scale free networks. In fact, the metric rarely takes on a value above 2. The reason for this is based on fundamentals of kinematics and is discussed below.
Figure 4 shows the distribution of average nodal degree for seven assemblies having from 10 to 54 parts. Due to the fact that assemblies can readily be decomposed into rational subassemblies, it is unlikely that a power law model can be fitted to mechanical
assemblies. Figure 4 is consistent with this prediction. Furthermore, it is unlikely that a power law could be found if an artificially large data set were constructed by, for example, combining all the parts and subassemblies of a car, because no highly connected hubs would emerge in such a model, due to the hierarchical way the
subassemblies were defined. That is, nodal degree is not likely to grow with the size of the network in such a case.
Liaisons per Part
0 2 4 6 8 10 12 14 16 18 Ballp oint Pe n Rea r Axl e Juic er Thro ttleb ody Seek er Elec tric I ron B&D Cord less Scre wdriv er 6 S peed Tran smissi on Tran saxl e Sear s C ordl ess Scre wdri ver Car Body Side Cuisi nart Mini Prep Che aper Stap ler Elect ric D rill Car Inst rume nt Pa nel Rugg ed S taple r Chin ese Pu zzle Liaisons/Part Min=(n-1)/n Max=(n-1)/2
Liaisons per Part
Figure 3. Network Connectivity Metric for Several Assemblies. [Whitney 2004] The
products in this chart have n = 10 to 30 parts or more, and the potential range of network connectivities is large: min: (n−1) / n; max: (n−1) / 2. But the maximum connectivity potential is not realized by any product surveyed with the exception of the “Chinese puzzle.” Connectivity is not related to the number of parts in the assembly. Data not shown on products with up to 250 parts follow the pattern shown here. The average network connectivity over all data collected by the author is about 1.67.
.
Nodal Degree of Seven Assemblies
0 10 20 30 40 50 60 1 2 3 4 5 6 7 8 9 10 11 Nodal Degree Frequency F requenc y
Figure 4. Frequency of Nodal Degree for Seven Assemblies Having 10 to 54 Parts.
The observed range of nodal degrees is much narrower than is seen in biological, ecological, or communication networks, for good fundamental reasons.
Figure 5 shows data from [Greer] on the network connectivity of a number of household products over several redesign generations. Each generation represents application of Design for Assembly principles, primarily simplification and part-count reduction, as well as aggressive cost reduction implemented by materials and process substitutions. Metals were replaced by polymers, discrete fasteners were replaced by flex hinges or adhesives, metal forming was replaced by injection molding, for example. While Greer was interested in the number of distinct parts needed to implement specific functions in these products (which fall steadily with each evolutionary stage) he also gathered
information on the number of parts and interfaces. Not only is the ratio of connections to parts similar to our data in Figure 3, but remarkably it is roughly constant over the
generations for each product. Thus Greer’s data is consistent with our own and demonstrates that this property extends across several design methodologies and materials choices.
Table 1 shows data on the network connectivity of 14 products gathered by [Van Wie et al.] These are household products similar to those surveyed by [Greer] and have a similar average nodal degree. The range of connectivity in these datasets is narrower than that in Figure 3 but is consistent overall.
PRODUCT # Parts #Branches #Branches/
#Parts Mini stapler 8 10 1.25 Pentel Forte 13 19 1.46 Side pencil 15 21 1.4 Swingline small 17 21 1.24 Swingline large 18 22 1.22 Kodak 47 53 1.13 Driving Force 56 60 1.07 DeWalt Drill 56 64 1.14 Skill Twist 57 67 1.18 Fuji 58 68 1.17 Conair Supermax 58 70 1.21 Remington Vortex 61 72 1.18 B&D Drill 68 87 1.28 Conair Quitetone 69 84 1.22 Average 1.225
0 0.5 1 1.5 2 2.5 Origi nal Evoluti on #1 Evol ution #2 Evoluti on #3 Evol ution #4 Number of Evolutions Li nk C o n n e ctivit y (In t. I n terfac es / # C o mpo n e n ts) BICYCLE 3-Bar BICYCLE 4-Bar ICE CREAM SCOOP TOOL CASE PENS STAPLE REMOVER CLOTHES HANGER BICYCLE BRAKE BOTTLE CAP CD CASE CLOTHES PIN FORCEPS COMPLIARS KITCHEN CLIP TOOL HOLDER WIRE STRIPPER
Figure 5. Data from [Greer] Showing Network Connectivity for Several Generations of the Same Product. Each later generation exhibits fewer parts and fewer parts per implemented function but roughly the same network connectivity. The average network connectivity for this data set is 1.24.
Figure 6 shows that the network connectivity of parts in assemblies having from 6 to 242 parts does not increase with the number of parts. In both real world scale free and
random networks, it is predicted that connectivity should grow with the number of nodes. [Albert and Barabási] For the data available, mechanical assemblies do not behave this way. Assemblies with more than 100 or 200 parts are rare, for reasons cited above. Figure 6 also shows visually the fact that, except for the Chinese Puzzle, network connectivities for these assemblies do not exceed ~2.1.
Liaisons/Part 0 1 2 3 4 5 6 7 0 50 100 150 200 250 300 Number of Parts Liaisons/Part Chinese Puzzle Paper Shredder V-8 Engine Many Consumer Products Rugged Stapler
Figure 6. Liaisons Per Part vs Number of Parts for 35 Mechanical Products. There is no correlation between the network connectivity of these assemblies and the number of parts in them. The Chinese Puzzle is an outlier for reasons discussed in the text. The average connectivity for this dataset is 1.55, close to the value for the V-8 Engine (1.58). Data in this figure are a combination of those gathered by the author and those in [Van Wie, et al].
Fundamental Limits on Network Connectivity in Assemblies [Whitney 2004]
Figure 3, Figure 5, Figure 6 and Table 1 show that typical assemblies do not have anywhere near the connectivity that they might. (Recall that large products are made of subassemblies having relatively few parts, so those in Figure 3, Figure 5, and Figure 6 are representative of subassemblies found in cars and airplanes, too.) To see a physical reason why, we begin by making the analogy between mechanical assemblies and kinematic mechanisms. All mechanisms are assemblies. While not all assemblies move in the sense that typical mechanisms do, assemblies nevertheless obey the same
fundamental principles of statics. Among the issues of concern in kinematics is the state of constraint of the assembly: is it under-constrained and thus capable of movement; is it “exactly” constrained, having just enough links to prevent motion; or is it
over-constrained, having more than enough links to prevent motion? The last case is
considered undesirable [Blanding][Whitehead] because it could result in locked-in stress in the assembly, leading to assembly difficulties or field failure. The implication is that constraint plays the role of a limit or cost related to adding arcs to a node, as suggested by [Amaral, et al] for other kinds of networks.
The Grübler criterion [Phillips] is typically used to determine the numerical value of the number of degrees of freedom M in a planar mechanism:
Equation 1 M =3 n
(
−g−1)
+∑
joint freedoms fi where n=number of parts g=number of jointsfi =degrees of freedom of joint i
If M >0, the mechanism has M under-constrained degrees of freedom. If M <0, the
mechanism has M more links than necessary to prevent motion. If M =0, the
mechanism is exactly constrained. If we define α to be the number of joints (liaisons) divided by the number of parts (equivalent to the average network connectivity) and define the average number of degrees of freedom allowed per joint as β, then we have
Equation 2 g=αn fi=gβ=αβn
∑
and M =3 n(
−αn−1)
+αβn M=αn(
β−3)
+3 n(
−1)
If the mechanism is to be exactly constrained, then M =0 and Equation 2 can be solved
for α to yield Equation 3 α = 3−3n n
(
β−3)
→ 3 3−β as n gets largeThis expression is based on assuming that the mechanism is planar. If it is spatial, then “3” is replaced by “6” and the equation is called the Kutzbach criterion, but everything else stays the same. Table 2 evaluates Equation 3 for both planar and spatial
mechanisms. Note that M is strictly increasing in α and β, and larger α and β also mean more complex parts and a more complex product.
ββββ αααα planar αααα spatial
0 1 1
1 1.5 1.2
2 3 1.5
Table 2. Relationship Between Number of Liaisons Per Part and Number of Joint Freedoms for Exactly Constrained Mechanisms (M=0).
Table 2 shows that α cannot be very large or else the mechanism will be
over-constrained. If a planar mechanism has several two degree-of-freedom joints (pin-slot, for example) then a relatively large number of liaisons per part can be tolerated. But this is rare in typical assemblies. Otherwise, the numbers in this table confirm the data in
Figure 3, Figure 5, and Figure 6. Most assemblies are exactly constrained or have one operating degree of freedom. Thus β=0 or β=1, yielding small values for α,
consistent with our data. The products in Figure 5 and Table 1 are simpler in most cases than those in Figure 3 so it is not surprising that the former have smaller average network connectivity than the latter.
Two products in Figure 6 have relatively large network connectivities, the rugged stapler and the paper shredder. Both of these products sustain large internal loads during normal operation, and considerable internal bracing is needed to support these loads without the mechanism distorting. It is likely that extra part interactions are included in these products to support these loads. The other products, except the V-8 engine, sustain relatively small internal loads.
Similarly, both the shredder and the V-8 engine exhibit limited hub-spokes structure. The shredder has two major hubs (the shafts that carry the cutters) while the engine has three (the cylinder block, cylinder head, and crankshaft, visible in Figure 1). The shredder shafts and the engine crankshaft and head are each associated with repeating internal structures (cutter pairs, piston-connecting-rod-bearing sets, and valve trains, respectively). The hubs in both products provide large operating forces and power to the items on the spokes. The cylinder block acts as a common attachment point for many other parts which typically need accurate locations with respect to the block but do not share large operating loads. Such items include manifolds, wires, pipes, pumps, etc. Thus the reasons for such assemblies having hubs can be explained functionally and physically in terms of typical needs of products that transmit significant power. These reasons are fundamentally different from the reasons behind the structure of systems typically studied for their network properties, which are mainly information-carrying systems or systems in which limits on the number of arcs that a node can support are less stringent. [Whitney 1996]
One product in Figure 3 and Figure 6 has an unusually high connectivity. This is a “Chinese puzzle,” an item with so many internal constraints that it has but one assembly sequence. Formally, the Chinese puzzle is multiply-over-constrained and would be impossible to assemble if it were not made with very loosely fitting joints. Such large joint clearances would not be feasible for products subject to constant use, large external and internal loads, and strict reliability and durability requirements. In this sense, the Chinese puzzle is the exception that proves the rule: both fundamental and practical constraints prevent mechanical assemblies from having network connectivities in ranges observed in other networks.
Conclusion
Mechanical assemblies are complex and can be represented as networks. They share many properties with other networks, but scale-free behavior is not one of them. Physical limits imposed by kinematics provide one reason for lack of scale-free behavior. In addition, designers of assemblies deliberately build them recursively from subassemblies. These subassemblies are limited in size, their complexity is concentrated within their
boundaries, and they are linked with relatively few liaisons. These properties favor ease of design, manufacture, field repair and upgrade, and overall robustness of mechanical products. Additional robustness is not gained in ways observed in the well-studied information-dominated networks, such as by use of many redundant connections or hub-spokes structures.
Acknowledgement
The author wishes to thank Prof Dan Braha of Technion for stimulating discussions regarding the applicability of complex network analysis techniques to assemblies as well as for suggesting that I make the calculation shown in Figure 4. He also thanks Dr James Greer for sharing his data in Figure 5 on network connectivity of parts in products over several redesign generations.
References
[Albert and Barabási] R. Albert and A-L Barabási, “Statistical Mechanics of Complex Networks,” Rev Mod Phys, 24, 47 (2002)
[Amaral et al] Amaral, L. A. N., Scala, A., Barthélémy, M., and Stanley, H. E., “Classes of Small-World Networks,” PNAS, vol 97, # 21, October 10, 2000, pp 11149–11152.
[Barabási] Barabási, Albert-Laszló. Linked : the new science of networks, Cambridge,
Mass: Perseus Pub., 2002
[Björke] O. Björke, Computer-Aided Tolerancing, ASME Press, 1989 [Blanding] D. Blanding, Exact Constraint Design, ASME Press, 2001 [Bourjault] A. Bourjault, “Contribution á une Approche Méthodologique de
l’Assemblage Automatisé: Elaboration Automatique des Séquences Opératoires,” Thesis to obtain Grade de Docteur des Sciences Physiques at l’Université de Franche-Comté, Nov, 1984
[Greer] Greer James L., “Effort Flow Analysis: A Methodology for Directed Product Evolution Using Rigid Body and Compliant Mechanisms,” PhD Dissertation, University of Texas at Austin, 2002
[Lee] H. Lee, “Effective Inventory and Service Management Through Product and Process Redesign,” Operations Research, vol 44, no 1, Jan-Feb 1996, pp 151-159. [Milo et al] R. Milo, S. Shen-Orr, S. Itzkovitz, N. Kashtan, D. Chklovskii, U. Alon, “Network Motifs: Simple Building Blocks of Complex Networks,” Science 298, 824 (2002)
[Nevins and Whitney] J. L. Nevins and D. E. Whitney eds., Concurrent Design of
Products and Processes, McGraw-Hill, 1989
[Nof, Wilhelm, and Warnecke] S. Nof, W. E. Wilhelm, and H.-J. Warnecke, Industrial
Assembly, Chapman & Hall, 1997
[Phillips] J. Phillips, Freedom in Machinery, (in two volumes), Cambridge: Cambridge University Press, 1984 (v 1) and 1989 (v 2).
[Van Wie et al] Van Wie, Mike J., Greer, James L., Campbell, Matthew I., Stone, Robert B., Wood, Kristin L., “Interfaces and Product Architecture,” ASME 2001 International Design Engineering Technical Conferences, September 9-12, 2001, Pittsburgh,
[Whitehead] T. N. Whitehead, The Design and Use of Instruments and Accurate
Mechanism, Dover Press, 1954.
[Whitney 1996] D E Whitney, “Why Mechanical Design Cannot Be Like VLSI Design,”
Research in Engineering Design, 8, 125 (1996)
[Whitney 2004] Whitney, D. E., Mechanical Assemblies: Their Design, Manufacture,

![Figure 5 shows data from [Greer] on the network connectivity of a number of household products over several redesign generations](https://thumb-eu.123doks.com/thumbv2/123doknet/14455821.519570/7.918.134.586.500.831/figure-greer-network-connectivity-household-products-redesign-generations.webp)
![Figure 5. Data from [Greer] Showing Network Connectivity for Several Generations of the Same Product](https://thumb-eu.123doks.com/thumbv2/123doknet/14455821.519570/8.918.139.788.110.544/figure-data-greer-showing-network-connectivity-generations-product.webp)


