HAL Id: inserm-01159354
https://www.hal.inserm.fr/inserm-01159354
Submitted on 3 Jun 2015HAL is a multi-disciplinary open access archive for the deposit and dissemination of sci-entific research documents, whether they are pub-lished or not. The documents may come from
L’archive ouverte pluridisciplinaire HAL, est destinée au dépôt et à la diffusion de documents scientifiques de niveau recherche, publiés ou non, émanant des établissements d’enseignement et de
Atomic Force Microscopy Mechanical Mapping of
Micropatterned Cells Shows Adhesion
Geometry-Dependent Mechanical Response on Local
and Global Scales.
Annafrancesca Rigato, Felix Rico, Frédéric Eghiaian, Mathieu Piel, Simon
Scheuring
To cite this version:
Annafrancesca Rigato, Felix Rico, Frédéric Eghiaian, Mathieu Piel, Simon Scheuring. Atomic Force Microscopy Mechanical Mapping of Micropatterned Cells Shows Adhesion Geometry-Dependent Me-chanical Response on Local and Global Scales.. ACS Nano, American Chemical Society, 2015, pp.11. �10.1021/acsnano.5b00430�. �inserm-01159354�
Atomic Force Microscopy Mechanical Mapping of
Micropatterned Cells Shows Adhesion
Geometry-Dependent
Mechanical Response on Local and
Global Scales
AUTHORS NAME Annafrancesca Rigato1
, Felix Rico1, Frédéric Eghiaian1, Mathieu Piel2 & Simon Scheuring1*
1 U1006 INSERM, Aix-Marseille Université, Parc Scientifique et Technologique de Luminy, 163
avenue de Luminy, 13009 Marseille, France
2 Institut Curie, UMR 144 CNRS/IC, 26 rue d’Ulm, 75248 Paris Cedex 05, France
KEYWORDS
Atomic force microscopy / Force mapping / Force spectroscopy / Cell elasticity / Cell mechanics / Micropatterns / Cell adhesion
ABSTRACT
In multicellular organisms cell shape and organization are dictated by cell or cell-extracellular matrix adhesion interactions. Adhesion complexes crosstalk with the cytoskeleton enabling cells to sense their mechanical environment. Unfortunately, most of cell biology studies, and cell mechanics studies in particular, are conducted on cultured cells adhering to a
physiological and reproducible conditions. Here, we grew cells on three different fibronectin patterns with identical overall dimensions but different geometries ( , T and Y), and investigated their topography and mechanics by atomic force microscopy (AFM). The obtained mechanical maps were reproducible for cells grown on patterns of the same geometry, revealing pattern-specific subcellular differences. We found that local Young’s moduli variations are related to the cell adhesion geometry. Additionally, we detected local changes of cell mechanical properties induced by cytoskeletal drugs. We thus provide a method to quantitatively and systematically investigate cell mechanics and their variations, and present further evidence for a tight relation between cell adhesion and mechanics.
Tissue development and maintenance relies on a continuous interplay between each cell and its environment, through both biochemical signals and physical cues. Through cell and cell-extracellular matrix contacts and interactions, cells are able to sense external forces and geometrical constraints.1–4 Such signals are fundamental to regulate cellular processes such as
differentiation, growth, division and even cell death.3,5–7 A quantitative characterization of cell
mechanics, and elasticity in particular, is thus fundamental to understand how structural and functional integrity of cells and tissues are maintained.6,8 The major contribution to cell elasticity
is provided by the cytoskeleton, and by actin filaments in particular.9,10 Several techniques have
been developed in the last decades to investigate cell mechanics,11 such as magnetic (MT)12–14
and optical tweezers (OT),15,16 the optical stretcher (OS),17 magnetic twisting cytometry
(MTC),12,16,18particle tracking microrheology (PTM),19–22 traction force microscopy (TFM),23,24
real-time deformability cytometry (RTDC),25 atomic force microscopy (AFM)26,27 and others.
Despite its low through-put compared to MT, OS, MTC or RTDC, AFM offers high spatial and force resolution over a wide range of forces and a controlled contact geometry. Additionally, AFM provides simultaneous topographical and mechanical characterization of living cells.28–30
Unlike MT, MTC or PTM, no probe binding or injection into the sample are needed and measurements are thus performed in physiological conditions. Moreover, AFM is suitable for both adherent and non-adherent cells.31,32
Improvements of AFM elasticity measurements, better understanding of contact geometry, as well as models accounting for the influence of sample thickness, set the standards in the field of cell mechanics.33–40 Although quantification of the elasticity by one single value measured in the
central region of cells has proven to give useful information, for example in the comparison of cancer and normal cells,41–43 local elasticity variations could not be detected in such experiments
and important information about the mechanics of subcellular structures was missed.44 Such
information is provided by AFM mechanical mapping, i.e. acquiring force-distance curves on each pixel of the image, thus allowing to identify subcellular regions characterized by specific stiffness associated with local structures.29,30,26,45,46 For example, nuclear versus peripheral
regions, or actin-rich versus actin-poor areas show differences in elasticity of up to four orders of magnitude, from tens of Pa to some hundreds of kPa.19,45,47–49 Moreover, local mechanical
characteristics have been attributed to specific cellular structures as tested by drug treatments.10,48,50,51 These may affect some cell areas (i.e. the structures present in these areas),
but leave others unaltered revealing structural and mechanical heterogeneity.
A major problem in the quantification of mechanical maps on cells is the lack of reproducible morphology in standard culture conditions. In fact, culture dishes represent an infinite, homogeneous surface on which cells undergo continuous structural and morphological rearrangements and never attain a defined state. The mechanical properties of cells reflect such variability, preventing a quantitative description of cell mechanics that takes into account subcellular differences in a systematic manner.
By growing cells on adhesive micropatterns, a well-defined and confined environment is imposed that drives cells to adopt regular shapes and cytoskeletal organization.4,52–55 Such
regularity allows us to investigate single cells, but also to average maps acquired on different cells, providing information on constant and reproducible cell features. Moreover, specific cellular processes such as division or migration could be controlled by defining the cell adhesion geometry, mimicking the spatial constraints that a cell is exposed to inside a tissue.53,54,56–58
local cell stiffness in relation to the remodeling rate of the CSK actin density and prestress, and provided evidence for a linear correlation between cell stiffness and prestress.59 Other groups
used AFM mechanical mapping to study cell elasticity dependence on parameters like cell spread area, substrate stiffness or actin distributions.60,61 Although important findings have been
achieved, a systematic method is still lacking which allows identifying preserved mechanical features and their precise location within the cell in relation to the adhesion geometry. The aim of this work was to show how cell mechanics are determined on a global and local level by the adhesive cell environment. This has been achieved through establishing a combined method of AFM-based mechanical mapping and averaging of elasticity maps of living cells confined on adhesive micro-patterns. This strategy allows a more quantitative and reproducible way of probing local mechanics of cells. By computing average elasticity maps of cells plated on three different patterns, we identified specific mechanical responses that depend on the adhesion geometry, on both global and local scales. Importantly, averaging mechanical maps allows us to distinguish local elasticity variations present at repetitive cell locations on each adhesion pattern, separating them from non-reproducible variations due to the intrinsic heterogeneity of cells. As a proof of concept, we perturbed the acto-myosin cytoskeleton of patterned cells with specific drugs and mapped their elasticity.
Results
Cell adhesion determines cell elasticity: To investigate how the adhesion geometry influences
cell global and local elasticity, RPE1 cells were plated on micropatterned glass-bottom culture dishes. The three micropatterns, , T and Y (Figure 1A), impose similar overall cell shapes, but provide different adhesion geometries. As a consequence, adhesion structures formed by the cells
(Figure 1B). Thick actin fibers and curved membrane borders are formed at concave pattern edges, as occur on the T- and Y-shaped patterns. On fully adhesive edges ( and top side of T) thinner fibers and straight membrane borders are formed.
AFM was operated in peak force quantitative nanomechanical mapping (PF-QNM) mode using cantilevers with nominal spring constant of ~ 0.1 N/m featuring a conical tip of 15 μm in height and half open angle of 11º. Single cell topography and elasticity maps were acquired of RPE1 cells plated on -, T-, and shaped fibronectin micropatterns (referred to as -, T- or Y-cells, n=16, 14, 18 respectively). Figure 1C reports cell topography images and vertical cross sections of single ‐, T‐ and Y‐ cells. The latter appear slightly shorter ~37 µm along the vertical axis compared to T- and ‐cells ~40 µm , as expected because of the concavity of the top border.
Two different strategies were applied for the characterization of the mechanics of micropatterned cells. On the one hand, we computed average maps (Figure 2A and B), which were obtained by calculating the mean value of each pixel after aligning single elasticity and topographical maps. Such average maps highlighted local elasticity features resulting from specific and reproducible responses of cells to a given adhesion pattern, and not due to single cells’ differences. On the other hand, we evaluated mechanical heterogeneity within each pattern group by calculating average elasticity histograms and coefficient of variation (CV) maps (Figure 3). These take into account both cell-to-cell and single cell intracellular heterogeneities. From average elasticity maps, histograms were plotted to evaluate average elasticity distributions (Figure 2C). Cells plated on a were overall softer (median at 32 kPa, 4.52 log (Pa)) than cells plated on T (34 kPa, 4.54 log (Pa)) while cells plated on Y were the stiffest (41 kPa, 4.61 log
(Pa)) (the observed differences of the three distributions were statistically significant according to Mann-Whitney U-test at 0.05% confidence level. Figure SI1 shows overlapped distributions and box plots). Other than presenting different median values, two regions could be identified in the histograms, which were not superposed in the three cases. In particular, the histogram of the average presented a unique region in the interval 25 – 32 kPa (4.4 -4.5 log (Pa)) and average Y histogram showed a characteristic region between 40 and 63 kPa (4.6 and 4.8 kPa). The average T histogram did not show unique features and compared to the and the Y, as expected because of its ‘mixed’ adhesion geometry (i.e. it includes both adherent and non-adherent borders). A superposition of the three distributions and a boxplot are reported in Figure SI1. On a local scale, average maps revealed patterned-specific mechanical features, as well as common features shared by the three cell groups. In the three cases high elasticity values (40 to 100 kPa) were found at the cell corners – i.e. where anchoring structures are located - and in the nuclear region. The remaining regions of the cells were soft on -cells, while T- and Y- cells presented additional stiff areas. In particular, high elastic moduli were measured at concave cell borders. Such stiff regions coincide with thick actin fibers (Figure 1B). T-cells showed higher elasticity on the upper periphery and along the vertical axis, while we measured two softer regions on the left and right interstices of the T along the concave edges. Y-cells presented only small soft regions localized along the three borders but not at their extreme peripheries, with values between 25 and 35 kPa. Along cell edges, at corners, in the central region and along the three arms of the Y, values span from 40 to 65 kPa. These results suggest a colocalization of stiff regions with the fibronectin patterns. To verify such correlation, we separately analyzed the elasticity contributions of adherent and non-adherent cell areas (Figure 2D). In the case of T- and Y-cells, the elasticity distributions of the cell regions above the patterns and of non-adhering
areas are significantly separated. Non-adherent cell areas were generally softer than attached ones, except for the very high values found in colocalization with the thick fibers found at concave cell edges. -cells presented less separated distributions, with both adherent and non-adherent regions showing values between 25-40 kPa (4.4 and 4.6 log (Pa)). A tail at higher values in the elasticity histogram of the adherent region was observed representing the contribution of the cell corners, while high elasticity of the non-adherent portion was attributed to the nuclear region. To rule out the hypothesis that these results were biased by the location of the nucleus on top of the pattern in T- and Y-cells and in the non-adherent region in -cells, we plotted separately the histograms of cell borders, corners and central region (Figure SI2). For all regions considered, we observed the same trend as the average distribution, with the -cells being the softest and the Y-cells the stiffest. The corners showed quite a large range of elasticity values in all three cases, with two main broad peaks, the one at stiffer values being more intense in the case of Y-cells. The central region, i.e. the area including the nucleus, showed a similar elasticity distribution as the whole-cell, slightly shifted to higher values in the case of -cells, and with a tail only at low values. Interestingly, the histogram of the edge regions presented the lowest values in all three cases, and a tail in the highest elasticity range (> 4.7 log (Pa), 50 kPa) in the case of T- and Y-cells.
Average elasticity histograms were obtained by averaging the bin values of the elasticity histograms of each individual cell map (Figure 3A). As all possible sources of elasticity variation, inter- and intracellular, are taken into account, large distributions are observed, spanning from a few kPa of softest regions to hundreds of kPa of actin-rich cell areas (Figure 3A). A narrower distribution compared to T- and Y- cells was observed for -cells, with one single peak at ~ 40 kPa. Two peaks (16 kPa and 79 kPa) were found in the case of T-cells,
and three (13, 40 and 250 kPa) in the case of Y-cells. This observation suggests that -cells have lower variability than T- and Y-cells. To further investigate the origin of this heterogeneity, coefficient of variation (CV) maps were calculated (Figure 3B). In the three cases, all CV values were below 0.25 with the highest CV values found at cell peripheries. Thus, average histograms and CV maps together provide information about the mechanical and structural cell-cell variability of the cells for each micro-pattern shape, as well as about the origin of local variations.
Perturbation of the acto-myosin cytoskeleton by Latrunculin-A: Latrunculin-A disrupts actin
filaments and causes cell softening.62 We used 1 µM Latrunculin-A to determine which
subcellular regions are more sensitive to its action. Mechanical mapping of single patterned cells before and after drug addition to the imaging medium illustrated dramatic changes of the cell mechanics (Figure 4). As expected, cells become softer as a consequence of the disruption of the actin skeleton (the experiment was performed on 3 cells per pattern, all reporting cell softening), but this change in the elastic properties did not involve the entire cell body. In fact, the mechanical properties of the nuclear region, as well as the adhesive regions, remained unaltered. On the contrary, as the actin cortex was disrupted, non-adherent peripheral regions underwent drastic changes. In particular, the thick stress fibers present at concave edges in the case of T- and Y-cells were depolymerized, and the cells lost their shape and retracted to the adhesive surfaces only (Figure SI3). These morphological changes were accompanied by cell softening by a factor of about 10 in the peripheral regions. In detail, non-adhering edges of T- and Y-cells (with initial stiffness around 100 kPa) collapsed, and their elasticity contribution shifted from 100 to 10 kPa, while the peak elasticity corresponding to the nucleus remained constant at ~40 kPa. -cells showed similar changes in the mechanical properties, with the nuclear region
maintaining its characteristic elasticity, while the surrounding regions presented drastic softening. Morphological changes were also less pronounced because the adhesion structures were present all along the adhesive -pattern. T-cells presented similar behavior to Y-cells at concave edges and similar to -cells at the straight edge.
Perturbation of the acto-myosin cytoskeleton by Blebbistatin: Blebbistatin binds to Myosin II
and blocks it in a conformation with low affinity for actin, which results in a reduction of crosslinking of actin filaments.63 As a consequence, intracellular tension is released, the cell
retracts and its elastic modulus decreases.10 We treated cells with 20 μM Blebbistatin, and
monitored the change of the elastic modulus by mechanical mapping before and after drug addition (Figure 5). We observed a retraction of non-attached cell borders, and a 5-fold overall softening. Again, while the nuclear region maintained its elasticity value, stronger effects were found for peripheral regions, with an elasticity decrease of about 10 times.
Discussion
By growing cells on adhesive micropatterns and mapping their mechanical properties by AFM, we show that adhesion geometry triggers specific mechanical properties at both local and global scales. In particular, by using -, T- and Y-shaped fibronectin micropatterns, which share the distance between the extremities but differ in the adhesive geometry, we show that the mechanical response of cells varies driven by the localization of their adhesion sites. We performed PF-QNM AFM to obtain mechanical maps on single micropatterned cells. It is important to note that the thickness of the patterns themselves does not affect the mechanics of the cells: as measured with the AFM, the fibronectin layer is only a few nanometers thick (Figure SI4). All measurements were performed using a rectangular cantilever with a nominal spring constant of 0.1 N/m and a 15 μm high conical tip (Figure SI5). These features combine good lateral resolution with well-defined tip geometry. Moreover, using such a very high tip reduces the influence of the viscous drag on the measurements. In PF-QNM AFM the average indentation velocity at which force curves are acquired (~1200 µm/s) is higher than conventional force curves (in the µm/s range). This leads to measured Young’s moduli in the tens-of-kPa range, slightly higher than at slower velocity due to the viscoelastic response of living cells.45,47,48,64–67 To corroborate this, we performed elasticity measurements at varying velocities
(Figure SI6), in agreement with previous reports.64,67 Measurements on the central part of
-cells at 5, 25, 50 and 100 μm/s yielded Young’s moduli of 9.6 ± 3.0, 9.7 ± 2.9, 14.7 ± 1.5 and 16.1 ± 0.5 kPa (geometric mean ± standard deviation), respectively, while the value obtained in Peak Force is of 32 ± 1.5 kPa (mean value obtained from the log-scale average).
below 15% in all three cases (Figure 3B). The medians of the Young’s modulus distributions of the average maps (Figure 2) were 32 kPa, 34 kPa and 41 kPa, for -, T- and Y- respectively. Interestingly, previous studies on cells patterned on adhesive disks and squares reported increasing Young’s moduli with increased adhesion areas.60,61 This is a direct consequence of the
cell spreading on larger patterns and in agreement with our measurements of non-patterned RPE1 cells, which are free to spread on very large areas and present Young’s moduli 10-times higher than our patterned cells (Figure SI7). Our measurements show highest Young’s moduli in the case of Y-cells, and lowest in the case of -cells, though the Y-pattern provides an adhesive area of ~400 μm2 and the - pattern ~800 μm2. In our experiments the cells have constant size,
and the adhesion geometry - not variable spreading - is at the origin of the mechanical differences. In general, decreasing the peripheral adhesion area leads to a decrease of focal adhesions at the cell borders, resulting in the appearance of concave cell edges.68 Such concavity
is the result of a membrane-cortex-induced inward pulling force that is counterbalanced by thick actin fibers, which appeared as high Young’s modulus regions in our mechanical maps. The tensegrity model and the prestress hypothesis are in accordance with our observation,18,69–72 as
they predict a higher overall stiffness of the cells in response to the high tension created by acto-myosin fibers. Such tension is inversely dependent on the number of available anchoring points59,73,74, which is consistent with the stiffness order < T < Y obtained from our
measurements. Since elasticity variations of a group of cells are due to intracellular and intercellular differences, we investigated heterogeneities by two different approaches. Average histograms reported in Figure 3A show the broadest distributions for cells plated on Y-patterns, and the narrowest for cells grown on ∇-patterns. Similarly, CV maps (Figure 3B) present higher variations both locally and globally for Y-, and lower for -cells. Nevertheless, CVs were small
in the three cases. Thus, combining the results of such analysis suggests that the higher variability observed for Y and T-cells is mainly due to cell-to-cell mechanical heterogeneity. In particular, highest CVs are found at concave borders of T- and Y-cells, which are also the stiffest regions and probably where local cytoskeletal organization is more uneven. In agreement with these results, a high variability of actin bundle strength, (i.e. variability of the curvature radius) at concave cell borders was shown.75 In contrast, peripheral adhesion sites provided by patterns
counterbalance acto-myosin tension, and exhibit a more controlled and reproducible structure and mechanical response. Namely, it is easier and more reproducible to regulate the prestress if the perimeter of the cell is adhering.
The tensegrity and prestress models apply well also to the results we obtained from the Latrunculin-A and Blebbistatin addition experiments. When disrupting actin fibers with Latrunculin-A (Figure 4), we measured an overall ~10-fold decrease of the Young’s modulus, and a drastic collapse of the cell structure. The most dramatic effect was observed at concave borders of Y- and T-cells, where the line tension keeping the cell shape at borders was released, thus leaving membrane tension and adhesive forces alone as cell shape determinants. This results in the reduction of the area covered by the cell exclusively to the adhesive areas. -cells show less dramatic effect on their morphology, i.e. cell edges remain attached to the pattern border, but show a softening of comparable magnitude. Similarly, Myosin II inhibition with Blebbistatin lead to the release of tension in the acto-myosin fibers (Figure 5), which resulted in a dramatic increase of edge concavity in T- and Y- cells, along with a 5-fold decrease of cell elasticity. Interestingly, softening induced by both Latrunculin-A and Blebbistatin concerned peripheral areas but not as much the nuclear region. These observations suggest that the mechanical properties of the nucleus do not dependent on the actin cytoskeleton. Moreover, in non-patterned
cells, overall much stiffer than patterned cells, the nucleus presented Young’s moduli close to that of patterned cells (Figure SI7). Previous works showed no significant alteration of the nuclear shape after actin filament disruption by Cytochalasin D76 corroborating the hypothesis
that the physical properties of the nucleus are mainly determined by the nuclear lamina.77 These
results suggest that conventional cell elasticity measurements should be performed on areas near but not on the nucleus, especially if a difference is to be probed after drug treatment. They further highlight the usefulness of the presented approach to precisely control the cell morphology and where the measurements are performed.
Conclusion
In this work we perform AFM-based mechanical mapping on cells plated on micropatterns and we show that these yield a pattern-specific reproducible mechanical response. A fundamental advantage of the proposed method is the possibility of obtaining average elasticity maps. These average maps allow us to specifically locate intracellular elasticity differences, which are maintained among cells and to identify regions characterized by higher or lower mechanical stability. Our data show that cells adapt the mechanical properties of subcellular regions according to the adhesion geometry, providing unique information about the relation of cells’ mechanical properties to their adhesive environment. Our results showed that adhesive cell borders provide mechanical stability and homogeneity within the cell. On the contrary, concave cell shapes, due to a lack of peripheral adhesion, induce high tension in the cytoskeleton and higher mechanical heterogeneity. Three general rules can thus be formulated: 1) at locations where cells adhere to the patterns, high Young’s moduli are to be expected, due to the higher concentration of actin structures; 2) in the absence of adhesive borders, the cell is obliged to
mechanical maps as very stiff regions. 3) In non-adherent cell areas, no cytoskeletal structure can be anchored, thus intracellular tension is low and, consequently, low elasticity values are found in these regions. Importantly, our findings suggest that cell stiffness is not always higher, the larger the adhesive area. We also showed that perturbation of specific cytoskeletal components affects cell mechanics in different ways depending on the local actin structure and adhesive geometry, suggesting that tension is concentrated on concave cell borders. This deepens our understanding of the role of specific cytoskeletal components, as well as the interdependence of intracellular elements, in the maintenance of cell morphological and mechanical integrity. Therefore, the combination of micropatterns, AFM mechanical mapping and image averaging constitutes a promising approach to investigate the mechanical heterogeneity of individual cells and the mechanics of subcellular components.
Material and Methods
Microcontact printing: PDMS stamps were washed in milliQ water and sonicated 15 min in
pure ethanol, let dry and incubated with 50 μM Fibronectin (Sigma-Aldrich F1141), 5 μM
Fibrinogen-A488 (green, Invitrogen) in 100 mM NaHCO3 (pH 8.6) for 45 min at room
temperature. The solution was then aspired and the stamps let dry for 10 sec under the hood, placed on glass-bottom culture dishes (GWSt-5040, Willcowells), gently pressed and removed after 10 min. Non-printed areas were then passivated by 1h incubation with 1 ml PEG-poly-L-Lysine (Surface Solutions) 0.1 mg/ml in 10 mM HEPES (pH 7.4). The dishes were then repeatedly washed in PBS 78.
Cell culture: hTERT-RPE1 cells (infinity telomerase-immortalized Retinal Pigment Epithelial
human cell line) were cultured in Dulbecco’s modified Eagle’s medium (DMEM, GIBCO) supplemented with 10% fetal calf serum (FBS, GIBCO). Cells were cultured at 37 °C in a 5% CO2 incubator. For plating on the micropatterns, cells where detached with 0.02% EDTA,
centrifuged, resuspended in warm culture medium and plated on the patterned culture dishes at a concentration of 50000 cells/ml. Unattached cells were washed after 15-20 min with equilibrated medium.
Atomic force microscopy: All experiments were conducted using a Bioscope Catalyst (Bruker,
Santa Barbara, CA, USA) mounted on an inverted optical microscope (Olympus, Japan). Trace and retrace images of topography and Young’s modulus were acquired in peak force tapping (PFt) mode with a setpoint peak force of 750 pN and an oscillation frequency of 0.5 kHz. Rectangular cantilevers with a nominal spring constant of 0.1 N/m and a 15 μm high conical tip with 60 nm tip radius and 32° open angle (CSG11, NT-MDT, Moscow, Russia) (Figure SI7)
were used for all measurements. Cantilever spring constant and sensitivity were calibrated before each experiment using the thermal fluctuation method 79,80. Tip height, radius and angle where
verified by scanning electron microscopy (Figure SI8). For mechanical mapping, typical acquisition time was of about 10 min per image, using a scan rate of 0.45 Hz and an image size of 256 x 256 pixels (scan size: 55 μm). We report 256 x 256 pixels mechanical maps with elasticity values computed by the AFM control software. Young’s moduli were calculated according to the elastic contact model for conical indenters (named Sneddon in the software):
2
∙ ∙ tan
1 ∙δ
(1), where F is the measured force, E the elastic modulus, α the half-opening angle of the tip, δ the indentation and v the sample’s Poisson’s ratio, assumed to be 0.5. 30% and 90% of the maximum force were set as force fit boundaries. Elasticity map values were corrected for the bottom effect (see Image analysis section). To confirm the accuracy of the software in the determination of the elasticity values, we acquired mechanical maps at 128 x 128 pixels, allowing simultaneous recording of each force curve. Young’s moduli obtained with a custom algorithm based on Matlab (Mathworks, Natick, MA), but with the same parameters used by the software, were in good agreement with the moduli obtained by the software (Figure SI9). For drug time–lapse experiments, the image size was reduced to 128 x 128 pixels, to allow faster acquisition times (5-6 min at a scan rate of 0.3-0.35 Hz).
Elasticity values from mechanical maps were also compared to conventional force-distance curves at 1, 5, 10, 20 Hz, with a ramp size of 2.5 µm and a maximum deflection threshold of 3 nm for 1 and 5 Hz, 10 nm for 10 and 20 Hz (Figure SI6).
All measurements were conducted in CO2-indipendent Leibovitz-L15 medium supplied with
10% FBS. To account for evaporation, medium was regularly replaced.
Latrunculin-A and Blebbistatin addition: Drugs directed against the actin cytoskeleton
(Latrunculin-A, Blebbistatin) were used to investigate the contribution to cell elasticity provided by actin and myosin II, respectively. Drugs were solubilized in DMSO to a mother solution, then diluted to a volume of 500 µl in warm medium, added to the culture dish to obtain the desired final concentration (1 µM for Latrunculin-A, 20 µM for Blebbistatin). To avoid concentration gradients due to slow diffusion of the drug, the medium was mixed several times after drug addition. To exclude non-specific effects due to DMSO toxicity, control experiments with DMSO alone were conducted (Figure SI10).
Image analysis: All images were analyzed using self-written programs in Matlab (The
MathWorks, Natick, MA). In brief, a black and white mask was obtained for each set of images by applying the hysteresis threshold algorithm to the topography image, an edge detection method that sets the cell border where neighboring pixels values deviate from the values of the flat sample support. Masked topography images were used to rotate all images and align them by cross-correlation. The mask was equally applied to the elasticity maps to calculate the individual stiffness histograms. The average images were then calculated from the rotated and translated images without excluding background pixels and considering both trace and retrace data. An average mask was then calculated on the average height image in the same way as for individual images and the histograms of the average image calculated. Stiffness maps were corrected for the bottom effect according to the model by Chadwick and Gavara 37:
2 ∙ tan
∙ 1 δ ∙ 1 1.7795
2
16 1.7795
(2), where h was the height at each pixel of the topography image. As previously shown, this effect is relevant only for thin regions of the cells, in our case at the cell borders 34,81. Average
elasticity histograms (Figure 3A) where obtained by first calculating each single cell’s histogram, and then averaging the bin heights of all single-histograms, previously normalized on the number of pixels. This procedure differs from simply pooling all pixels values from all cells in that bin height averaging and normalization allow to represent the data independently of the sample size (number of cells) and on single cells’ spread area (number of pixels). The latter is negligible in the case of patterned cells, but relevant in the case of non-patterned cells.
Force curve analysis: Conventional force-distance curves were analyzed using self-written
programs in Matlab. The contact elastic model for conical indenters was used to determine the Young’s modulus (Eq. 1). No bottom-effect correction was applied in this case as measurements were performed on the top of the cell, where the deformation/height ratio is small (~10%). The values reported in Figure SI6 correspond to the geometric mean of the Young-s moduli obtained on four different cells, to allow the comparison with the Young’s modulus of the average log-scale map in Figure 2B.
FIGURES
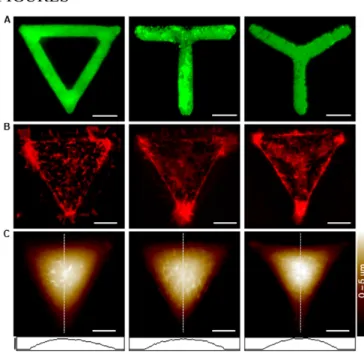
Figure 1. Example of individual RPE1 cells plated on ∇-, T-, Y-shaped Y fibronectin
micropatterns (left to right).
Horizontal scale bar is 10 µm, vertical scale bar in C is 5 µm. A. Fibronectin-fibrinogen-GFP ∇-, T- and Y-shaped micropatterns.
B. Fluorescence microscopy image of individual actin-labeled (mCherry-lifeAct) RPE1 cells plated on the micropatterns shown in A. In the three cases, actin-rich regions are visible at the vertices. Thick actin stress fibers are present at the concave, non-adhering borders of T- and Y-shape micropatterns, while thinner structures are visible along the straight, adhering borders of
-micropatterned cells.
C. AFM topography images of the same individual RPE1 cells showed in B and, at the bottom, cross-section along the vertical axis (dotted line) The cell plated on the Y-pattern is slightly shorter (~37 µm) than those on the - and T-patterns (~40 µm), as expected because of the
concavity of its top border. Interestingly, the Y-cell is higher (~5 µm) than the -cell (~ 4.5), suggesting that cell volume is independent from the pattern shape.
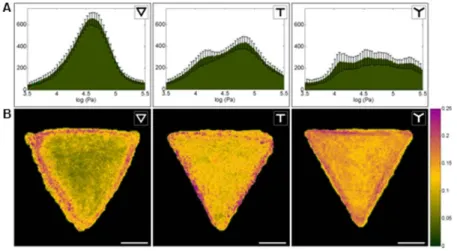
Figure 2. Average Young’s moduli of RPE1 cells.
A. Average topography of RPE1 cells plated respectively on a ∇ (n=16), T (n=14), Y (n=18)-shaped fibronectin micropatterns. Scale bar is 10 μm.
B. Average stiffness maps in log (Pa) of RPE1 cells plated respectively on a ∇ (n=16), T (n=14), Y (n=18)-shaped fibronectin micropatterns. Maps were obtained by aligning and averaging pixel-by-pixel single-cell maps obtained in Peak Force mode. The color scale corresponds to the values of the histograms shown in b (black= 4.2 log (Pa), yellow= 5 log (Pa)).
C. Histograms of the average maps shown in a.
D. Histograms of the average of the whole average stiffness map (black line), cell area adherent to the fibronectin pattern (purple line), and non-adherent cell area (yellow line).
Scale bar = 10 μm.
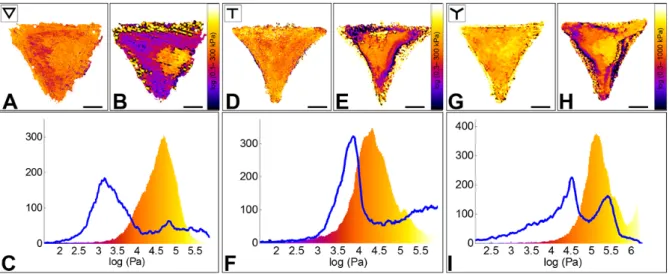
Figure 3. Evaluation of elasticity heterogeneity within cells plated on ‐ (n=16), T- (n=14), Y- (n=18) shaped fibronectin micropatterns.
A. Averaged elasticity histograms calculated by averaging the bin values of each single-cell elasticity histogram. Error bars correspond to the standard error of the mean. The distributions show that cells plated on a ∇ present the lowest variability, while the ones plated on a Y the highest. B. Coefficient of variation maps of log (E) maps shown in Fig. 2 of RPE1 cells plated on ∇ (n=16), T (n=14), Y (n=18)-shaped fibronectin micropatterns. Coefficient of variation (CV) maps were calculated by dividing the standard deviation of each pixel by its corresponding average value. The medians of CV maps were 0.10, 0.13, and 0.15 for ∇ -, T - and Y-cells respectively.
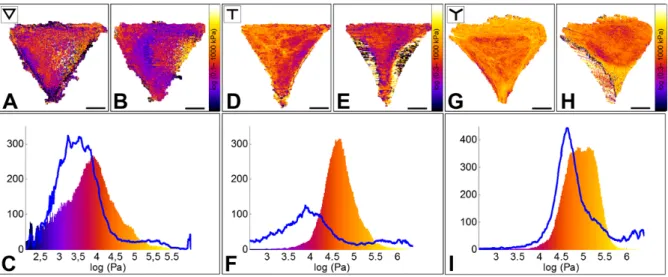
Figure 4. Effect of Latrunculin-A on the Young’s modulus of RPE1 cells plated on ∇ -, T -
and Y micropatterns.
A, D, G. Elasticity maps of single cells plated, respectively, on a ∇-, T- and Y- shaped micropatterns before Latrunculin A addition.
B, E, H. Elasticity maps of the same cells ~20 minutes after drug addition.
C, F, I. Elasticity distribution of the same cells before (color-coded histogram) and after drug addition (blue line). In the three cases, the cells show a 10-fold Young’s modulus decrease,
which involves mostly peripheral regions of the cells. On the contrary, the nuclear area seems less affected by actin disruption.
Figure 5. Effect of Blebbistatin (-) on the Young’s modulus of RPE1 cells plated on ∇ -, T -
and Y micropatterns.
A, D, G. Elasticity maps of single cells plated, respectively, on a ∇-, T- and Y- shaped micropatterns before Blebbistatin addition.
B, E, H. Elasticity maps of the same cells ~40 min after drug addition.
C, F, I. Elasticity distribution of the same cells before (color-coded histogram) and after drug addition (blue line). Cells show a 5 to 10-fold decrease of the Young’s modulus. Such decrease is observed in the peripheral regions, but not on the nucleus, which appears to maintain its elastic properties after the disruption of acto-myosin fibers, similarly to what observe after Latrunculin A injection.
ASSOCIATED CONTENT
Supporting Information Available: Elasticity repartition of cell areas (histograms),
AFM-optical microscope setup, examples of force-distance curves extracted from maps on patterned cells, plot showing the dependence of the Young’s modulus on the measurement frequency, AFM topography images of the fibronectin patterns, elasticity of non-patterned RPE1 cells (maps and average histogram), time-lapse control experiment with DMSO, SEM image of an NT-MDT CSG11 AFM probe. This material is available free of charge via the Internet at http://pubs.acs.org.
AUTHOR INFORMATION
Corresponding Author:
* Correspondence should be addressed to Simon Scheuring Email: simon.scheuring@inserm.fr
Tel.: ++33-4-91828777, Fax: ++33-4-91828701
Author Contributions: The manuscript was written through contributions of all authors. All
authors have given approval to the final version of the manuscript.
Funding Sources: This work was funded by the ANR grants Labex INFORM
(ANR-11-LABX-0054) of the A*MIDEX program (ANR-11-IDEX-0001-02), and a European Research Council (ERC) Starting Grant (#310080).
ACKNOWLEDGMENT
REFERENCES
(1) Wang, J. H.-C.; Thampatty, B. P. An Introductory Review of Cell Mechanobiology. Biomech.
Model. Mechanobiol. 2006, 5, 1–16.
(2) Gumbiner, B. M. Cell Adhesion: The Molecular Basis of Tissue Architecture and Morphogenesis.
Cell 1996, 84, 345–357.
(3) Vogel, V.; Sheetz, M. Local Force and Geometry Sensing Regulate Cell Functions. Nat. Rev. Mol.
Cell Biol. 2006, 7, 265–275.
(4) Chen, C. S. Geometric Control of Cell Life and Death. Science (80-. ). 1997, 276, 1425–1428. (5) Engler, A. J.; Sen, S.; Sweeney, H. L.; Discher, D. E. Matrix Elasticity Directs Stem Cell Lineage
Specification. Cell 2006, 126, 677–689.
(6) Fletcher, D. A.; Mullins, R. D. Cell Mechanics and the Cytoskeleton. Nature 2010, 463, 485–492. (7) Schwarz, U. S.; Gardel, M. L. United We Stand: Integrating the Actin Cytoskeleton and
Cell-Matrix Adhesions in Cellular Mechanotransduction. J. Cell Sci. 2012, 125, 3051–3060.
(8) Plodinec, M.; Loparic, M.; Monnier, C. a; Obermann, E. C.; Zanetti-Dallenbach, R.; Oertle, P.; Hyotyla, J. T.; Aebi, U.; Bentires-Alj, M.; Lim, R. Y. H.; et al. The Nanomechanical Signature of Breast Cancer. Nat. Nanotechnol. 2012, 7, 757–765.
(9) Salbreux, G.; Charras, G.; Paluch, E. Actin Cortex Mechanics and Cellular Morphogenesis. Trends
Cell Biol. 2012, 22, 536–545.
(10) Martens, J. C.; Radmacher, M. Softening of the Actin Cytoskeleton by Inhibition of Myosin II.
Pflugers Arch. 2008, 456, 95–100.
(11) Kollmannsberger, P.; Fabry, B. Linear and Nonlinear Rheology of Living Cells. Annu. Rev. Mater.
Res. 2011, 41, 75–97.
(12) Bausch, a R.; Ziemann, F.; Boulbitch, a a; Jacobson, K.; Sackmann, E. Local Measurements of Viscoelastic Parameters of Adherent Cell Surfaces by Magnetic Bead Microrheometry. Biophys. J. 1998, 75, 2038–2049.
(13) Kollmannsberger, P.; Fabry, B. High-Force Magnetic Tweezers with Force Feedback for Biological Applications. Rev. Sci. Instrum. 2007, 78.
(14) Tanase, M.; Biais, N.; Sheetz, M. Magnetic Tweezers in Cell Biology. Methods Cell Biol. 2007,
83, 473–493.
(16) Laurent, V. M.; Hénon, S.; Planus, E.; Fodil, R.; Balland, M.; Isabey, D.; Gallet, F. Assessment of Mechanical Properties of Adherent Living Cells by Bead Micromanipulation: Comparison of Magnetic Twisting Cytometry vs Optical Tweezers. J. Biomech. Eng. 2002, 124, 408–421.
(17) Guck, J.; Ananthakrishnan, R.; Mahmood, H.; Moon, T. J.; Cunningham, C. C.; Käs, J. The Optical Stretcher: A Novel Laser Tool to Micromanipulate Cells. Biophys. J. 2001, 81, 767–784. (18) Chen, J.; Wang, N.; Tolic, I. M. V. A. M.; Mijailovich, S. M.; Butler, J. P.; Fredberg, J. J.;
Stamenovic, D.; Tolić-Nørrelykke, I. M.; Stamenović, D. Cell Prestress . I . Stiffness and Prestress Are Closely Associated in Adherent Contractile Cells. Am. J. Physiol. Cell Physiol. 2002, 02115, 606–616.
(19) Yamada, S.; Wirtz, D.; Kuo, S. C. Mechanics of Living Cells Measured by Laser Tracking Microrheology. Biophys. J. 2000, 78, 1736–1747.
(20) Tseng, Y.; Kole, T. P.; Wirtz, D. Micromechanical Mapping of Live Cells by Multiple-Particle-Tracking Microrheology. Biophys. J. 2002, 83, 3162–3176.
(21) Jonas, M.; Huang, H.; Kamm, R. D.; So, P. T. C. Fast Fluorescence Laser Tracking Microrheometry, II: Quantitative Studies of Cytoskeletal Mechanotransduction. Biophys. J. 2008,
95, 895–909.
(22) Wirtz, D. Particle-Tracking Microrheology of Living Cells: Principles and Applications. Annu.
Rev. Biophys. 2009, 38, 301–326.
(23) Dembo, M.; Wang, Y. L. Stresses at the Cell-to-Substrate Interface during Locomotion of Fibroblasts. Biophys. J. 1999, 76, 2307–2316.
(24) Wang, J. H. C.; Lin, J. S. Cell Traction Force and Measurement Methods. Biomech. Model.
Mechanobiol. 2007, 6, 361–371.
(25) Otto, O.; Rosendahl, P.; Mietke, A.; Golfier, S.; Herold, C.; Klaue, D.; Girardo, S.; Pagliara, S.; Ekpenyong, A.; Jacobi, A.; et al. Real-Time Deformability Cytometry: On-the-Fly Cell Mechanical Phenotyping. Nat. Methods 2015, 12.
(26) Radmacher, M.; Tillamnn, R. W.; Fritz, M.; Gaub, H. E. From Molecules to Cells: Imaging Soft Samples with the Atomic Force Microscope. Science 1992, 257, 1900–1905.
(27) Radmacher, M.; Tillmann, R. W.; Gaub, H. E. Imaging Viscoelasticity by Force Modulation with the Atomic Force Microscope. Biophys. J. 1993, 64, 735–742.
(28) Goldmann, W. H.; Galneder, R.; Ludwig, M.; Xu, W.; Adamson, E. D.; Wang, N.; Ezzell, R. M. Differences in Elasticity of Vinculin-Deficient F9 Cells Measured by Magnetometry and Atomic Force Microscopy. Exp. Cell Res. 1998, 239, 235–242.
(29) A-Hassan, E.; Heinz, W. F.; Antonik, M. D.; D’Costa, N. P.; Nageswaran, S.; Schoenenberger, C. a; Hoh, J. H. Relative Microelastic Mapping of Living Cells by Atomic Force Microscopy.
(30) Radmacher, M.; Fritz, M.; Kacher, C. M.; Cleveland, J. P.; Hansma, P. K. Measuring the Viscoelastic Properties of Human Platelets with the Atomic Force Microscope. Biophys. J. 1996,
70, 556–567.
(31) Wojcikiewicz, E. P.; Zhang, X.; Chen, A.; Moy, V. T. Contributions of Molecular Binding Events and Cellular Compliance to the Modulation of Leukocyte Adhesion. J. Cell Sci. 2003, 116, 2531– 2539.
(32) Rico, F.; Chu, C.; Abdulreda, M. H.; Qin, Y.; Moy, V. T. Temperature Modulation of Integrin-Mediated Cell Adhesion. Biophys. J. 2010, 99, 1387–1396.
(33) Lehenkari, P. P.; Charras, G. T.; Nykänen, a; Horton, M. a. Adapting Atomic Force Microscopy for Cell Biology. Ultramicroscopy 2000, 82, 289–295.
(34) Domke, J.; Radmacher, M. Measuring the Elastic Properties of Thin Polymer Films with the Atomic Force Microscope. Langmuir 1998, 14, 3320–3325.
(35) Radmacher, M. Measuring the Elastic Properties of Living Cells by the Atomic Force Microscope.
Methods Cell Biol. 2002, 68, 67–90.
(36) Vargas-Pinto, R.; Gong, H.; Vahabikashi, a; Johnson, M. The Effect of the Endothelial Cell Cortex on Atomic Force Microscopy Measurements. Biophys. J. 2013, 105, 300–309.
(37) Chadwick, R. S.; Gavara, N.; Chadwick, R. S. Determination of the Elastic Moduli of Thin Samples and Adherent Cells Using Conical Atomic Force Microscope Tips. Nat. Nanotechnol. 2012, 7, 733–736.
(38) Rico, F.; Roca-Cusachs, P.; Gavara, N.; Farré, R.; Rotger, M.; Navajas, D. Probing Mechanical Properties of Living Cells by Atomic Force Microscopy with Blunted Pyramidal Cantilever Tips.
Phys. Rev. E 2005, 72, 021914.
(39) Chiou, Y.-W.; Lin, H.-K.; Tang, M.-J.; Lin, H.-H.; Yeh, M.-L. The Influence of Physical and Physiological Cues on Atomic Force Microscopy-Based Cell Stiffness Assessment. PLoS One 2013, 8, e77384.
(40) Dimitriadis, E. K.; Horkay, F.; Maresca, J.; Kachar, B.; Chadwick, R. S. Determination of Elastic Moduli of Thin Layers of Soft Material Using the Atomic Force Microscope. Biophys. J. 2002, 82, 2798–2810.
(41) Xu, W.; Mezencev, R.; Kim, B.; Wang, L.; McDonald, J.; Sulchek, T. Cell Stiffness Is a Biomarker of the Metastatic Potential of Ovarian Cancer Cells. PLoS One 2012, 7, e46609.
(42) Cross, S. E.; Jin, Y.-S.; Rao, J.; Gimzewski, J. K. Nanomechanical Analysis of Cells from Cancer Patients. Nat. Nanotechnol. 2007, 2, 780–783.
(43) Lekka, M.; Laidler, P.; Gil, D.; Lekki, J.; Stachura, Z.; Hrynkiewicz, A. Z. Elasticity of Normal and Cancerous Human Bladder Cells Studied by Scanning Force Microscopy. Eur. Biophys. J. 1999, 28, 312–316.
(44) Heidemann, S. R.; Wirtz, D. Towards a Regional Approach to Cell Mechanics. Trends Cell Biol. 2004, 14, 160–166.
(45) Hofmann, U. G.; Rotsch, C.; Parak, W. J.; Radmacher, M. Investigating the Cytoskeleton of Chicken Cardiocytes with the Atomic Force Microscope. J. Struct. Biol. 1997, 119, 84–91.
(46) Raman, A.; Trigueros, S.; Cartagena, A.; Stevenson, A. P. Z.; Susilo, M.; Nauman, E.; Contera, S. A. Mapping nanomechanical properties of live cells using multi-harmonic atomic force microscopy.
(47) Guo, Q.; Xia, Y.; Sandig, M.; Yang, J. Characterization of Cell Elasticity Correlated with Cell Morphology by Atomic Force Microscope. J. Biomech. 2012, 45, 304–309.
(48) Hoffman, B. D.; Massiera, G.; Van Citters, K. M.; Crocker, J. C. The Consensus Mechanics of Cultured Mammalian Cells. Proc. Natl. Acad. Sci. U. S. A. 2006, 103, 10259–10264.
(49) Mahaffy, R. E.; Park, S.; Gerde, E.; Käs, J.; Shih, C. K. Quantitative Analysis of the Viscoelastic Properties of Thin Regions of Fibroblasts Using Atomic Force Microscopy. Biophys. J. 2004, 86, 1777–1793.
(50) Petersen, N. O.; McConnaughey, W. B.; Elson, E. L. Dependence of Locally Measured Cellular Deformability on Position on the Cell, Temperature, and Cytochalasin B. Proc. Natl. Acad. Sci. 1982, 79, 5327–5331.
(51) Rotsch, C.; Braet, F.; Wisse, E.; Radmacher, M. AFM Imaging and Elasticity Measurements on Living Rat Liver Macrophages. Cell Biol. Int. 1997, 21, 685–696.
(52) Xia, Y.; Whitesides, G. M. SOFT LITHOGRAPHY. Annu. Rev. Mater. Sci. 1998, 28, 153–184. (53) Théry, M.; Bornens, M. Cell Shape and Cell Division. Curr. Opin. Cell Biol. 2006, 18, 648–657. (54) Théry, M.; Racine, V.; Pépin, A.; Piel, M.; Chen, Y.; Sibarita, J.-B.; Bornens, M. The
Extracellular Matrix Guides the Orientation of the Cell Division Axis. Nat. Cell Biol. 2005, 7, 947–953.
(55) Théry, M. Micropatterning as a Tool to Decipher Cell Morphogenesis and Functions. J. Cell Sci. 2010, 123, 4201–4213.
(56) Grossier, J.-P.; Xouri, G.; Goud, B.; Schauer, K. Cell Adhesion Defines the Topology of Endocytosis and Signaling. EMBO J. 2014, 33, 35–45.
(57) Van Dongen, S. F. M.; Maiuri, P.; Marie, E.; Tribet, C.; Piel, M. Triggering Cell Adhesion, Migration or Shape Change with a Dynamic Surface Coating. Adv. Mater. 2013, 25, 1687–1691. (58) James, J.; Goluch, E. D.; Hu, H.; Liu, C.; Mrksich, M. Subcellular Curvature at the Perimeter of
Micropatterned Cells Influences Lamellipodial Distribution and Cell Polarity. Cell Motil.
(59) Park, C. Y.; Tambe, D.; Alencar, A. M.; Trepat, X.; Zhou, E. H.; Millet, E.; Butler, J. P.; Fredberg, J. J. Mapping the Cytoskeletal Prestress. Am. J. Physiol. Cell Physiol. 2010, 298, C1245–C1252. (60) Roca-Cusachs, P.; Alcaraz, J.; Sunyer, R.; Samitier, J.; Farré, R.; Navajas, D. Micropatterning of
Single Endothelial Cell Shape Reveals a Tight Coupling between Nuclear Volume in G1 and Proliferation. Biophys. J. 2008, 94, 4984–4995.
(61) Tee, S.-Y.; Fu, J.; Chen, C. S.; Janmey, P. A. Cell Shape and Substrate Rigidity Both Regulate Cell Stiffness. Biophys. J. 2011, 100, L25–L27.
(62) Rotsch, C.; Radmacher, M. Drug-Induced Changes of Cytoskeletal Structure and Mechanics in Fibroblasts: An Atomic Force Microscopy Study. Biophys. J. 2000, 78, 520–535.
(63) Ramamurthy, B.; Yengo, C. M.; Straight, A. F.; Mitchison, T. J.; Sweeney, H. L. Kinetic Mechanism of Blebbistatin Inhibition of Nonmuscle Myosin IIb. Biochemistry 2004, 43, 14832– 14839.
(64) Mathur, A. B.; Collinsworth, A. M.; Reichert, W. M.; Kraus, W. E.; Truskey, G. A. Endothelial, Cardiac Muscle and Skeletal Muscle Exhibit Different Viscous and Elastic Properties as Determined by Atomic Force Microscopy. J. Biomech. 2001, 34, 1545–1553.
(65) Fabry, B.; Maksym, G.; Butler, J.; Glogauer, M.; Navajas, D.; Fredberg, J. Scaling the Microrheology of Living Cells. Phys. Rev. Lett. 2001, 87, 148102.
(66) Alcaraz, J.; Buscemi, L.; Grabulosa, M.; Trepat, X.; Fabry, B.; Farré, R.; Navajas, D. Microrheology of Human Lung Epithelial Cells Measured by Atomic Force Microscopy. Biophys.
J. 2003, 84, 2071–2079.
(67) Cartagena, A.; Raman, A. Local Viscoelastic Properties of Live Cells Investigated Using Dynamic and Quasi-Static Atomic Force Microscopy Methods. Biophys. J. 2014, 106, 1033–1043.
(68) Théry, M.; Pépin, A.; Dressaire, E.; Chen, Y.; Bornens, M. Cell Distribution of Stress Fibres in Response to the Geometry of the Adhesive Environment. Cell Motil. Cytoskeleton 2006, 63, 341– 355.
(69) Wang, N.; Naruse, K.; Stamenović, D.; Fredberg, J. J.; Mijailovich, S. M.; Tolić-Nørrelykke, I. M.; Polte, T.; Mannix, R.; Ingber, D. E. Mechanical Behavior in Living Cells Consistent with the Tensegrity Model. Proc. Natl. Acad. Sci. U. S. A. 2001, 98, 7765–7770.
(70) Ingber, D. E.; Wang, N.; Stamenovic, D. Tensegrity, Cellular Biophysics, and the Mechanics of Living Systems. Rep. Prog. Phys. 2014, 77, 046603.
(71) Pourati, J.; Maniotis, A.; Spiegel, D.; Schaffer, J. L.; Butler, J. P.; Fredberg, J. J.; Ingber, D. E.; Stamenovic, D.; Wang, N. Is Cytoskeletal Tension a Major Determinant of Cell Deformability in Adherent Endothelial Cells? Am. J. Physiol. 1998, 274, C1283–C1289.
(72) Stamenović, D.; Coughlin, M. F. The Role of Prestress and Architecture of the Cytoskeleton and Deformability of Cytoskeletal Filaments in Mechanics of Adherent Cells: A Quantitative Analysis.
(73) Stamenovic, D. 6 Models of Cytoskeletal Mechanics Based on Tensegrity Dimitrije Stamenovi c. 2006.
(74) Fredberg, J.; Fabry, B. The Cytoskeleton as a Soft Glassy Material. 1–17.
(75) Bischofs, I.; Schmidt, S.; Schwarz, U. Effect of Adhesion Geometry and Rigidity on Cellular Force Distributions. Phys. Rev. Lett. 2009, 103, 048101.
(76) Maniotis, a J.; Chen, C. S.; Ingber, D. E. Demonstration of Mechanical Connections between Integrins, Cytoskeletal Filaments, and Nucleoplasm That Stabilize Nuclear Structure. Proc. Natl.
Acad. Sci. U. S. A. 1997, 94, 849–854.
(77) Lee, J. S. H.; Hale, C. M.; Panorchan, P.; Khatau, S. B.; George, J. P.; Tseng, Y.; Stewart, C. L.; Hodzic, D.; Wirtz, D. Nuclear Lamin A/C Deficiency Induces Defects in Cell Mechanics, Polarization, and Migration. Biophys. J. 2007, 93, 2542–2552.
(78) Théry, M.; Piel, M. Adhesive Micropatterns for Cells: A Microcontact Printing Protocol. Cold
Spring Harb. Protoc. 2009, 2009, pdb.prot5255.
(79) Hutter, J. L.; Bechhoefer, J. Calibration of Atomic-Force Microscope Tips. Rev. Sci. Instrum. 1993, 64, 1868.
(80) Butt, H.; Jaschke, M. Calculation of Thermal Noise in Atomic Force Microscopy. Nanotechnology 1995, 1.
(81) Domke, J.; Dannöhl, S.; Parak, W.; Müller, O.; Aicher, W.; Radmacher, M. Substrate Dependent Differences in Morphology and Elasticity of Living Osteoblasts Investigated by Atomic Force Microscopy. Colloids Surf. B. Biointerfaces 2000, 19, 367–379.