HAL Id: hal-00296276
https://hal.archives-ouvertes.fr/hal-00296276
Submitted on 3 Jul 2007
HAL is a multi-disciplinary open access
archive for the deposit and dissemination of
sci-entific research documents, whether they are
pub-lished or not. The documents may come from
teaching and research institutions in France or
abroad, or from public or private research centers.
L’archive ouverte pluridisciplinaire HAL, est
destinée au dépôt et à la diffusion de documents
scientifiques de niveau recherche, publiés ou non,
émanant des établissements d’enseignement et de
recherche français ou étrangers, des laboratoires
publics ou privés.
The effects of heating by transported dust layers on
cloud and precipitation: a numerical study
Y. Yin, Lin Chen
To cite this version:
Y. Yin, Lin Chen. The effects of heating by transported dust layers on cloud and precipitation: a
numerical study. Atmospheric Chemistry and Physics, European Geosciences Union, 2007, 7 (13),
pp.3497-3505. �hal-00296276�
www.atmos-chem-phys.net/7/3497/2007/ © Author(s) 2007. This work is licensed under a Creative Commons License.
Chemistry
and Physics
The effects of heating by transported dust layers on cloud and
precipitation: a numerical study
Y. Yin and L. Chen
Nanjing University of Information Science and Technology, Nanjing 210044, China Received: 2 February 2007 – Published in Atmos. Chem. Phys. Discuss.: 27 February 2007 Revised: 15 May 2007 – Accepted: 27 June 2007 – Published: 3 July 2007
Abstract. There have been numerous recent publications
showing that mineral dust might be a good absorber for solar radiation in addition to its capability to act as cloud conden-sation nuclei (CCN) and ice forming nuclei (IFN), and could lead to reduced cloud cover and precipitation in the region where it is present. This effect is investigated using a dy-namic cloud model with detailed microphysics of both warm and ice phase processes. The model is initialized using mea-sured size distributions and concentrations of mineral dust particles. Our results show that when dust appears at the cloud-base height and below 3 km, where the temperature
is warmer than −5◦C, the heating induced by the presence
of dust layers can inhibit the formation of cloud droplets and suppresses the development of precipitation, leading to lower cloud optical depth and albedo. On the other hand, when the dust layers are located at altitudes with temperature colder
than −5◦C, or above the −5◦C level, mineral aerosols can act
as effective ice nuclei, intensify the ice-forming processes, and may enhance the development of cloud and precipitation. It is also found that the heating effect is more pronounced in continental clouds than in maritime clouds.
1 Introduction
In climate modeling, the largest remaining uncertainties arise from the complexities of the influence of tropospheric aerosols on the global climate (IPCC, 2001). Over 50% of the global production of tropospheric aerosol particles con-sists of mineral aerosols, originating mainly from the deserts and their borders (Andreae et al., 1986). Mineral dust par-ticles, unlike other tropospheric aerosol species, are raised rapidly to high altitudes by extremely high winds occurring over limited regions with very fine grain soil. Recent satellite
Correspondence to: Y. Yin
(yyatnuist@yahoo.co.uk)
observations have shown that although mineral dust tends to originate from very specific areas around the globe, it can be transported over long distances (e.g. Prospero, 1999; Israele-vich et al., 2002; DeMott et al., 2003; Trochkine et al., 2003; Zhao et al., 2003, 2006). During the process of transport, some of the insoluble dust aerosols are coated with sea salt and/or anthropogenic pollutants such as sulfate and nitrate. These interactions cause the aerosols to be more soluble and increased their chance to serve as CCN (Levin et al., 1996). However, the effect of mineral dust on climate is complex and uncertain.
Using satellite observations, Rosenfeld et al. (2001) found that desert dust might suppress precipitation. On the other hand, Wurzler et al. (2000), Yin et al. (2002), and Teller and Levin (2006) used numerical models to show that GCCN in-cluding dust coated with soluble material (e.g. sulfate) may actually increase the amount of precipitation in some clouds because of the effective growth of the drops by collection. These latter results were supported by recent remote sensing of dust-cloud interaction in the Aral Sea region (Rudich et al., 2002). By using NOAA-AVHRR retrievals, Rudich et al. showed that large salt-containing dust particles from the Aral Sea interacted with clouds and increased cloud drops to sizes that promote precipitation. In addition, there have been evidences showing that dust particles are efficient IFN. For example, DeMott et al. (2003) measured the IFN con-centrations in a dust layer that was transported from Africa to Florida. They showed that between about 1.5 and 4 km
altitude the IFN concentrations reached up to 1 cm−3. These
values were about 20 to 100 times higher than those mea-sured at lower altitudes in a non-dusty environment at the same location.
Using a numerical model combined with measurements and by including mineral dust as both efficient CCN and IFN, Levin et al. (2005) and Teller and Levin (2006) showed that ignoring the ice-nucleating ability of the mineral dust, but al-lowing the soluble component of the mixed aerosols to act as
3498 Y. Yin and L. Chen: Heating effects of dust layers on clouds and precipitation GCCN, enhanced development of the warm rain process in
continental clouds was obtained. On the other hand, allow-ing the mineral dust particles to also act as efficient IFN the amount of rain on the ground was reduced as compared to the case when they were inactive.
In general, it is known that dust particles have very high single scattering albedo (SSA), or very low absorption (e.g. Dubovik et al., 2002). Recently, however, Huang et al. (2006a, b) showed using satellite data that cloud water path could be reduced due to the presence of mineral dust, and attributed this to the absorbing and heating effect of the dust layer. By analyzing GOME and GMS satellite data, Costa et al. (2006) also indicated that the dust particles from Asia have lower scattering efficiency, implying that the dust particles are more absorbing from this region, but different from Huang et al. (2006a, b), they attributed this to mixing of the dust particles with pollutants such as sulfate, nitrate, and black carbon, during long-range transport from the source region.
The absorbing and heating effect of mineral dust on cloud microphysical properties and precipitation have rarely been studied (Lohmann and Diehl, 2006). The mineral aerosols from the arid and semi-arid areas in East Asia could play an important role in development of clouds and precipitation due to the vast emission and atmospheric loading of mineral dust in this region (e.g. Zhang et al., 2003; Zhao et al., 2006). In this study, a dynamical cloud model with detailed descrip-tion of both warm and cold cloud microphysics is used to investigate the effects on cloud development and precipita-tion due to changes in in-cloud thermodynamic structure that occur due to absorbing of solar radiation by dust layers. The intention is to shed some light on the response of microphysi-cal and optimicrophysi-cal properties of clouds developed under different aerosol conditions to the characteristics of the absorbing dust layers.
2 A brief description fo the cloud model
The dynamical framework of the model is a two-dimensional slab-symmetric non-hydrostatic cloud model (Yin et al.,
2000). The vertical and horizontal velocities are
calcu-lated based on the stream function and vorticity equation. The other predicting equations for virtual potential temper-ature, specific vapor perturbation, the specific concentration of CCN, and the specific mass and number of each species of hydrometeors considered (drops, graupel, ice crystals, and snowflakes) were based on the previous work by Reisin et al. (1996) and Yin et al. (2000, 2002).
The warm microphysical processes included are: nu-cleation of CCN, condensation and evaporation, collision-coalescence, and binary breakup (Low and List kernel). The ice microphysical processes included are: ice nucleation (de-position, condensation-freezing, contact nucleation, and im-mersion freezing), ice multiplication (Hallett-Mossop
mech--60 -40 -20 0 20 40 Temperature (o C) 1000900 800 700 600 500 400 300 200 Pressure (hPa)
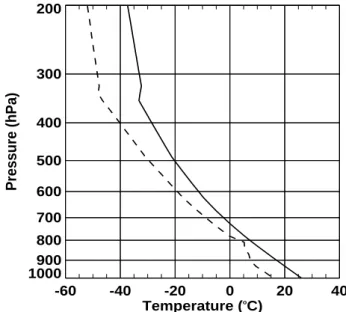
Figure 1
Fig. 1. Initial vertical profiles of temperature (solid line) and dew point temperature (dashed line) used in the present work.
anism), deposition and sublimation of ice, ice and ice-drop interactions (aggregation, accretion and riming), melt-ing of ice particles, and sedimentation of both drops and ice particles. All these microphysical processes are formulated and solved using the method of Multi-Moments (Tzivion et al., 1987, 1989, 1999; Reisin et al., 1996).
Three different types of ice are considered: ice crystals, graupel particles and snowflakes (aggregates of ice crys-tals). Each particle species is divided into 34 bins, with mass doubling for adjacent bins. The mass of the lower boundary of the first bin and the upper boundary of the
last bin for both liquid and solid phases are 0.1598×10⁻¹³
and 0.17468×10⁻³kg, which correspond to drop diameter
of 3.125 and 8063 µm, respectively. The CCN spectrum is divided into 57 bins with a minimum radius of 0.0041 µm.
The grid size of the model is set to 300 m in both hori-zontal and vertical directions (separate numerical tests using grid sizes of 150 and 200 m showed that except for a two-minute delay in the cloud and rain initiation, the development of cloud properties such as liquid water content, maximum updraft, ice content, were similar to those reported in this pa-per). The width and height of the domain are 30 and 12 km, respectively. The time step for all the processes is 5 s except for diffusive growth/evaporation, where a shorter time step of up to 2.5 s is used.
Table 1. Parameters of the aerosol particle distributions. Mode i ni(cm−3) Ri(µm) logσi Continental 1 40000 0.006 0.30 with dust 2 3930 0.03 0.30 3 15 0.45 0.15 4 80 0.90 0.20 Maritime 1 133 0.0039 0.657 with dust 2 66.6 0.133 0.21 3 3.06 0.29 0.396 4 80 0.90 0.20
Table 2. Cases for sensitivity run.
Case Altitude (km) Heating (◦C) Thickness (km)
C0, M0 3.0 0.0 1.8 C1, M1 3.0 0.25 1.8 C2, M2 3.0 0.5 1.8 C3, M3 3.0 0.25 2.4 C4, M4 1.8 0.25 1.8 C5, M5 4.2 0.25 1.8 3 Numerical experiments
3.1 Initial thermodynamic profiles
In this paper, a single-cell cloud with moderate instability is considered to be representative of one of the growing cells in a convection complex. The tests presented here mainly concentrates on how the heating released from an absorbing dust layer influences the microphysical structure of a cloud and the development of precipitation. A theoretical thermo-dynamic profile (Fig. 1) which produces a cloud with cloud
base at 8–10◦C and top at −25◦C is used to represent the
typical initial thermodynamic conditions of the cloud (e.g. Cooper and Lawson, 1984; Krauss et al., 1987). In order to
initiate the cloud, a temperature perturbation of 2◦C is
ap-plied for one time step at t=0 at a height of 600 m, in the middle of the domain. Therefore, the cloud initialized in this study only depends on the instability of the atmosphere, not on the area of the initial disturbance. The possible influence of wind shear is not considered.
3.2 Initial distributions of aerosol particles
The concentrations and size distributions of dust particles measured during a dust storm over the region of Helan Mts., northwest China (Niu et al., 2001), and a background aerosol distribution shown by Yin et al. (2005), are used as the initial aerosol conditions for a cloud developed over the mainland of East Asia. For comparison, simulations with a background aerosol profile, representative of maritime air mass (Jaenicke,
0.0
0.2
0.4
0.6
Heating(
oC)
0
1
2
3
4
5
Height(km)
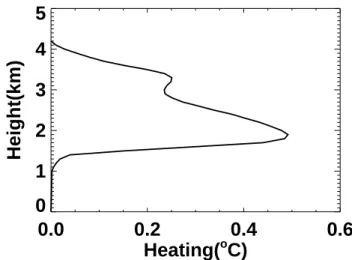
Figure 2
Fig. 2. The heating profile by dust layers used in the simulations (Based on Cheng et al., 2002).0 20 40 60 80 Time (min) 0 2 4 6 8 10 12 14 Max.w (m s -1) C0 M0
Figure 3
Fig. 3. Time evolution of the maximum vertical velocity in the ref-erence cases C0 and M0 (refer the text for definition of the cases).1988), are also carried out. The aerosol particle spectra can be fitted with four and five lognormal distribution functions. The parameters of particle size distributions are shown in Ta-ble 1.
3.3 Experiments to test aerosol heating effect
Cheng et al. (2002) investigated the radiative properties of mineral aerosols originated from northwest China. Their results showed that the heating effect of a dust layer was most important within the dust layer, with two peak values of net (shortwave plus long-wave) heating located close, re-spectively, to the top and bottom of the layer. In this study, the profile of the net heating obtained by Cheng et al. (2002, Fig. 2) is imposed on the initial temperature profile to rep-resent the heating effect resulted from transport of a dust layer. In addition, dust particles interact with other atmo-spheric pollutants, leading to some of the soluble materials such as sulfate and nitrate, coat at the surface of the parti-cles (e.g. Levin et al., 1996; Zhang et al., 2003). This in-creases the solubility and scattering efficiency and reduces
3500 Y. Yin and L. Chen: Heating effects of dust layers on clouds and precipitation 0 1 2 3 4 5 Max. LWC (g kg -1) C0 M0 (a) 0 200 400 600 800 Max. Nw (cm -3) (b) 0.0 0.2 0.4 0.6 0.8 1.0 Max. Mi(g kg -1) (c) 0 20 40 60 Max. Ni (litre -1) (d) 0 20 40 60 80 Time(min) 0 1 2 3 4 5 Max. Mg (g kg -1) (e) 0 20 40 60 80 Time(min) 0 1 2 3 4 Max. Ng (litre -1) (f)
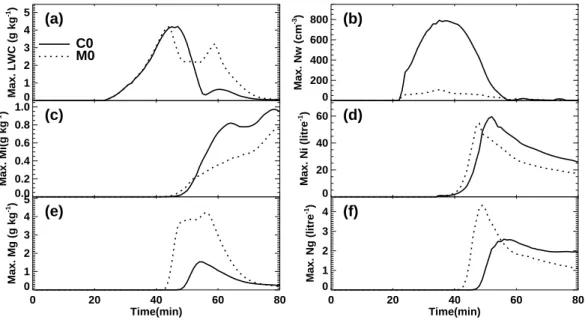
Figure 4
Fig. 4. The peak values of the number concentration and specific mass of drops, ice crystals, and graupel particles as a function of time in the reference cases C0 and M0.
the absorbing efficiency of the mineral aerosols (e.g. Bauer et al., 2007). Therefore, the heating effect of a dust layer depends not only on the chemical composition of the origi-nal particles, but also varies with the time the particles have been suspended in the air, the pollutants the particles have encountered during the long-range transport, and the meteo-rological conditions under which the particles are present. In addition, the altitude and the depth of a dust layer may also change with time due to sedimentation, dispersion and mete-orological conditions. Sensitivity experiments with different configuration of dust layers are carried out. Table 2 shows the experiments conducted in this study, where C0 and M0 repre-sent, respectively, the continental and maritime cases without the absorbing dust layer; C1 (M1) and C2 (M2) are
conti-nental (maritime) cases with heating of 0.25◦C and 0.5◦C,
respectively, to represent mineral aerosols experienced dif-ferent aging. The larger value of heating is based on the estimate by Cheng et al. (2002) for the dust source region. The real heating effects of mineral dust particles will proba-bly be somewhere between the results obtained in C0 (M0) and C2 (M2). Experiments C3 and M3 are continental and maritime cases with a thicker dust layer to reflect dust lay-ers experienced long-range transport. In cases C4 (M4) and C5 (M5), the effect of changing the altitude of a dust layer is considered.
4 Results and discussions
4.1 General feature of the reference cases C0 and M0
Figure 3 shows the time evolution of the maximum values of updraft velocity in the reference cases C0 and M0. It can be seen that the values are quite similar in both the conti-nental and maritime cases except for the period between 50 and 65 min, during which, the heavier precipitation formed in the maritime case (see Fig. 4) produced a more pronounced downdraft and triggered the development of a secondary cloud on both side of the main convective cell. A nearly constant updraft velocity, resulted from the initial impulse, prevailed throughout the first 28 min. After that time, the up-draft velocity increased rapidly with the onset of condensa-tion and release of latent heat. The highest condensacondensa-tion rate occurred at around 45 min (Fig. 4). The vertical velocity was further enhanced by release of latent heat produced by for-mation and diffusional growth of ice particles, which reached the peak development at around 43 min. After 45 min of sim-ulation, the updraft velocity began to decrease resulting from falling precipitation particles, their mass loading and cooling produced by their evaporation and melting.
Cloud droplets started to form after approximately 23 min of modeling time, as can be seen from Fig. 4 which shows the time evolution of the maximum values of water con-tent and number concentration of water droplets, ice crys-tals and graupel particles in the reference cases C0 and M0. The relatively long time for cloud initialization is related to the small area of initial disturbance as described in the pre-vious section. The cloud base located at a height between
1.5 and 1.8 km (temperature 8–10◦C) and the top of the fully
developed cloud reached a height between 6.5 and 7.0 km (T
∼−25◦C).
While the maximum liquid water contents (LWC) are quite similar, significant differences exist between the two cases in the time evolution of the other cloud properties. Due to the much higher concentration of aerosol particles, the cloud developed in the continental case (C0) had a much higher droplet concentration than that in the maritime case (M0), and the droplets in the maritime case also grew faster and raindrop formed earlier through collision and coalescence processes. This difference in the warm phase microphysics also affected the development of ice particles.
Ice crystals were initiated after 34 min of simulation but the concentration remained relatively small prior to 40 min (see Fig. 4c, d). After 40 min the concentration of ice crystals
increased very rapidly and reached its peak value of 53 l−1
around 45 min in the maritime case and 61 l−1at 51 min in
the continental case, implying air pollutants may postpone the development of cloud. Both the ice water content and number concentration of ice crystals in the continental case are higher than that in the maritime case. The opposite is true for development of graupel particles (Fig. 4e, f), which reached much higher values in the maritime case, because the freezing and riming processes were more efficient in the presence of larger drops that were found in the maritime en-vironment.
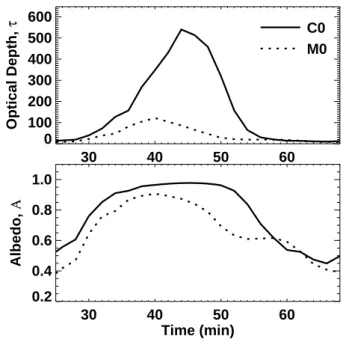
As a result of the differences in the development of rain-drops and graupel particles, the rainfall intensity and precip-itation amount on the ground were much larger in the mar-itime case than in the continental case. This also led to more rapid dissipation of the maritime clouds and to a higher op-tical depth and a higher albedo in the continental cloud (see Fig. 5).
4.2 The effect of heating by the dust layer
Absorption of shortwave solar radiation by the dust layer may heat the atmospheric layer where it is present. Figure 6 shows for the continental case the time evolution of the max-imal values of water contents and number concentrations of each hydrometeor particles, liquid- and ice-phase and total rainfall intensities, updraft velocity, accumulated precipita-tion amount on the ground and optical depth of the cloud developed when a dust layer is present. Two scenarios with
heating of 0.25◦C (C2) and 0.5◦C (C3) are shown. A
compar-ison of cases C2 and C3 with the reference case C0, it can be seen that dust-induced heating effect reduced the condensa-tion efficiency of hydrometeor, leading to a lower peak value of liquid water content and number concentrations of cloud droplets. Heating by the dust layer also inhibited the devel-opment of ice-phase cloud particles (Fig. 6c–f). It is also clear that dust heating postponed the development of both liquid and ice phase precipitation by about 10 min, and also suppressed precipitation amount by about 50% (comparing case C2 and C0). The heating effect of the dust layer also
F
30 40 50 60 0 100 200 300 400 500 600 Optical Depth, τ C0 M0 30 40 50 60 Time (min) 0.2 0.4 0.6 0.8 1.0 Albedo, ΑFigure 5
Fig. 5. Variation with time of the optical depth and albedo of cases C0 and M0.
sulted in lower optical depth of the cloud due to evaporation of cloud particles. In general, the results obtained here indi-cate that the cloud microphysical structure, optical properties and precipitation all can be more significantly influenced if a strong absorbing dust layer is present, implying that the heating effect of a dust layer is more significant close to the source region. These are consistent with the finding derived from satellite remote sensing (e.g. Huang et al., 2006a, b).
Compared with the continental case, the heating effect on maritime clouds due to the presence of a dust layer is less sig-nificant (Fig. 7). The cloud and precipitation were postponed
by 3 to 6 min, respectively, when heating of 0.25 and 0.5◦C
were present, and the precipitation amount was reduced by 11% and 28%, respectively, for these two cases.
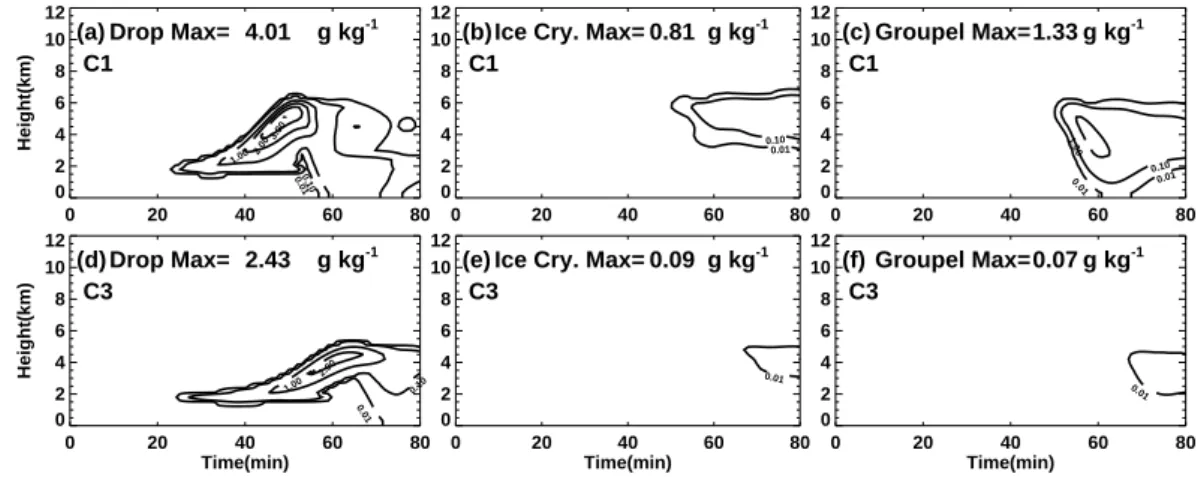
4.3 Sensitivity to the depth of the dust layer
The depth of a dust layer may change during its transport from the source region, due to sedimentation and diffusion of dust particles as well as changes in meteorological condi-tions. Figure 8 shows the specific mass of various hydrom-eteor particles as a function of altitude and time, for cases with a dust layer located at 3.0 km and depth of 1.8 km (case C1) and 2.4 km (case C3), respectively. In both cases the
heating was 0.25◦C. One can see from this figure that when
the depth of the dust layer increases from 1.8 km to 2.4 km, the volume of maximum water content decreases, the peak value appears later, and the lifetime becomes shorter. It is also indicated from this figure (Fig. 8b, c, e, f) that even with
heating of 0.25◦C, an increase in the depth of the dust layer
3502 Y. Yin and L. Chen: Heating effects of dust layers on clouds and precipitation 0 1 2 3 4 5 Max. LWC (g kg -1) C0 C1 C2 (a) 0 200 400 600 800 Max. Nw (cm -3) (b) 0.2 0.4 0.6 0.8 1.0 Max. Mi(g kg -1) (c) 0 20 40 60 Max. Ni (litre -1) (d) 0.0 0.5 1.0 1.5 Max. Mg (g kg -1) (e) 0 20 40 60 80 Time(min) 0.0 0.5 1.0 1.5 2.0 2.5 Max. Ng (litre -1) (f) 0 20 40 60 80 Time (min) 0 2 4 6 8 10 12 14 Max.w (m s -1) (l) 100 200 300 400 500 Optical Depth, τ (k) 2 4 6 8 10 Max. Rliq. (mm h -1) (g) 0.1 0.2 0.3 0.4 0.5 0.6 Max. Rice (mm h -1) (h) 2 4 6 8 10 Rtot (mm h -1) (i) 0.5 1.0 1.5 2.0 2.5 3.0 Pre (10 3 m 3) (j) Figure 6
Fig. 6. Time evolution of maximum values of (a) liquid water con-tent , (b) number concentrations of drops, (c) water concon-tent of ice crystals, (d) number concentrations of ice crystals, (e) water con-tent of graupel particles, (f) number concentrations of graupel par-ticles, precipitation rate from (g) liquid phase, (h) ice phase, and (i) the total condensate, (j) the integrated precipitation amount on the ground, (k) the cloud optical depth, and (l) the maximum ver-tical velocity, at the main updraft core for different heating in the continental cloud.
particles and precipitation formation. The specific mass of ice crystals and graupel particles are reduced by a factor of 9 and 20, respectively (compare C3 and C1). These results clearly demonstrate that during transport of dust particles, if the dust layer is thick enough, the heating effect can be dom-inating and can lead to different cloud microphysical struc-ture as well as cloud cover. Once again, the effect becomes less pronounced when a similar dust layer is present in a ma-rine environment. A comparison of case M3 (with dust layer depth of 2.4 km, not shown here) indicates a decrease in grau-pel water content by 25% only.
4.4 Sensitivity to the altitude of the dust layer
Heating at different heights can change the thermodynamic structure of a cloud, perturbs the microphysical processes of the cloud, and may also change the macro-structure of the cloud. This is because when no inverse layer exists, temper-ature in clouds usually decreases with height. The presence of a heating layer may change the stability in the cloud and,
0 1 2 3 4 5 Max. LWC (g kg -1) M0 M1 M2 (a) 0 20 40 60 80 100 120 Max. Nw (cm -3) (b) 0.0 0.2 0.4 0.6 0.8 Max. Mi(g kg -1) (c) 0 10 20 30 40 50 60 Max. Ni (litre -1) (d) 0 1 2 3 4 5 Max. Mg (g kg -1) (e) 0 20 40 60 80 Time(min) 0 1 2 3 4 Max. Ng (litre -1) (f) 0 20 40 60 80 Time (min) 0 2 4 6 8 10 12 14 Max.w (m s -1) (l) 0 20 40 60 80 100 120 Optical Depth, τ (k) 0 20 40 60 80 100 120 Max. Rliq. (mm h -1) (g) 0 20 40 60 80 Max. Rice (mm h -1) (h) 0 50 100 150 Rtot (mm h -1) (i) 5 10 15 20 25 30 Pre (10 3 m 3) (j) Figure 7
Fig. 7. Similar as in Fig. 6, but for the maritime cloud.
in turn, leads to different development of cloud particles and precipitation. This is investigated by running two additional cases, C4 and C5, with maximum heating located at 1.8 km and 4.2 km, respectively. A quantitative comparison of the results from these two cases with that from C1, it is found that hydrometeors developed the earliest in C5 and latest in C4, implying that with the dust layer becoming higher, the heating may result in an accelerated development of cloud and precipitation particles. This can be seen from Fig. 9, which shows the development of precipitation in these three cases. The results also indicate that heating at cloud base can increase the evaporation efficiency at this level, inhibits the conversion of water vapor to condensed water, or the forma-tion of droplets. This in turn, results in lower precipitaforma-tion efficiency from both liquid and solid phase particles.
Table 3 shows the accumulated precipitation amount on the surface for each case after 80 min of simulation. It is clear from this table that with increasing of the concentration of absorbing aerosols in the atmosphere, the warming effect inside the cloud becomes more significant; when a dust layer is located at the cloud-base level, warming-induced evapora-tion of cloud droplets could suppress the formaevapora-tion of precip-itation; while when the dust layer is located at the altitudes where ice nucleation is effective, the development of cloud particles and precipitation may be enhanced, leading to more precipitation on the ground.
0 20 40 60 80 0 2 4 6 8 10 12 Height(km) 0.010.10 1.002.00 3.00 Drop Max= 4.01 g kg-1 C1 (a) 0 20 40 60 80 0 2 4 6 8 10 12 0.01 0.10
Ice Cry. Max= 0.81 g kg-1
C1 (b) 0 20 40 60 80 0 2 4 6 8 10 12 0.01 0.01 0.10 1.00 Groupel Max=1.33 g kg-1 C1 (c) 0 20 40 60 80 Time(min) 0 2 4 6 8 10 12 Height(km) 0.01 0.10 1.00 2.00 Drop Max= 2.43 g kg-1 C3 (d) 0 20 40 60 80 Time(min) 0 2 4 6 8 10 12 0.01
Ice Cry. Max= 0.09 g kg-1
C3 (e) 0 20 40 60 80 Time(min) 0 2 4 6 8 10 12 0.01 Groupel Max=0.07 g kg-1 C3 (f)
Figure 8
Fig. 8. The specific masses of drops, ice crystals, and graupel particles, at the main updraft core, as a function of time and altitude in cases C1 and C3.
5 Summary and conclusions
The heating effect on cloud and precipitation induced by ab-sorption of solar radiation by transport of dust layers and its sensitivities to the height and depth of the dust layers are dis-cussed. It is found that the heating effect induced by absorb-ing aerosols varies with the heatabsorb-ing capacity, which depends on the physical and optical properties of aerosol particles, and height and depth of the dust layer. The possible reasons for these changes are explained based on the microphysical mechanisms operating during the interactions between dust particles and clouds.
When a dust layer located below 3 km (∼0◦C) where the
temperature is higher than the one required for ice nucleation, CCN activation may be suppressed and the development of vertical velocity may be affected, delaying the development of the clouds. In this case, absorption of solar radiation and heating by mineral dust may reduce the water content and the number concentration of cloud particles, and leads to a lower optical depth of the cloud. This is consistent with the find-ings by Huang et al. (2006b) from retrieval of satellite remote sensing data. It is also found that the heating effect is very sensitive to the altitude, the depth and fraction of absorbing material in the dust layer. Stronger heating effect is found when the dust layer is located lower and/or is thicker. At
al-titudes with temperature higher than −5◦C, the presence of a
dust layer can lead to less cloud cover, less precipitation and lower optical depth, while the development of cloud and pre-cipitation can be promoted when a mineral layer is located
above the −5◦C level.
40 50 60 70 80 0 2 4 6 8 10
Max. Precip. Rate from Liquid-phase (mm h
-1) C1 C4 C5 40 50 60 70 80 Time (min) 0.0 0.1 0.2 0.3 0.4 0.5 0.6
Max. Precip. Rate from Ice-phase (mm h
-1) 40 50 60 70 80 0 2 4 6 8 10 12
Total Precip. Rate (mm h
-1) 40 50 60 70 Time (min) 0 1 2 3 Precip. Amount (10 3 m 3) Figure 9
Fig. 9. Time evolution of precipitation rate from liquid phase, ice phase, and the total condensate, as well as the integrated precipita-tion amount on the ground, in cases C1, C4 and C5.
Table 3. Integrated precipitation amount on the ground.
case Prec. amount (m3) Case Prec. amount (103m3)
C0 3,127 M0 27.88 C1 2,578 M1 25.03 C2 1,672 M2 19.11 C3 62 M3 12.02 C4 1,718 M4 26.29 C5 3,248 M5 27.53
3504 Y. Yin and L. Chen: Heating effects of dust layers on clouds and precipitation
Acknowledgements. This study was partially funded by the 973
Program of China through Grant No. 2006CB403706, the National Natural Sciences Foundation of China through Grant No. 40375003 and 40365002, and Jiangsu Key Laboratory of Meteorological Dis-aster (Nanjing University of Information Science & Technology), China, through Grant No. KLME060209.
Edited by: W. E. Asher
References
Andreae, M. O., Charlson, R. J., Bruynseels, F., Storms, H., van Grieken, R., and Maenhaut, W.: Internal mixtures of sea salt, sil-icates and excess sulfate in marine aerosols, Science, 232, 1620– 1623, 1986.
Bauer, S. E., Mishchenko, M. I., Lacis, A. A., Zhang, S., Perl-witz, J., and Metzger, S. M.: Do sulfate and nitrate coat-ings on mineral dust have important effects on radiative prop-erties and climate modeling?, J. Geophys. Res., 112, D06307, doi:10.1029/2005JD006977, 2007.
Cheng, T. and Shen, Z.: The radiative forcing of atmospheric dust in northwest China (in Chinese with English abstract), Plateau Meteorol., 21(5), 473–478, 2002.
Cooper, W. A. and Lawson, R. P.: Physical interpretation of results from the HIPLEX-1 experiment, J. Clim. Appl. Meteor., 23, 523– 540, 1984.
Costa, M. J., Sohn, B.-J., Levizzani, V., and Silva, A. M.: Radiative forcing of Asian dust determined from the synergized GOME and GMS satellite data – A case study, J. Meteorol. Soc. Jpn., 84, 85–95, 2006.
DeMott, P. J., Sassen, K., Poellot, M. R., et al.: African dust aerosols as atmospheric ice nuclei, Geophys. Res. Lett., 30(14), 1732, doi:10.1029/2003GL017410, 2003.
Dubovik, O., Holben, B., Eck, T. F., et al.: Variability of absorption and optical properties of key aerosol types observed in world-wide locations, J. Atmos. Sci, 59, 590–608, 2002.
Huang, J., Minnis, P., Lin, B., et al.: Possible influences of Asian dust aerosols on cloud properties and radiative forcing observed from MODIS and CERES, Geophys. Res. Lett., 33, L06824, doi:10.1029/2005GL024724, 2006a.
Huang, J., Lin, B., Minnis, P., et al.: Satellite-based assess-ment of possible dust aerosols semi-direct effect on cloud wa-ter path over East Asia, Geophys. Res. Lett., 33, L19802, doi:10.1029/2006GL026561, 2006b.
Intergovernmental Panel on Climate Change (IPCC), World Me-teorological Office, United Nations Environmental Programme: Summary for Policymakers, 2001.
Israelevich, P. L., Levin, Z., Joseph, J. H., and Ganor, E.: Desert aerosol transport in the Mediterranean region as inferred from the TOMS aerosol index, J. Geophys. Res., 107(D21), 4572, doi:10.1029/2001JD002011, 2002.
Jaenicke, R.: Aerosol physics and chemistry, in: Ladolt-Boernstein: Zahlenwerte und Funktionen aus Naturwissenschaften und Tech-nik, Vol. 4b, edited by: Fischer, G., Springer-Verlag, New York, 391–457, 1988.
Krauss, T. W., Bruintjes, R. T., Verlinde, J., and Kahn, A.: Mi-crophysical and radar observations of seeded and unseeded con-tinental cumulus clouds, J. Clim. Appl. Meteor., 26, 585–606, 1987.
Levin, Z., Ganor, E., and Gladstein, V.: The effects of desert parti-cles coated with sulfate on rain formation in the eastern Mediter-ranean, J. Appl. Meteorol., 35, 1511–1523, 1996.
Levin, Z., Teller, A., Ganor, E., and Yin, Y.: On the interactions of mineral dust, sea salt particles and clouds – Measurements and modeling study from the MEIDEX campaign, J. Geophys. Res., 110, D20202, doi:10.1029/2005JD005810, 2005.
Lohmann, U. and Diehl, K.: Sensitivity Studies of the Importance of Dust Ice Nuclei for the Indirect Aerosol Effect on Stratiform Mixed-Phase Clouds, J. Atmos. Sci., 63, 968–982, 2006. Niu, S., Zhang, C., and Sun, J.: A observational study of the particle
spectra of dust aerosol over the Helan Mts. Region, Chinese J. Atmos. Sci., 25, 2, 243–252, 2001.
Prospero, J. M.: Long range transport of mineral dust in the global atmosphere: Impact of African dust on the environment of the southeastern United States, Proc. Nat. Acad. Sci., 96, 3396– 3403, 1999.
Pruppacher, H. R. and Klett, J. D.: Microphysics of Clouds and Precipitation, D. Reidel, 714 pp., 1997.
Reisin, T., Levin, Z., and Tzivion, S.: Rain production in convective clouds as simulated in an axisymmetric model with detailed mi-crophysics, Part I: Description of the model, J. Atmos. Sci., 53, 497–519, 1996.
Rosenfeld, D., Rudich, Y., and Lahav, R.: Desert dust suppress-ing precipitation: A possible desertification feedback loop, Proc. Natl. Acad. Sci. USA, 98, 11, 5975–5980, 2001.
Rudich Y., Khersonsky, O., and Rosenfeld, D.: Treating clouds with a grain of salt, Geophys. Res. Lett., 29, 22, 2060, doi:10.1029/2002GL016055, 2002.
Teller, A. and Levin, Z.: The effects of aerosols on precipitation and dimensions of subtropical clouds: a sensitivity study using a numerical cloud model, Atmos. Chem. Phys., 6, 67–80, 2006, http://www.atmos-chem-phys.net/6/67/2006/.
Trochkine, D., Iwasaka, Y., Matsuki A., et al.: Mineral aerosol par-ticles collected in Dunhuang, China, and their comparison with chemically modified particles collected over Japan, J. Geophys. Res., 108(D23), 8642, doi:10.1029/2002JD003268, 2003. Tzivion, S., Feingold, G., and Levin, Z.: A efficient numerical
so-lution to the stochastic collection equation, J. Atmos. Sci., 44, 3139–3149, 1987.
Tzivion, S., Feingold, G., and Levin, Z.: The evolution of raindrop spectra. Part II: Collisional collection/breakup and evaporation in a rainshaft, J. Atmos. Sci., 46, 3312–3327, 1989.
Tzivion, S., Reisin, T., and Levin, Z.: A numerical solution of the kinetic collection equation using high spectral grid resolution: A proposed reference, J. Comput. Phys., 148, 527–544, 1999. Wurzler, S., Reisin, T. G., and Levin, Z.: Modification of mineral
dust particles by cloud processing and subsequent effects on drop size distributions, J. Geophys. Res., 105(D4), 4501–4512, 2000. Yin, Y., Levin, Z., Reisin, T. G., et al.: The effect of giant cloud condensation nuclei on the development of precipitation in con-vective clouds – A numerical study, Atmos. Res., 53, 91–116, 2000.
Yin, Y., Wurzler, S., Levin, Z., et al.: Effects on precipitation and cloud optical properties, J. Geophys. Res., 107(D23), 4724, doi:10.1029/2001JD001544, 2002.
Yin, Y., Carslaw, K. S., and Feingold, G.: Vertical transport and processing of aerosols in a mixed-phase convective cloud and the feedback on cloud development, Q. J. Roy. Meteor. Soc., 131,
221–246, 2005.
Zhang, X. Y., Gong, S. L., Shen, Z. X., et al.: Characterization of soil dust aerosol in China and its transport and distribution during 2001 ACE-Asia: 1. Network observations, J. Geophys. Res., 108(D9), 4261, doi:10.1029/2002JD002632, 2003. Zhao, T. L., Gong, S. L., Zhang, X. Y., and McKendry, I.
G.: Modeled size-segregated wet and dry deposition
bud-gets of soil dust aerosol during ACE-Asia 2001: Implications for trans-Pacific transport, J. Geophys. Res., 108(D23), 8665, doi:10.1029/2002JD003363, 2003.
Zhao, T. L., Gong, S. L., Zhang, X. Y., Blanchet, J. P., McKendry, I. G., and Zhou, Z. J.: A simulated climatology of Asian dust aerosol and its trans-Pacific transport. Part I: Mean climate and validation, J. Clim, 19, 88–103, 2006.