Commercial lending concentration and bank expertise:
Evidence from borrower financial statements
The MIT Faculty has made this article openly available. Please share how this access benefits you. Your story matters.
Citation Berger, Philip G. et al. "Commercial lending concentration and bank
expertise: Evidence from borrower financial statements." Journal of Accounting and Economics 64, 2-3 (November 2017): 253-277 © 2017 Elsevier B.V.
As Published http://dx.doi.org/10.1016/j.jacceco.2017.06.005
Publisher Elsevier BV
Version Original manuscript
Citable link https://hdl.handle.net/1721.1/127638
Terms of Use Creative Commons Attribution-NonCommercial-NoDerivs License
Commercial Lending Concentration and Bank Expertise:
Evidence from Borrower Financial Statements*
Philip G. Berger
Booth School of Business, University of Chicago, 5807 S. Woodlawn Ave., Chicago, IL 60637 Michael Minnis
Booth School of Business, University of Chicago, 5807 S. Woodlawn Ave., Chicago, IL 60637 and
Andrew Sutherland+
MIT Sloan School of Management, 100 Main St., Cambridge, MA 02142
October 6, 2016
* We appreciate helpful comments from Mary Barth, Anne Beatty (discussant), John Core, Joao Granja, Glen Jamarron (discussant), Anil Kashyap, Randall Kroszner, Alina Lerman, Petro Lisowsky, Maria Loumioti (discussant), William Minnis, Stephen Ryan, Nemit Shroff, Eric So, Rodrigo Verdi, Todd Ver-milyea, Joe Weber, participants of workshops at Chicago, Cornell, Drexel, Miami, MIT, NYU, Stanford Accounting Summer Camp, UIC, Federal Reserve System/Conference of State Bank Supervisors Fourth Annual Community Banking Research and Policy Conference, UNC/Duke Fall Camp, and the 2016 FARS Midyear Meeting, and especially an anonymous referee and Bob Holthausen (editor). Any remaining errors or omissions are ours. We thank the Risk Management Association for providing data. Minnis acknowl-edges support from the ARAMARK Faculty Research Fund at Booth, Sutherland thanks MIT Sloan and the Ernie Wish Fellowship at Booth for funding, and all authors appreciate financial support from the Uni-versity of Chicago’s Booth School of Business.
+ Corresponding author: ags1@mit.edu; 617-324-3894.
1
Commercial Lending Concentration and Bank Expertise:
Evidence from Borrower Financial Statements
Abstract
Lending concentration features prominently in models of information acquisition by banks, but empirical evidence on its role is limited because banks rarely disclose details about their exposures or information collection. Using a novel dataset of bank-level commercial loan exposures, we find banks are less likely to collect audited financial statements from firms in industries and regions in which they have more exposure. These findings are stronger in settings in which adverse selection is acute and muted when the bank lacks experience with an exposure. Our results offer novel evidence on how bank characteristics are related to the type of financial information they use and support theoretical predictions suggesting portfolio concentration reveals a bank’s relative exper-tise.
JEL Classification: G21, G38, M40, D82, L14.
Keywords: commercial lending; monitoring; information economics; bank concentration; financial
Commercial Lending Concentration and Bank Expertise:
Evidence from Borrower Financial Statements
Abstract
Lending concentration features prominently in models of information acquisition by banks, but empirical evidence on its role is limited because banks rarely disclose details about their exposures or information collection. Using a novel dataset of bank-level commercial loan exposures, we find banks are less likely to collect audited financial statements from firms in industries and regions in which they have more exposure. These findings are stronger in settings in which adverse selection is acute and muted when the bank lacks experience with an exposure. Our results offer novel evidence on how bank characteristics are related to the type of financial information they use and support theoretical predictions suggesting portfolio concentration reveals a bank’s relative exper-tise.
JEL Classification: G21, G38, M40, D82, L14.
Keywords: commercial lending; monitoring; information economics; lending concentration;
finan-cial statements; bank regulation; auditing; hard and soft information; theory of the firm. *Manuscript
1 1. Introduction
Theory suggests banks’ demand for high quality financial reports varies with their lending strategies and internal information structures. For example, Stein (2002) predicts that larger inter-mediaries, with a need to transmit information to multiple agents within their hierarchical organi-zations, more frequently request verified reports from borrowers. Smaller financial intermediaries, which typically have fewer layers of internal information transfer, are conversely more likely to use soft information acquired through personal interactions with firms (Berger et al. 2005). In addition to bank size, theories suggest that exposure concentration may play an equally important role in shaping banks’ interactions with firms (Dell’Ariccia et al. 1999; Winton 1999). These theories suggest a bank’s concentration in a sector implies a degree of expertise: banks with more exposure to a sector have more interactions with borrowers and are thus more informed. Banks with less exposure, and thus fewer substitute sources of information, may demand more detailed and verified information when contracting with those borrowers, resulting in a negative relation between exposure concentration and high quality information demand.
A negative relation between the concentration of a bank’s loan portfolio and the extent of information collection from borrowers is not obvious, however. Concentration in an industry or region not only increases information about that sector, but also amplifies portfolio risk. Collect-ing more reliable and precise information about concentrated exposures is a plausible strategy for managing the risk and related scrutiny from regulators, depositors, and the board of directors.1 Thus, a positive association may emerge between a bank’s lending concentration and its high qual-ity information collection.
1 For an example of both managing credit risks and mitigating regulatory scrutiny accompanying concentration, see
the Office of the Comptroller of the Currency’s discussion document concerning concentration risk in Commercial Real Estate lending (OCC 2006).
2 Understanding the relation between the concentration of a bank’s portfolio and its infor-mation collection practices is of interest for several reasons. First, the banking market has consol-idated considerably following more than two decades of mergers and bank failures. As a result, the loan market has become more concentrated and individual bank loan portfolios have become more diverse. Depending on the relation between portfolio concentration and information collec-tion, these market shifts can affect the demand for auditing from the predominantly private com-mercial borrowers that choose whether to have audited financial statements, in part, as a function of lending relationships. Second, regulators expect banks to document more information collec-tion from their larger posicollec-tions to mitigate portfolio concentracollec-tion risk (Basel 2000; OCC 2011). Requiring more collection of hard information about concentrated positions could, however, im-pede lending to opaque firms when a bank is willing to lend based on knowledge arising from its specialization in the borrower’s sector. Despite a close link between exposure concentration and borrower monitoring techniques in theoretical models, empirical evidence establishing a link be-tween concentration and information collection is sparse because banks disclose limited details about their exposures or information collection practices.
We use a novel bank-level dataset supplied by the Risk Management Association (RMA) to examine the relation between a bank’s commercial lending concentration and its level of finan-cial information quality requested of borrowers. The dataset includes the finanfinan-cial statement col-lection records and commercial loan exposures of banks representing a substantial portion of the U.S. commercial and industrial (C&I) loan market. RMA compiles financial reports collected by member banks and categorizes them according to report type as: unqualified audit, review, com-pilation, tax return, or other. Unqualified audits provide the highest level of independent verifica-tion and the most financial informaverifica-tion. Each category is tabulated by six-digit NAICS code, six
3 borrower size groups, six regions, and the ten years 2002-2011. We use these data to measure the frequency of banks’ audit collection from borrowers and their C&I exposure concentration within a bank-year. RMA confidentially provided these data at the bank level, allowing us to map lending exposures and statement collection records by bank to FDIC call reports.
Our central finding is that banks’ audited statement collection is negatively related to port-folio concentration. We begin by using bank-year observations and find that banks with more concentrated commercial loan portfolios collect audited statements from borrowers less frequently, controlling for bank and borrower sizes and year fixed effects. Although these results reflect dif-ferences unrelated to bank or borrower size, they could be the result of omitted bank characteristics that are related to both concentration and financial report collection practices. Therefore, we use the panel structure of the data and bank-year and industry-region-year fixed effects to mitigate concerns about unobservables. We find banks collect audited statements at lower rates from bor-rowers in industry-regions in which they have more concentration. In our main specification, a one standard deviation increase in a bank’s exposure to an industry reduces the rate of audited statement collection by approximately 2.4 percentage points, or about 19% of the unconditional mean audited statement collection rate in the sample.2
In additional tests using portfolio sorts of bank size, borrower size, and concentration, we compare the magnitude of our loan concentration finding to the more broadly studied characteristic of bank size. Prior work (e.g., Stein 2002, Berger et al. 2005; Liberti and Mian 2009) argues larger banks are more reliant on hard information. Consistent with this argument, we find larger banks
2 Throughout the paper we use the term “exposure” to indicate the amount of activity that a bank engages in within a
given industry-region. The dataset does not measure the dollar value of lending between banks and commercial bor-rowers, but instead measures the number of financial statements and total amount of sales of the firms from which the financial statements are collected. We use this information to calculate a bank’s exposure to a given industry-region. In Section 3 we provide specific details of both the dataset and the variable construction and in Section 4, we demon-strate the robustness of our results to a number of alternative specifications.
4 are more likely to collect audited financial statements from borrowers compared to smaller banks, even after controlling for the average borrower size across banks. Moreover, our estimates suggest the difference in borrower audit rates across different concentration levels within bank is as large as the difference in borrower audit rates across banks of different sizes.
An explanation consistent with our evidence is that concentration fosters lending expertise. A bank with more exposure to an industry has better information about it and, thus, less need to obtain high quality (and costly) financial performance information from borrowers in the industry. By contrast, banks with less exposure to (and thus less information about) the same borrowers face an adverse selection concern, and thus demand high quality information to substitute for their rel-ative lack of expertise. We conduct cross sectional tests to further examine whether exposure concentration builds expertise, which in turn reduces demand for audited statements. First, if con-centration fosters bank expertise, our results should be stronger in settings with more severe ad-verse selection and information asymmetry concerns. We identify such settings using the extent of bank market competition within an industry-region and the performance dispersion of firms within an industry. Dell’Ariccia (2001) suggests that adverse selection concerns are most acute in imperfectly competitive banking markets, because potential entrant banks are particularly unin-formed. In such situations, novice banks will demand high quality information from borrowers to offset their information disadvantage. Next, we argue performance dispersion makes it more dif-ficult for banks with less exposure in those industries to interpret and utilize low quality infor-mation gathered from individual firms, which increases their demand for high quality reports. Thus, we expect to find stronger results in industries with more performance dispersion. We find the negative relation between a bank’s exposure to a given industry-region and its audited report collection from borrowers in that industry-region is stronger when either bank market competition
5 is lower or borrower performance dispersion is higher.
Second, if concentration allows a bank to acquire information about a given sector over time, the negative relation should strengthen as the bank gains experience. To examine this, we perform cross sectional tests based on variation in the length of bank exposures. We use only the banks that are in the dataset for all ten years and count the years each bank has been lending to each industry-region as of the last year of data. We find a negative relation between experience and audit collection and that this negative relation increases in the bank’s concentration in the given industry-region. Moreover, the negative relation between concentration and audit collection emerges only after the bank has been exposed to a sector for about four and half years, suggesting the beneficial information acquisition from concentration accumulates over time.
To further examine whether expertise through concentration is accumulated over time, and to ensure that the negative relation between concentration and audited report collection is not the result of banks lowering standards to attract new borrowers, we examine instances when banks first enter an industry-region. We find that when banks first lend to a sector, the audit rate for new exposures is 6.4% higher than for the bank’s other contemporaneous exposures. We then show the incremental audit collection rate declines as the bank gains experience in the industry-region. This finding is consistent with banks facing an adverse selection problem when entering new mar-kets and mitigating it by collecting audited statements; however, as banks better understand the new market the need for verified statements declines.
These results, however, do not address the concern that banks choose which new exposures they enter into. One example of how this concern could be a threat to our inferences is that banks could first hire a sector expert and, only after having acquired sector expertise via the new em-ployee, subsequently increase exposure to the sector while decreasing the audit collection rate.
6 This explanation differs from ours, as our hypothesis is that a bank’s increase in sector concentra-tion leads to the expertise increase.
Although we do not have random assignment of banks to new exposures, we address the concern that banks choose exposures by using the housing boom of the 2000s as a setting where bank entry into a sector is plausibly driven less by endogenous bank strategy and more by demand-side factors. The housing boom increased loan demand from construction borrowers (Lisowsky et al. 2015) and we argue banks not exposed to construction borrowers in 2002 (“novice banks”) gained exposure to construction firms by 2005, at least in part, because of the significant demand shock. We find novice banks indeed increase their relative exposure to construction lending sub-stantially during the period. We next compare the information collection of novice banks to more established construction lenders in 2005 and find that novices are more likely to collect audited statements from construction firms. These tests help corroborate our finding that banks entering a new exposure are more likely to rely on audited financial statements.
Is either an audit verification strategy or an expertise strategy related to better perfor-mance? We find no indication either future loan charge-offs or future bank return on assets is related to audited statement collection, exposure concentration, or their interaction. This offers suggestive evidence that specialized banks are trading off alternative information sources rather than recklessly forgoing audit requests.3 Given we observe performance at only the bank rather than the exposure level, we caution that our findings do not necessarily indicate banks are pursuing an optimal monitoring strategy.
3 Somewhat similar trade-offs have been documented in prior literature with, for example, Demsetz and Strahan (1997)
finding that more diversified banks do not have less risk than specialized banks, but instead offset the risk-reducing impact of their diversification by operating with greater leverage and larger commercial and industrial loan portfolios.
7 Our study makes two contributions. First, it furthers our understanding of how organiza-tional characteristics of a contracting party are related to the use of financial information by that party (e.g., Berger et al. 2005; Brickley et al. 2009). Our finding that bank concentration within an industry is negatively related to the use of higher quality financial reports is consistent with Paravisini et al.’s (2015) result that banks concentrating in particular Peruvian export markets pos-sess expertise that shapes their lending decisions. We advance this line of work by showing how a bank’s expertise relates to its screening and monitoring activities, and examining different chan-nels through which banks use and develop expertise.
Second, we contribute to an emerging literature linking financial reporting to the charac-teristics of capital providers (e.g., Gormley et al. 2012; Lo 2014; Kalay 2015).4 Our hypothesis is that banks have more substitute sources of knowledge about borrowers from industries in which they have more expertise and this reduces their demand for costly audits for such borrowers. Our results are consistent with this hypothesis, implying that one source of bank demand for verified financial reports is a lack of substitute knowledge from sources such as relationships or industry experience. Considering that the typical U.S. bank is much larger and less specialized following decades of consolidation, our findings are relevant to the literature examining factors affecting the use of financial reporting in capital allocation.
2. Prior literature and motivation
Seminal research by Diamond (1984) and Boyd and Prescott (1986) models banks as del-egated monitors with an advantage in providing loans. A key force driving the net benefit of delegating private information collection about, and monitoring of, borrowers to a bank is the di-versification of borrowers in the bank’s portfolio. Didi-versification reduces the risks associated with
4 Our study also relates to a broader literature examining how intermediaries accumulate and employ expertise in the
8 idiosyncratic shocks and lowers the costs of monitoring the bank by depositors, thus increasing the bank’s likelihood of meeting its obligations to depositors and allowing the bank to bear lending risks at a lower risk premium than individual investors. Moreover, such diversification need not arise exclusively from the mix of loans the bank originates, but can be bolstered when banks re-balance their loan portfolio exposures by buying and selling loans (Cebenoyan and Strahan 2004).
Traditional arguments based on these foundational papers suggest banks will avoid con-centration risk. These arguments, however, presume banks are equally informed about all expo-sures in the economy. Winton (1999) argues that a bank’s monitoring effectiveness is lower in new sectors. Dell’Ariccia et al. (1999) develop a model of bank competition in which banks ac-cumulate information about borrowers over time. Incumbent banks become sector experts, creat-ing information asymmetry between themselves and potential entrants. In both models, adverse selection makes it difficult for banks to perfectly diversify their lending portfolios. More broadly, a within-firm agency cost framework suggests specialized lenders are better able to collect infor-mation that is less verified and that such lenders also have more incentives to do so (Rajan 1992, Stein 2002, Berger et al. 2005, Liberti and Mian 2009).
Empirical research has only recently begun investigating the tensions between concentra-tion risk and bank expertise. Acharya et al. (2006) use 105 Italian banks during 1993-1999 and find that, for high-risk (low-risk) banks, expansion by lending to new industries is associated with riskier loans and lower returns (marginally higher returns). Tabak et al. (2011) also examine banks’ exposures by industry, finding increases in the scope of lending are associated with lower returns and higher bank default risk in a sample of Brazilian banks. Loutskina and Strahan (2011) investigate geographic concentration in U.S. banks by studying mortgage lenders. They find that when such lenders specialize in a few markets they invest more in information collection than their
9 more geographically diversified peers. As a result, concentrated mortgage lenders tilt their lending more toward the information-intensive non-conforming (jumbo) mortgages and toward high-risk borrowers. Liberti et al. (2016) show that lenders expand their geographic and sector exposures after sharing information with one another, and trace individual lenders’ expansion decisions to their collateral expertise. In addition to considerable theory and some empirical evidence on the tensions between bank concentration and information collection, these issues are of interest to policy makers and bank regulators. Regulators offer guidance cognizant of the tradeoffs between specialization and concentration risk:
. . . due to a bank’s trade area, geographic location or lack of access to economically diverse borrowers or counterparties, avoiding or reducing concentrations may be extremely diffi-cult. In addition, banks may want to capitalize on their expertise in a particular industry or economic sector. [B]anks should not necessarily forego booking sound credits solely on the basis of concentration, [and] must be careful not to enter into transactions with borrow-ers or counterparties they do not know or engage in credit activities they do not fully un-derstand simply for the sake of diversification. (Basel Committee on Banking Supervision 2000, Item 67).
The unsettled state of the policy debate surrounding how concentration risk should be man-aged (see Barth et al. 2004, Boyd and De Nicolo 2005, and Beck et al. 2006 for a review) aligns with the conflicting regulatory guidance. On one hand, regulators advise banks to diversify their exposures both geographically and by industry to avoid concentration risk. Conversely, regulatory documents detail various ways in which regulators expect banks to gather, store, and expertly as-sess information about borrowers and loan applicants to reduce adverse selection and moral hazard (OCC 2011, 2014; OIG 2012). These two aspects of regulatory advice for banks are in conflict if adverse selection or monitoring costs tend to be higher when lending to a new region or sector. We thus contribute to the policy debate by measuring how banks trade off concentration with collection of high quality borrower information.
10 New exposures can produce adverse selection and moral hazard costs. In part, these costs may arise due to banks having less expertise about borrowers from industries or regions in which they have less experience. If so, one way banks might lower adverse selection costs when expand-ing their industrial or geographic reach is by increasexpand-ing their demand for audited financial reports, which are highly verified and contain more information than alternatives such as tax returns. Thus, especially for the generally non-public borrowers likely to constitute the overwhelming majority of loan applicants and borrowers, the bank’s degree of expertise in a given exposure may have important implications for the demand for external audits.
Audits add direct costs (e.g., fees) and indirect costs (e.g., opportunity costs of time) rela-tive to other report types, but create three benefits. First, audited information is more contractible because a third party has verified it (Watts and Zimmerman 1983). Second, audited statements have less reporting noise than financial statements that are merely reviewed or compiled by an external auditor, leading such statements to better reflect a firm’s performance and health—i.e., audited statements are more informative (Minnis 2011). Third, relative to reports such as tax re-turns, audited statements contain all three financial statements and full footnote disclosure, and thus have more information. Collectively, we hypothesize that audited financial statements are more useful for a bank’s loan monitoring and screening when it is less familiar with a borrower’s industry or region, but because audits are more costly, expert banks will use alternative report types more frequently.
3. Sample, data and variable construction
Our data come from the RMA’s Annual Statement Studies. Each year, RMA compiles the financial statements gathered by member banks from commercial borrowers and loan applicants, and publishes summary statistics in its Annual Statement Studies. The Studies detail the number
11 of statements collected from firms according to five mutually exclusive categories: unqualified audit, review, compilation, tax return, and other. Financial reports collected are further partitioned according to six-digit NAICS code, borrower size group (under $1M of revenue, $1M-$3M, $3M-$5M, $5M-$10M, $10M-$25M, and greater than $25M) and region (Northeast, Southeast, Central, South Central, North Central, and West).5 While the publicly available studies report aggregate figures across all banks, RMA has confidentially provided us with the disaggregated data linked to the contributing banks. Appendix A provides additional details about the construction of the dataset.
These data allow us to observe the exposure and financial statement collection practices of a broad set of U.S. banks. In its annual Survey of Credit Underwriting Practices, the OCC notes financial reporting is a key element of underwriting, defining underwriting standards as “terms and conditions under which banks approve, extend, or renew credit such as financial reporting, collateral requirements, repayment terms, pricing, and covenants” (OCC 2014, p. 2, emphasis added). Consistent with the overall population of firms, the vast majority of RMA sample firms are privately held, meaning that banks’ requests for GAAP financial statements with unqualified audits are often costly, providing meaningful tension for our study.
Three features of the RMA data raise selection and measurement issues. First, while banks have to submit their firms’ financial statements according to RMA’s protocol if they participate, bank participation is voluntary. This is problematic if participants are not representative of the
5 Table A5 of the online appendix compares the distribution of financial reports by industry as reported in the RMA
dataset to the overall economy, the firms in Compustat, and the firms in the Sageworks dataset (Minnis 2011). The distribution of firms in RMA is similar to that of the economy, except RMA has more manufacturing, wholesale trade, and real estate firms, and fewer services-related firms. Compared to Compustat, the RMA dataset has fewer firms in mining, utilities, manufacturing, and insurance (industries with firms that are typically large, regulated and have a higher propensity for being public) and more wholesale trade and real estate firms. The RMA distribution is most similar to the private firm dataset collected by Sageworks, with the exception that the Sageworks dataset (which is primarily generated from accounting firms) has a higher concentration of construction firms, which have a surety-driven demand for accounting services.
12 banking market or if their choice to participate is related to their monitoring and exposure strate-gies. Fortunately, we observe which banks participate each year and can compare them to those banks not participating. In Table A1 in the online appendix, we tabulate a variety of descriptive analyses related to bank participation. We do not find any significant differences in the amount of capital or financial performance (as measured by return on assets) between participants and non-participants, but do identify two differences. Not surprisingly, participating banks have more of their loan portfolios invested in commercial loans (relative to consumer or mortgage loans, for example) and the RMA dataset banks are larger than banks not in the dataset.
While ideally one would want randomly selected banks in the dataset to ensure generaliza-bility, neither the commercial lending nor the size difference seems particularly problematic for our study. Banks with more commercial lending activity are the banks we are more interested in, so participation based on commercial lending activity seems innocuous. Consistent with the skew-ness in the population of bank assets, more than 40% of the total commercial and industrial loan balances during our sample period are held by the ten largest C&I lenders (FDIC call reports). In each year of our sample, at least eight of these top ten commercial lenders participate in the RMA dataset, except for two years in which seven (six) participate. Thus, because the U.S. banking market is highly concentrated and large banks are overrepresented in our sample, our dataset in-cludes a large portion of the commercial lending activity in the U.S. At the same time, the dataset includes a broad cross section of banks according to size, location, business model, and perfor-mance. Nevertheless, because participation is not random we interpret our results with caution as they may not be generalizable.6
6 Major lenders including Bank of America, JPMorgan Chase, SunTrust Banks, Wells Fargo, and Zions Corporation
appear every year, and these five banks alone are responsible for nearly one-fifth of U.S. C&I lending by banks during the sample period according to call report data. The sample also contains other large banks that appear every year until they failed or were acquired (e.g., National City, Wachovia, and Washington Mutual). The top commercial
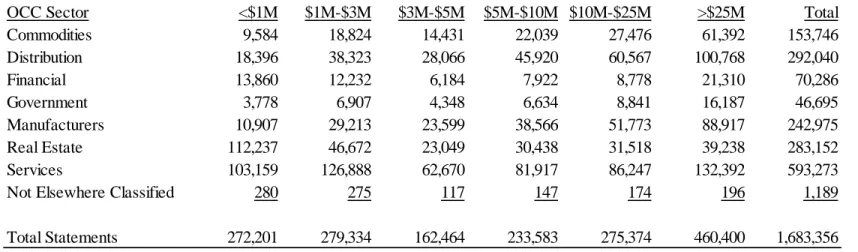
13 Second, the financial statements collected by banks can be part of either the application or ongoing monitoring process, meaning some of the statements we use to measure exposures are from firms that were rejected or received loans elsewhere. Unfortunately, the RMA data do not detail whether the statements were provided by actual borrowers of the bank nor the dollar value of any loans made. That said, we are comforted by the strong correlation (0.74) between the cu-mulative borrower sales for the bank (which we use to calculate our exposure measure) and the size of the C&I loan portfolio reported by the bank to the FDIC. Moreover, banks develop industry expertise through both loans and information collection during screening, meaning statements col-lected during the application stage are informative about the bank’s specialization. Ultimately, any noise that this data feature introduces will make it harder for us to find relations consistent with our predictions. A third and related issue is that we do not observe loan terms, which prevents us from exploring any link between exposure concentration and loan terms or loan-level outcomes (e.g., De Franco, et al. 2015). Related, we cannot identify syndicated loans in our sample or sep-arate statements collected by lead arrangers from those collected by other syndicate participants.7 Table 1 provides a variety of statistics about the reports compiled by RMA and the banks that collect them. Panel A reports that RMA compiled almost 1.8 million financial reports col-lected by financial institutions between 2002 and 2011.8 We eliminate 72,220 statements from
lenders are also among the biggest small business lenders. Per call report data, the top ten overall commercial lenders hold one-third of the loans made below $1 million, suggesting sample selection toward bigger banks still covers a significant portion of small business lending. We report the top ten commercial lenders and their participation each year in Table A2 of the online appendix. While a significant portion of C&I lending is conducted by bigger banks, the sample also includes smaller banks. As we report in Table A1 of the online appendix, the 25th percentile of total assets
for participating banks is $278 million.
7 We conduct two robustness tests to assess whether the inclusion of statements from syndicated deals affects
infer-ences. First, we eliminate every statement collected from firms with more than $25 million of revenue, a borrower segment that comprises the majority of syndicated transaction volume. Second, we exclude the 30 biggest banks in each year of our sample, which underwrite the majority of syndicated loans. In both cases, our main results maintain.
8 We begin our sample in 2002 because this is the earliest year for which RMA has maintained the data electronically
14 twelve bank-years that have over 100 statements from firms with at least $25 million of revenue but zero unqualified audits, given these likely reflect data errors.9 The total number of statements compiled by RMA generally increases over the sample period. However, the portion of statements that are unqualified audits is declining. In 2002, the 30,157 unqualified statements collected rep-resent 23.4% of statements collected, whereas in 2011 the 40,130 unqualified statements constitute 19.5% of statements obtained. The South Central and North Central regions provide fewer state-ments than the remaining four regions. Finally, firms with sales in the $3-$5 million range provide fewer statements than other size groups, whereas those with sales in excess of $25 million contrib-ute the most statements.
Table 1, Panel B summarizes bank-level reporting for the 728 financial institutions that provide at least one year of data during 2002-2011. The median bank contributes data to RMA for three years, in part because consolidation in the banking industry has eliminated banks during this period and in part because some banks do not provide data to the RMA for all possible consecutive years. The majority of statements come from large banks that participate regularly in the RMA Annual Statement Studies: 56.4% (89.1%) of sample statements come from banks that contribute every year (at least five years). Tables A3 and A4 in the online appendix tabulate additional details regarding bank participation conditional on the number of years in the dataset.
Table 2, Panel A provides statistics for our main variables at the bank-year level. Our main dependent variable of interest is the proportion of financial reports that a bank collects that are unqualified audits. We refer to this variable as % Unqualified. We focus on audited statements because they provide substantially more verification and information than the other report types. Though other RMA statement categories include reports with some level of verification, audits
15 require positive assurance (in contrast to reviews which have negative assurance or tax returns with statistical or implicit monitoring). Audited statements also provide the most information (e.g., in contrast to tax returns, audited financial statements have a Statement of Cash Flows and com-plete footnotes). This additional verification and information is reflected in the significantly higher cost of audits relative to the other report types, providing revealed preference evidence of the in-cremental benefit of audited statements. However, our results are similar if we also consider re-viewed statements as high quality financial information. An average of 12.8% of the financial statements collected have unqualified audits. This figure is well below the Table 1, Panel A sta-tistic which reports that 21.3% of all statements in the database have unqualified audits. The dif-ference occurs because bigger banks—which have bigger borrowers and higher audit rates—sup-ply relatively more of the RMA data but the bank-year statistics in Table 2 are equally weighted.
Table 2 also reports that there is skewness in the data, consistent with the skewness in the population of banks. The mean (median) bank-year has 527 (72) financial statements collected each year.10 Cumulative borrower sales for the average bank is $161 billion and the average bor-rower firm size for the average bank-year is $279 million; however, both distributions are highly right-skewed, as the median bank’s borrowers’ cumulative sales volume is just over $2 billion and the average borrower size for the median bank is $21 million in sales.11
Our main analyses examine how the collection of financial statements with unqualified
10 As the number of financial statements that the median bank collects is an interesting descriptive statistic, and
po-tentially surprisingly small, it is worth putting this number into context. Table A1 in the online appendix shows the median bank has $62 million in C&I loans. Therefore, the 72 financial statements should be compared to the $62 million in loans, or about $860k per borrower, which is a reasonable C&I loan size for the median bank, given that the median bank has only $635 million in total assets and would limit its exposure to any particular borrower (Gup and Kolari 2005). This statistic reinforces the skewness in banking activity in the U.S., which is reflected in the data: big banks hold a very large portion of the C&I loans (to big and small borrowers) in the U.S.
11 In the publicly available version of the RMA Annual Statement Studies, RMA truncates firms with more than $250
million in assets. These firms were not truncated in the data made available to us in order to provide more complete exposure detail.
16 audits varies with the concentration of the bank’s C&I loan exposures. The remaining Table 2, Panel A statistics summarize our measures of concentration. We first measure the overall level of a bank’s C&I exposure concentration. The # Unique Industry (Region) Exposures measures, at the bank-year level, the number of unique OCC industries (regions) from which the bank collected financial statements.12 The average bank-year has data from 36 industries and slightly more than 2 (out of a possible of 6) U.S. regions. Combining these two dimensions into the variable # Unique
Industry-Region Exposures indicates that banks operate in approximately 52 industry-regions, on
average. We use a standard measure of concentration, the Hirschman-Herfindahl index (HHI), to measure the overall extent of exposure concentration within a bank-year. HHI is equal to the sum of the squares of the relative exposures, where each relative exposure is the exposure as a fraction of the bank’s total exposure. Deflating by bank rather than total industry exposure allows us to disentangle the effects of bank size and concentration, and account for the fact that banks of all sizes accumulate more expertise in their larger exposures.13 We calculate HHI using the industry-region level of data and measure exposure to an industry i in industry-region r for bank b in year t by summing the sales of all firms providing financial statements to bank b:
2 , , , , 1 , 6 , , , , 1 1 1 F b f i r t f b t I F b f i r t i r f Sales HHI Sales
. (1)The closer HHI is to one, the more the bank’s commercial exposures are concentrated within fewer
12 To examine industry exposure through a similar lens as bank regulators, we map three-digit NAICS industries into
OCC industry definitions using Appendix A of OCC (2011). Roughly 80% of three-digit NAICS industries map directly into OCC industries. Also see Table A6 of the online appendix for a list of OCC industry groups and the frequency with which audited financial statements are collected across those groups.
13 For robustness, we calculate a variety concentration measures, including a count of the number of industries required
to accumulate 50% (66%, 75%) of a bank’s C&I exposure, what portion of a bank’s exposure the top 5 (10) industries constitute, and alternative specifications of the definition of industry. The results in our paper are not sensitive to the calculation of concentration and these specifications have been tabulated in Table A9 in the online appendix.
17 industry-regions. Panel B of Table 2 shows the time trend of both the # of Unique Industry-Region
Exposures and HHI from 2002 to 2011. Overall, bank C&I exposure concentrations are
decreas-ing, but the time trend differs considerably across bank sizes. The largest banks, which begin with very diverse portfolios, are becoming more concentrated over time. By contrast, the smaller banks (which begin with more concentrated C&I exposures) are becoming more diverse.
We next measure banks’ exposures to each particular industry-region within a year. We sum the commercial loan exposure bank b has to all firms f in industry i in U.S. region r in year t and then divide this numerator by bank b’s total commercial loan exposure across all industries and regions in year t. This variable, which we refer to as Share_bank, measures bank b’s exposure to industry i in region r relative to all other commercial exposures in its own portfolio in year t:
, , , , 1 , , , 6 , , , , 1 1 1 _ F b f i r t f b r i t I F b f i r t i r f Sales Share bank Sales
(2)To ensure robustness of our results, we calculate a bank’s exposure to an industry-region two alternative ways. First, we use the same numerator as Share_bank, but instead divide it by the total commercial loan exposure in the same industry, region, and year for all banks in the sample. This approach measures bank b’s exposure to industry i relative to all other banks in region r:
, , , , 1 , , , , , , , 1 1 _ F b f i r t f b r i t B F b f i r t b f Sales Share market Sales
. (3)Second, in the variable Share_bank, we calculate both the numerator and denominator using the sales of firms in each industry-region; however, our results are robust to using the number of fi-nancial statements collected instead. We refer to this alternative variable as Share_statements in
18 Table 2.14 Table 2 reports that the average bank has 6.1% of its C&I portfolio exposed to a given industry-region. Similar to the bank-level exposure concentration measures reported in Table 1, the exposure concentration statistics in Table 2 indicate that these industry-region-based measures also have right-tail skewness.
Collectively, these descriptive statistics highlight two important facts. First, there are ex-tensive differences in financial statement collection practices across banks. Second, banks have significant heterogeneity in concentration levels across industry exposures. We now examine how these characteristics co-vary in our main tests.
4. Tests and results
4.1 Concentration and audited statement collection across banks
We begin by examining the association between audited statement collection (%
Unquali-fied) and portfolio concentration across banks. Table 3 presents our bank-level results using
re-gressions of the following form:
, 1 , 2 ,
3 , ,
% b t b t b t
t
b t b t
Unqualified HHI LogCumulativeBorrowerSales
LogAverageBorrowerSize
, (4)
where the unit of observation is a bank-year. Each column includes a control for the bank’s aver-age borrower size that is calculated as the natural logarithm of the total sales for all of the bank’s
14 A mechanism underlying the hypothesis that concentration leads to expertise is that a bank gathers more information
as it concentrates in an industry-region. It is not clear whether using the amount of borrower sales or the total number of financial statements collected is a better approach to measure a bank’s lending exposure. Measuring exposure based on borrower sales has the advantage that the financial statements collected from larger firms may be more informative and therefore should receive more weight in the analysis. On the other hand, collecting financial state-ments from more firms could provide the bank with more information, regardless of firm size (i.e., each firm should get equal weight). All of our results are robust to either approach. One additional approach could be to measure the level of lending that the bank has in each exposure. We cannot use this measure because the dataset does not provide this information, but it is not clear this would be a superior metric. Banks receive information from firms that apply for loans but do not become bank borrowers, which our sales and financial statement measures identify, but a lending-based measure would not.
19 exposures divided by the number of statements collected for these exposures. Each regression also includes year fixed effects (t) so that any secular trends will not affect our inferences (e.g., Lisowsky et al. 2015). To address concerns about serial correlation in our loan concentration measures, standard errors are clustered by bank.15
In column (1) of Table 3, the coefficient on HHI is significantly negative, indicating that banks with more concentrated exposures collect audited financial statements less frequently. In column (2) we regress % Unqualified on Log Cumulative Borrower Sales (a measure of bank size) and find a significantly positive coefficient estimate. This result is consistent with the prediction of Stein (2002) and findings of Berger et al. (2005) in which bigger banks are more likely to collect hard information (in this case, audited financial statements) even after controlling for the average borrower size. In column (3) we include both HHI and Log Cumulative Borrower Sales and find that, while the magnitudes of both variables attenuate, both remain significant. In summary, Table 3 provides evidence that loan exposure concentration has a strong negative association with au-dited statement collection even after controlling for the positive association that bank size has with audited statement collection.
4.2 Specialization and audited statement collection within-bank
Our findings in Table 3 that concentrated lenders collect a lower portion of audited finan-cial statements is consistent with more spefinan-cialization facilitating more substitute information ac-quisition by the lender. These results could, however, be driven by unobservable bank character-istics, such as bank-wide policies about what information loan officers must collect, or differences in audit rates across industries that are spuriously correlated with bank-level exposures. Therefore,
20 we now examine the relation between exposure concentration and financial statement collection both across and within bank.
In Table 4, we first partition each bank’s portfolio within bank-year into terciles based on the bank’s exposure to a given industry-region. That is, each bank’s portfolio is allocated evenly across the concentration terciles (i.e., one-third of the industry-regions of a given bank are in each tercile based on the variable Share_statements within a bank-year).16 This is the “within bank” portion of the analysis. We then partition the banks based on size, according to the total borrower sales for each bank-year as reported by RMA. This is the “across bank” portion of the test. One-third of the banks are in each bank-size tercile. We tabulate the results of the two way sort (con-centration tercile by bank size tercile) by borrower size group. This partition allows us to compare the rate of unqualified audit collection within borrower size group and bank-year, across industries in which the bank has a small, medium, or large portfolio share. We calculate the percentage of financial statements that are unqualified audits in each portfolio.
The main messages from Table 4 are: (1) concentration is negatively related to audited financial statement collection, and, (2) the importance of concentration is of similar magnitude as bank size. This point can be seen by examining the bottom two sets of figures in Table 4. The section captioned “Bank size tercile differences” shows, within each of the six borrower size groupings, the difference in the percentage of collected statements with unqualified audits across the top versus bottom tercile of bank size. Consistent with theory (e.g., Stein 2002), audited state-ment collection is higher for larger banks for all six borrower size groupings.
The bottom section captioned “Concentration tercile differences within bank size tercile”
16 In untabulated robustness tests, we also form the concentration terciles based on sales weighting the observations,
and the results are broadly consistent. The only difference is that there are few observations in the low concentration portfolios for the largest borrower size group, affecting the results in these portfolios.
21 summarizes how audited statement collection differs across exposure concentration terciles within a given bank size tercile and for a given borrower size. The sign in all 18 cells in this bottom section is always negative, demonstrating that across all bank and borrower sizes the collection of audited financial statements is lower when the bank’s exposure to the borrower’s industry-region is higher.17 Note that the absolute values of the figures in these bottom 18 cells match quite closely the magnitudes of the “Bank size tercile differences” immediately above. For example, for bor-rowers with less than $1 million of sales, the “bank size tercile difference” is 1.3% and the absolute values of the concentration tercile differences are 1.0%, 1.4%, and 1.7% for the three bank size terciles. Thus, the negative relation between exposure concentration and audited statement collec-tion is of similar magnitude to the positive relacollec-tion between bank size and audited statement col-lection.
We now turn to Table 5. Our identifying variation in these tests is the exposure to different industry-regions within a given bank-year, thus the unit of observation is bank-industry-region-year. Each Table 5 regression includes a control for the average borrower size and clusters stand-ard errors at the bank level.18 The specification in column (1) uses Share_bank as the concentration variable of interest and the regression includes separate indicators for each bank, region, industry, and year: , , , 1 , , , 2 , , , 3 , , , , , , % b r i t _ b r i t b r i t b r i t b r i t b r i t
Unqualified Share bank LogCumulativeBorrowerSales
LogAverageBorrowerSize . (5)
17 Why, then, do any firms bother approaching banks less concentrated in their industry, when more concentrated
banks are less likely to request a costly audit? Prior research points to several explanations. First, foregoing an audit makes the firm more opaque, which can expose it to hold-up problems (Rajan 1992). Second, providing an audit can reduce the interest cost of the loan and facilitate contracting on the firm’s financial statements (Blackwell, Noland, and Winters 1998). Third, from the bank’s perspective, at some exposure level the costs of concentration risk begin to outweigh the benefits of relying on economies of scale in screening and monitoring within the same industry (Dia-mond 1984; Boyd and Prescott 1986).
18 In untabulated robustness analyses of our main results, we find that two-way clustering by bank and industry or
22 Column (2) also uses Share_bank as the concentration variable, but uses a multidimensional fixed effect specification of bank-year and industry-region-year fixed effects:
, , , 1 , , , 2 , , , , , , 3 , , , , , , % b i r t _ b i r t b i r t b t i r t b i r t b i r t
Unqualified Share bank LogCumulativeBorrowerSales
LogAverageBorrowerSize
. (6)
Our goal in using these fixed effects is to isolate the relation between concentration and audited statement collection separately from other factors, such as bank-wide policies or industry trends and regional shocks that affect demand for credit. Columns (3) and (4) have the same fixed effects specification as equation (6) but replace Share_bank with Share_market and Share_statements as the independent variables of interest. Column 5 examines Share_bank but uses bank-industry-region and year fixed effects.19
The inference across all specifications is the same, namely that greater exposure within a bank to a given industry-region is associated with a significantly lower percentage of audited state-ments. The coefficient estimate on Share_bank is reduced modestly in column 5 relative to col-umns 1 and 2, which is unsurprising given the inclusion of bank-industry-region fixed effects in this final specification. Moreover, the estimates from Table 5 are economically significant. For example, the coefficient estimate of -0.271 in column (2) indicates that a one standard deviation increase in a bank-years’ exposure to the industry-region (9.0%, see Table 2, Panel A) reduces the rate of audited statement collection in that industry by 2.4 percentage points. This represents a meaningful one-fifth reduction relative to the unconditional mean audit rate of 12.8%.20
19 The variation in this specification comes from changes in a bank’s exposure to an industry-region. Our hypothesis
development is based on the premise that banks are strategic in the exposures they have to various industry-regions and in the nature of the information they collect from these exposures. If banks generally select their exposures strategically, the exposure of each bank to any given industry-region may tend to remain quite stable over time. In-deed, our main independent variable of interest (Share_bank) does not have much variation year-to-year, and the variation that does exist is in the extreme tails (perhaps indicative of shocks or large strategy shifts). We thus caution against generalizing our results under this approach.
20 As another way to consider economic magnitudes, we provide an illustrative example. In the western region in
23 Our theoretical framework suggests two cross sectional tests to reinforce our main infer-ence. First, Dell’Ariccia et al. (1999) suggest that imperfect competition in banking markets arises in part from adverse selection problems. Their argument is that when more of a lending market is served by relatively few banks, those with little exposure (or potential entrant banks) face an ad-verse selection concern when assessing borrowers. Therefore, in less competitive banking markets the high exposure banks (which know more about the borrowers) will have less demand for fied information from borrowers, whereas low exposure banks will have greater demand for veri-fied information to combat the adverse selection problem. In Table 6, panel A, we split each industry-region based on its degree of banking competition.21 We find the greatest sensitivity of verification standards to concentration in those markets with the lowest level of banking competi-tion. Moreover, as we increase the threshold defining “low competition,” the difference in the coefficient estimates of interest across the partitions becomes larger, although the differences are only significant at conventional levels for the most extreme partitions.
Second, if expertise is particularly important in industries where firm performance is dis-persed because information about any given firm is less useful for evaluating the creditworthiness of other firms in the same sector, then our results will be stronger where the performance dispersion of firms is higher. When firms within an industry perform significantly differently than one
top five banks in the region in terms of their portfolio exposure had approximately 26% of their C&I portfolios in this industry-region, on average. The bottom five banks had a negligible portion (<0.1%) of their portfolios allocated to this industry-region. Our results suggest, ceteris paribus, that if a merchant wholesale borrower matched with an “expert” bank, its likelihood of providing an audited financial statement would be 7 percentage points lower (-0.271 x .26), or 56% lower than the unconditional mean audit rate of 12.5% for this industry-region in 2011. As the ceteris paribus conditions are not likely to hold (and other factors, such as bank size, borrower size, etc. could be further considered), this is only an illustration.
21 Specifically, we use the RMA data and calculate a Herfindahl-Hirschman index for each industry-region-year. Note
that in contrast to the Share_bank variable which calculates the relative portfolio holdings of an industry-region within a bank-year, the industry-region index we calculate here is the degree of lending concentration among banks within a given industry-region-year, similar to a standard industrial organization view of market concentration.
24 other, the financial performance of one firm is not particularly informative about the creditworthi-ness of another and, as a result, industry expertise is more crucial to screening and monitoring.22 In Table 6, panel B we partition the Table 5 results after characterizing industry-years as having low or high firm performance dispersion, where firm performance dispersion is based on the in-terquartile range (IQR) of return on assets (ROA).23 In column 1 of the table, we split the data based on the median industry-year ROA IQR and find that the relation between a bank’s concen-tration and audited financial statement collection is higher in the high dispersion industries. In columns 2 and 3 we partition the sample on increasingly higher thresholds of ROA IQR. We again find that the disparity in our coefficient estimates of interest becomes progressively larger, though the differences are not always statistically significant. These results suggest that the concentration-verification tradeoff is more acute in industries in which borrower performance may be difficult to discern for a bank with little exposure (i.e., expertise). In sum, these cross sectional tests reveal that when information asymmetry or adverse selection concerns are severe, the concentration-ver-ification tradeoff is more apparent, consistent with the inference that concentration reveals a bank’s expertise.24
4.3 Audited statement collection and bank experience
In the previous section, we examined variation in the rate of unqualified audit collection
22 The more intense relation between audit requests and concentration in industries with low dispersion is not obvious,
however. For example, if firms within a given industry are very similar, then (as an extreme example) one audited financial statement may be sufficient for a bank to learn everything needed about all firms in the industry. As the bank’s concentration then increases in the industry, the audit rate mechanically reduces because the marginal financial statements requested would not need to be audited financial statements.
23 We use data from Compustat and calculate each firm-year’s return on assets (defined as NI divided by AT). We
then calculate the interquartile range of ROA for each industry-year. Industry-years with larger (smaller) IQRs are called “high (low) dispersion” industries.
24 To ensure the robustness of our results, we tabulate three additional cross sectional tests. In Tables A10, A11, and
A12 of the online appendix we partition the sample based on bank size, portion of lending that is to C&I borrowers, and amount of regulatory capital, respectively. We find a significantly negative association between portfolio con-centration and unqualified audit collection across all of the partitions, except banks within the smallest size tercile, which have small C&I portfolios and contribute few statements.
25 for a given industry as a function of the bank’s exposure to that industry. We argue these findings support the view that concentration reflects a bank’s opportunity to accumulate expertise, which reduces the benefit of audited financial statements. If this argument has merit, we should find the relation between exposure size and audit rates varies as banks accumulate experience in the expo-sure. In this section we consider how a bank’s lending experience to a sector over time is related to expertise as reflected in the audit requirements the bank imposes. We are unaware of prior evidence about how experience combines with the number of firms falling within a shared group-ing to shape a lender’s expertise about firms within the groupgroup-ing. A contemporaneous paper that touches on a similar issue is Shroff et al. (2016), which finds that the number of peers a private firm has affects its initial interest rate for newly issued public debt.
We begin by measuring a bank’s experience by counting the number of years it has con-tributed data to RMA from each industry-region. To mitigate noise in the measure, we use only banks that contribute data across all 10 years and examine only the final year of the sample.25 A bank’s average industry-region exposure has been in its portfolio for seven years. In column 1 of Table 7, we replicate our main result from Table 5, column 2 but with our more restrictive sample from 2011 and continue to find a negative coefficient estimate on Share_bank. In column 2 we then include the time series variable, Years Experience, and find that the coefficient estimate on
Share_bank slightly attenuates from column 1 and a negative coefficient on Years Experience,
suggesting that as banks spend more time in a given industry-region, audited report demand de-creases. To provide some context on the economic magnitudes, the coefficient estimate on
25 The results are not sensitive to the choice of years. In untabulated results, we ease the 2011 restriction and include
banks from 2009 to 2011. We also ease the restriction on the minimum number of years in the RMA dataset to six or eight. In either case, the results remain similar.
26
Bank_share from this table suggests that a one standard deviation change in Bank_share is
asso-ciated with a 1.8 percentage point change (-0.2 x 9%) in the audit rate. This compares to about 2.6 additional years of experience in the sector (divide 0.018 by the coefficient estimate on Years
Experience of 0.007). In column 3, we then interact Share_bank with Years Experience and find
that the coefficient estimate on Share_bank is no longer significant (and in fact becomes weakly positive), but that the interaction term is significantly negative. Dividing the Share_bank main coefficient estimate by the interaction coefficient estimate indicates that after 4.5 years the relation between concentration and unqualified audits becomes negative, suggesting that only over time does concentration lead to expertise. Moreover, these results suggest that each year of experience provides more expertise when banks have more concentration in the industry-region.
To further investigate how quickly banks accumulate expertise within an exposure concen-tration, we examine banks’ behavior in, and after, the year of entering new industry-regions. To implement this analysis, we create an indicator variable New Exposure This Year for industries the bank was not exposed to in the previous year and which are one of the top ten exposures for the bank-region in the current year. We restrict our attention to new exposures above this threshold to ensure we are measuring cases where the bank is making a meaningful effort to enter the indus-try. We omit observations that are in the first year that a bank appears in the RMA dataset because we have no way of knowing what exposures are new versus preexisting. Using this approach, the indicator for New Exposure This Year equals one for 4.9% of our observations. Our Table 8 spec-ifications control for firm size, cluster standard errors at the bank level, and include bank-year and industry-region-year fixed effects. The results indicate that when a bank takes on a meaningful exposure for the first time, collection of unqualified financial statements from firms in that new exposure is significantly higher than otherwise. Controlling for bank-year and
industry-region-27 year effects, the average audit rate for new exposures is 6.4% higher than the same bank’s other contemporaneous exposures.
Next, in columns 2-4, we examine how the audit rates for new exposures evolve over time. We find that after two years, the incremental audit rate for new exposures is only 5.0%, and after four (eight) years is only 4.4% (-0.1% and not significant). These results are thus consistent with our earlier findings indicating an economically meaningful link between lending experience and audited financial statement collection. As important, these results do not provide support for the hypothesis that banks lower audit standards to increase exposure, which would produce a spurious negative correlation between exposure and audit collection.
5. Addressing Concerns that Banks Choose Exposures – the Construction Boom The tests to this point control for bank-year and industry-region-year fixed effects, so our findings cannot be a simple artifact of bank policy, bank condition, differences in audit rates across sectors, or industry trends. However, the tests do not address concerns that banks choose which exposures to specialize in and that borrowers may know whether a bank specializes in their indus-try. This could be a concern, for example, if banks hire a sector expert and, as a result, concentra-tion increases and audit rates subsequently decline.26 Although we do not have random assignment of banks to new exposures, we address the concern that banks choose exposures by using the housing market boom of the early 2000s as a setting where exposure changes are plausibly due to a demand shock rather than supply-side shifts by banks. A key strength of this approach, which is widely used in labor economics (see Bartik 1991; Blanchard and Katz 1992), is that it exploits
26 Our hypothesis is that concentration leads to expertise, not that banks hire experts who then increase concentration
and reduce audit collection. Therefore, although we expect banks to have experts in sectors where they have their portfolios concentrated, we are trying to rule out that our results are primarily driven by experts arriving first and then producing concentration.
28 existing cross-sectional differences in industry exposure by interacting them with national or re-gional shocks or trends.27 We argue that a shift in the supply of financing for consumers to pur-chase houses led to a demand shift in financing from construction firms to build them. This struction demand shift then led banks with little or no initial construction exposure to enter con-struction lending without necessarily planning to do so. We thus compare the audit collection rates of “novice” banks that entered construction lending as a result of the boom to more seasoned banks that had been exposed to construction all along.
While our approach does not address all concerns related to the endogenous strategies of banks, there are two reasons it helps. First, our argument is that at least some portion of the housing boom change in construction loan exposure was a result of construction firms applying for credit from new lenders, as opposed to ex-ante strategizing by bank management to enter construction lending. Second, the regional pattern of the housing boom allows us to confirm that any exposure increases are happening where we expect, and to conduct within-bank tests that rule out bank-wide policies driving our results. While we sacrifice generalizability, the above features help to address endogeneity concerns.
We first establish that the housing shock shifted the exposure of novice banks. Table 9, Panel A examines whether banks with little construction exposure in 2002 increase their exposure by 2005 differentially by region. We choose 2002 because it is our first sample year and when investment in housing began increasing above historical levels (US Bureau of Economic Analy-sis), and 2005 to allow time for novice banks to enter construction lending but not so much time that they become experts. Consistent with our prior tests, bank exposures are measured at the
27 Bartik (1991) develops a method of isolating local labor demand changes. The “Bartik Instrument” averages
na-tional employment growth across industries using local industry employment shares as weights to produce a measure of local labor demand that is orthogonal to changes in local labor supply.