HAL Id: inserm-01498619
https://www.hal.inserm.fr/inserm-01498619
Submitted on 30 Mar 2017
HAL is a multi-disciplinary open access
archive for the deposit and dissemination of sci-entific research documents, whether they are pub-lished or not. The documents may come from teaching and research institutions in France or abroad, or from public or private research centers.
L’archive ouverte pluridisciplinaire HAL, est destinée au dépôt et à la diffusion de documents scientifiques de niveau recherche, publiés ou non, émanant des établissements d’enseignement et de recherche français ou étrangers, des laboratoires publics ou privés.
Unraveling the Receptor-Ligand Interactions between
Bladder Cancer Cells and the Endothelium Using AFM.
Vinoth Sundar Rajan, Valérie Laurent, Claude Verdier, Alain Duperray
To cite this version:
Vinoth Sundar Rajan, Valérie Laurent, Claude Verdier, Alain Duperray. Unraveling the Receptor-Ligand Interactions between Bladder Cancer Cells and the Endothelium Using AFM.. Biophysi-cal Journal, BiophysiBiophysi-cal Society, 2017, 112 (6), pp.1246-1257. �10.1016/j.bpj.2017.01.033�. �inserm-01498619�
Unraveling the receptor-ligand interactions between bladder cancer cells and the endothelium using AFM
V. Sundar Rajan, V.M. Laurent, C. Verdier and A. Duperray Running title: ICAM-1 Interactions with MUC1 and CD43
KEYWORDS: Cancer metastasis, ICAM-1, MUC1, CD43, Atomic Force Microscopy, Endothelial cells.
ABSTRACT: Adhesion of cancer cells to endothelial cells is a key step in cancer metastasis, therefore identifying the key molecules involved during this process promises to help blocking the metastatic cascade. We have previously shown that InterCellular Adhesion Molecule-1 (ICAM-1) expressed by endothelial cells is involved in the interactions of bladder cancer cells (BCs) with the endothelium. However the ICAM-1 ligands have never been investigated. In this study, we combined adhesion assays and Atomic Force Microscopy (AFM) to identify the ligands involved and to quantify the forces relevant in such interactions. We report the expression of MUC1 and CD43 on BCs and demonstrate that these ligands interact with ICAM-1 to mediate cancer cell-endothelial cell adhesion in the case of the more invasive BCs. This is achieved thanks to adhesion assays, showing a strong decrease in BCs attachment to the endothelial cells, when blocking MUC1 and CD43 using antibodies. In addition, AFM measurements show a similar decrease up to 70% in the number of rupture events when blocking MUC1 and CD43. When applying a Gaussian Mixture Model to the AFM data, a distinct force range is reported for receptor-ligand bonds, allowing us to identify precisely the interactions of ICAM-1 with MUC1 or CD43. Furthermore, a detailed analysis of the rupture events suggests that CD43 is strongly connected to the cytoskeleton and that itsinteractionwith ICAM-1 mainly corresponds to force ramps followed by sudden jumps. On the contrary, MUC1 seems to be weakly connected to the cytoskeleton as its interactions with ICAM-1 are mainly associated with the formation of tethers. This analysis is quite promising and may also be applied to other types of cancer cells.
Introduction
Cancer metastasis is the primary cause for 90% of cancer-associated mortality. The malignancy of cancer strongly depends upon the ability of primary tumors to metastasize to distant organs (1,2). During metastasis, cancer cells manage to escape from primary tumors and penetrate into the blood flow (intravasation). Cancer cells that are carried in the blood flow can interact with the endothelium lining the walls of blood vessels, adhere and migrate (extravasation) through the endothelium to form secondary tumors. Cancer cells and leukocytes follow similar mechanisms during the extravasation process: 1) rolling of cells on the endothelium, 2) adhesion of cells to the endothelium, and 3) spreading and transmigration of cells through the endothelium (3–5). The adhesion and migration of leukocytes through the endothelium have been studied in details during inflammation (3,6), but few results are available regarding the role of the key molecules involved in the adhesion and transmigration of cancer cells (6–11).
The adhesion of cancer cells or leukocytes to endothelial cells (ECs) is an important step of the extravasation process and is mediated by several cell adhesion molecules (CAMs) like β1 integrins (12), Vascular Cell Adhesion Molecule-1 (VCAM-1) (13), L-selectin (14) and Intercellular Adhesion Molecule-1 (ICAM-1) (6,7,15,16). We already showed that ICAM-1 expressed by ECs is involved in the adhesion of bladder cancer cells (BCs) (6). ICAM-1 (CD54) is a cell surface glycoprotein consisting of five extracellular immunoglobulin-like domains (17). ICAM-1 is expressed on various cells including ECs, leukocytes, B-cells, T-cells, fibroblasts and some cancer cells and its expression can be upregulated by cytokines like TNF-α (6,18). Leukocytes express LFA-1 and Mac-1 (β2 integrins), which are well known ligands for ICAM-1. Cancer cells lack the expression of β2 integrins, but neutrophils can act as a bridge between cancer cells and ECs to help in the adhesion process (3). In addition, MUC1 (19) and CD43 (20) expressed by some cancer cells have been identified as ligands for ICAM-1. MUC1 (CD227) is a transmembrane glycoprotein usually expressed on the apical surface of secretory epithelia. It is over-expressed and underglycosylated in several common cancers including breast, lung, colon, ovary, bladder and hence, is used as a tumor marker (21). The extracellular domain of MUC1
these TRs have been shown to recognize and bind to domain I of ICAM-1 (23). CD43 (Leukosialin) is a transmembrane sialoglycoprotein normally expressed on the surface of T lymphocytes, monocytes, neutrophils, platelets and some B lymphocytes. CD43 is also expressed by a variety of cancer cell lines and tumor tissues. It is undetected in normal tissues and for this reason is used as a marker for tumor detection (24,25). The ligands involved in the adhesion of BCs to ECs are not yet as clearly identified but CD43 and MUC1 are good candidates that could be involved in mediating the adhesion via ICAM-1. Furthermore quantitative analysis of the forces involved in these interactions can help understand how cancer cells regulate their adhesion.
In recent years, single-cell force spectroscopy (SCFS) using Atomic Force Microscopy (AFM) (6,17,18,26–28) has been applied for studying adhesive interactions of cells with other cells, proteins, or functionalized surfaces. In particular, AFM is a powerful tool to identify and quantify receptor-ligand interactions (17,28–32). Here we used SCFS to unravel the key molecules involved in the adhesion of BCs to ECs. Therefore we combined adhesion assays and SCFS to characterize cancer cell-endothelial cell adhesion both qualitatively and quantitatively. We report the expression of MUC1 and CD43 in BCs of different invasiveness (RT112, T24 and J82). When blocking ICAM-1, CD43 or MUC1 with specific mAbs, adhesion of BCs to ECs was largely decreased for invasive cells such as T24 and J82, showing that these interactions are essential for invasive cells, while less invasive ones might interact through different receptors. Through SCFS measurements we identified different force ranges for the interactions of MUC1 and CD43 with ICAM-1. To our knowledge, this is the first report on the force range corresponding to the interaction of MUC1 or CD43 with ICAM-1, with values of 43-53 pN, which compare well with the ones previously reported for the interaction of LFA-1 with ICAM-1 (17,33). Finally a detailed analysis of rupture events showed that MUC1 interacts with ICAM-1 mainly through tethers, whereas CD43 interacts with ICAM-1 mainly through jumps, this being related to a better attachment to the cytoskeleton in the latter case. Taken altogether, these results give an additional understanding of the process of metastasis, when cancer cells bind to the endothelium through interactions between endothelial ICAM-1 and cancer cell ligands.
Materials and Methods Cell lines and cell culture
Three human BCs (RT112/G2 grade, T24/G3 grade and J82/G3 grade) (ATCC, Rockville, MD) were cultured in RPMI 1640 medium (Gibco, Saint Aubin, France) supplemented with 10% fetal bovine serum and 1% penicillin/streptomycin mix (complete RPMI medium). The grade of BCs was defined based on the morphological and pathological characteristics of the original tumor and represent progression from well to poorly differentiated phenotypes arising from superficial to invasive epithelial human bladder cancer (34,35). BCs were stably transfected with a plasmid expressing lifeact-GFP to stain F-actin and these GFP transfected cells were used for AFM experiments. Human Vascular Umbilical Endothelial Cells (HUVECs) were purchased from Promocell (Heidelberg, Germany). HUVECs (ECs) were grown on culture dishes coated with 100 µg/ml collagen I (BD Bioscience, Le Pont de Claix, France) in complete endothelial growth medium (endothelial basal medium mixed with supplements) from Promocell. HUVECs subcultures from passage 2-6 were selected for our experiments. Cultures were grown at 37°C in a 5% CO2 humidified atmosphere.
Flow cytometry
BCs grown on tissue culture flask were detached using a cell dissociation solution (Sigma-Aldrich, Lyon, France). The cell suspension was incubated with primary antibodies (10 µg/ml) in ice for 45 min. Mouse anti-human MUC1 monoclonal antibody (mAb) clone E29 (DAKO, Glostrup, Denmark), mouse anti-human CD43 mAb clone L10 (Invitrogen, Saint
Aubin, France) and mouse immunoglobulin (IgG) (Vector Laboratories, CA, USA) were used as primary antibodies in this study. The cells were then incubated with goat anti-mouse IgG Alexa-488 (Life Technologies, Saint Aubin, France) secondary antibody in ice for 30 min. Expression levels of MUC1 and CD43 were measured using Accuri C6 flow cytometer (BD Bio-sciences, USA) and analyzed using the software provided with the flow cytometer. Both antibodies (E29 and L10) recognize an extracellular domain of the MUC1 and CD43 respectively (23,24). It has been reported that these antibodies can block MUC1 and CD43 and inhibit partially the adhesion (23,36).
Bladder cancer cell-endothelial cell adhesion assay
ECs (2x10⁴) were seeded in 48 well plates (Nunc, Saint Aubin, France) coated with 100 µg/ml collagen I and grown to confluence for 3 days. BCs were labeled with calcein (Life Technologies, Saint Aubin, France) for 30 min at 37°C. 2x10⁵ labeled BCs were added per well and incubated for 30 min at 37°C. After testing different contact times, this incubation time of 30 min was found to give an optimal number of adherent cells (data not shown). Non-adherent BCs were removed by gentle washing with complete RPMI medium. The remaining adherent cells were then lysed with detergent (10% SDS) and the fluorescence signal was quantified using Victor3 multilabel counter (Perkin Elmer, Waltham, MD). For blocking experiments, ICAM-1 on ECs and MUC1 or CD43 on BCs were blocked with specific antibodies (20 µg/ml) for 15 min at 37°C prior to the addition of cancer cells. The percentage of adhesion was calculated as:
% Adhesion = 100* fluorescence of adhered cells/ Total fluorescence
Total fluorescence corresponds to the fluorescence of added cells (2x10⁵) and fluorescence of adhered cells corresponds to the fluorescence value obtained after washing of the non adherent cells (36).
Atomic force microscopy
AFM experiments were performed using a Nanowizard II AFM (JPK Instruments, Berlin, Germany) mounted on a Zeiss microscope (Carl Zeiss, Jena, Germany). This configuration allows carrying out AFM measurements and simultaneously observing the cells using phase contrast or fluorescence modes. Long range force measurements involving cell-cell interactions were performed using the CellHesion module (JPK Instruments, Berlin, Germany) which enables vertical movement of the sample holder up to 100 µm thanks to the piezo-driven movement. In addition, the objective was mounted on a vertical piezo-translator (PIFOC, Physik Instrumente, Karlsruhe, Germany) to move the objective concurrently with the microscope stage and focus on the cells during AFM measurements. All the AFM measurements were carried out at 37±0.1°C using the Petri Dish Heater (JPK Instruments, Berlin, Germany). For AFM experiments, complete endothelial growth medium was supplemented with 20 mM Hepes at pH 7.4 (Sigma-Aldrich, Lyon, France).
Preparation of cantilever and substrates
V-shaped, 300 µm long tipless gold coated silicon nitride cantilevers with a nominal spring constant around 0.01 N/m (MLCT-O, Bruker, France) were used for force measurements. The AFM cantilever was soaked in acetone for 5 min, UV-irradiated for 15 min and incubated in 0.5 mg/ml biotin-BSA (Interchim, Montluçon, France) overnight at 37°C. The cantilever was then rinsed with PBS and incubated in 0.5 mg/ml streptavidin (Interchim, Montluçon, France) for 10 min at room temperature. Finally, the cantilever was rinsed with PBS and incubated in 0.5 mg/ml biotin-ConA (Interchim, Montluçon, France) for 10 min and then rinsed with PBS as
a force greater than the ones measured for the interactions between cancer cells and HUVECs (33). The sensitivity of the cantilever was determined prior to each experiment by making contact with the glass coverslip and the spring constant was obtained using the thermal noise method following a previously described protocol (37). This was carried out on the same glass coverslip used for force measurements.
HUVECs substrate: For AFM experiments, HUVECs were grown on 35 mm diameter Petri dishes (TPP Petri dishes, Thermofisher Scientific, Villebon-sur-Yvette, France) modified as follows: a 30 mm diameter glass coverslip was glued using UV curable (Norland #61) after drilling a 26 mm hole at the bottom. The coverslip was cleaned with alcohol, dried with N2 and
then treated with fibronectin (10 µg/ml). HUVECs were seeded on these dishes and cultured for 3 days at 37°C, 5% CO2 to achieve confluence. Prior to use, they were replaced with endothelial
basal medium (without supplements) containing 20 mM Hepes pH 7.4. The substrates (HUVECs, rICAM-1 or bovine serum albumin (BSA)) were used in basal medium without supplements during the attachment of cancer cells to the cantilever, as the proteins present in the supplements can bind to ConA and prevent the attachment of the cancer cell to the cantilever. Recombinant ICAM-1 substrate: To prepare recombinant ICAM-1 (rICAM-1) immobilized substrate, 20 µl of monomeric rICAM-1 (RD Systems, Lille, France) (25 µg/ml) in 0.1 M NaHCO3 was incubated overnight at 4°C in the Petri dish. Unbound proteins were removed by
washing with PBS and then the exposed surface was blocked using 100 µg/ml of BSA in PBS (Sigma-Aldrich, Lyon, France). Finally, BSA was replaced by RPMI 1640 medium without serum and used for further steps.
BSA substrate: For the BSA immobilized substrate, 20 µl of BSA at 100 µg/ml in PBS was allowed to adsorb for 30 min at 37°C in the Petri dish. Unbound proteins were removed by washing with PBS, and RPMI medium without serum was added to the BSA coated dish. The different substrates are sketched in Fig. 1A.
Single cell force spectroscopy (SCFS)
SCFS measurements were performed by attaching a cancer cell to the cantilever, followed by an approach-retraction cycle. J82 cells were detached from the culture dish just before the AFM experiment using Trypsin/EDTA (Sigma-Aldrich, Lyon, France), as EDTA alone was not able to detach efficiently the strongly adhering J82 cells. It has been shown that cells detached by EDTA alone recover faster their mechanical and adhesive properties (38) than cells detached using trypsin alone, but the latter study also demonstrated that rupture force values (jumps and tethers) do not depend on recovery time. The detached cells were suspended in complete RPMI medium and centrifuged at 1200 rpm for 5 min at 4°C. Finally, the cells were resuspended in RPMI medium without serum. J82 cells were injected approximately 20-30 min after trypsinization into the Petri dish containing a monolayer of HUVECs and allowed to settle. The ConA functionalized cantilever tip was placed above a cancer cell (cancer cells are fluorescent and they can be distinguished from HUVECs) and then the substrate was moved to touch the cell with a force of 1 nN for ten seconds. The substrate was retracted slowly and the cantilever with the captured cell was allowed to establish firm adhesion for 10-15 min in the culture medium (Fig. 1C-inset). Next, 1.5 ml of complete endothelial growth medium was added and the force measurements were performed as shown in Fig. 1B.
After attachment of a cancer cell, the cantilever was set above the nucleus of a HUVEC (Fig. 1C) and the substrate was moved at a speed of 5 µm/s. This position above the nucleus is a convenient location when using a cantilever with a cancer cell attached to it, and it is known that ICAM-1 is expressed all over the cells. During contact, a compression force of 500 pN was applied for 10 s in constant force mode and the substrate was then retracted with a speed of
5 µm/s. The influence of different compression forces (500 pN, 1 nN and 2 nN) has been studied while keeping all the other parameters constant. The results (data not shown) indicated that the mean rupture force (i.e. the mean value of 10 events per force curve) did not change (while the number of rupture events increased) with compression force, as previously reported (33,39). A contact time of 10 s was selected in order to obtain sufficient rupture events (at least 10 with the control experiment). The force measurements were performed in open loop mode with an acquisition frequency of 2048 Hz and a pulling distance of 70 µm. The open loop mode works better in our conditions as we do not need extremely high accuracy on the height. The drift over time was found to be 0.01 pN/µm, which is considered small enough not to have any effects on the measurements. A force-distance curve (F-d) was obtained for each approach and retraction cycle (Fig. 1B). Typically, with a single cancer cell attached to the cantilever about 30 (F-d) curves were acquired on 30 different HUVECs. The cancer cell was allowed to recover for 1 min between each force curve and 5 min between sets of 6 force curves. We used a recovery time greater than the contact time which is commonly used by many authors (26,29). To block specific interactions involving cancer cells and HUVECs, cancer cells were incubated with antibodies specific for MUC1 or CD43 or MUC1+CD43 at 25 µg/ml for 15 min, prior to cell capture.
Figure 1. Interactions between cancer cells and ECs using SCFS. (A) Sketch of different substrates (rICAM-1,
BSA, HUVEC) used for SCFS experiments. (B,D) Sketch of the approach-retraction method and typical retraction force curve in terms of the piezo displacement. The HUVEC monolayer approaches the cancer cell at constant velocity (5 µm/s). Then the HUVECs come into contact with the cancer cell during 10 s (under 500 pN applied force) to create several bond complexes within the adhesion area. The HUVEC substrate is then retracted at constant velocity in order to detach the adhesive bonds. The retraction curve shows force jumps and tethers corresponding to bond rupture forces. The adhesive energy (shaded area) represents the detachment work to completely unbind the cell from the substrate. The detachment force is the force necessary to stretch the cancer cell and the HUVEC until bonds start to detach. Note that some force jumps can follow a plateau corresponding to tether formation (see discussion later). (C) Picture of an AFM cantilever with an attached cancer cell above the HUVEC monolayer. Inset: fluorescent image of a fluorescent cancer cell attached to the cantilever. Scale bar = 20 µm.
The retraction curve is characterized by the force required to separate the cancer cell from the HUVEC, referred to as the detachment force (Fig. 1D). The detachment force is related to the elasticity of cells and the adhesion between them. The force jumps (or rupture events) in the force curve correspond to the breakup of bonds involved during cell-cell interaction (Fig. 1D). A typical force jump usually occurs at a constant loading rate (pN/s) ending with bond rupture. Sometimes, the force jump follows a force plateau (loading rate close to 0), indicating the formation of membrane tethers. The retraction curve also provides information about the adhesion energy which is the work required to detach the cancer cell. It is equal to the area under the retraction curve. This includes the work necessary to stretch the cells as well as the work to break the molecular bonds (Fig. 1D). All these parameters (detachment force, rupture force, adhesion energy) are obtained from the force curve using the built-in software (JPK Instruments, Berlin, Germany) and the rupture events are identified using the protocol described in Kressmakers et al. (40).
Latrunculin-A treatment
rICAM-1 substrates were prepared and J82 cells were attached to a functionalized cantilever as described before. Then, 1.5 ml of complete RPMI medium with Latrunculin-A (Lat-A, Sigma-Aldrich, USA) was added into the Petri dish to reach a final concentration of 0.2 µM. The cantilever with an attached J82 cell was rested for 15 min allowing Lat-A to disturb the actin cytoskeleton. For these experiments, the parameters used for AFM have been modified, with a compression force of 2 nN instead of 500 pN, in order to obtain enough rupture events. Both Lat-A experiments and control experiments were performed using these parameters. Constant height and closed loop modes were used, in order to compensate for cell deformation when applying Lat-A.
Data Analysis
Considering that our data are comprised of rupture forces coming from different receptor-ligand interactions, a multi-component mixture model is necessary to separate the contributions of the different receptors. In order to identify and separate the different sub-populations from the overall histograms, we used a Gaussian Mixture Model (GMM) analysis. In our study we used tri-modal GMM for HUVECs/J82-control and bi-modal GMM for data obtained while blocking MUC1 or CD43 to analyze the contributions of the different receptors. We used the built-in function “fitgmdist” from Matlab to identify the sub-populations from our data. This function uses maximum likelihood estimations to find the parameters fitting best our experimental data and provides us with the overall probability density function and subcomponents of each distribution.
All the data for adhesion assays were generated by at least three independent experiments performed in triplicates. The data are reported as mean with standard error of the mean (SEM) as error bar. The significance of the data was calculated with one-way ANOVA using GraphPad Prism (GraphPad Software Inc, San Diego, CA, USA). For each set of conditions, at least three
independent AFM experiments were performed on three different days (Overall, three cancer cells and 80-90 HUVECs). The data are reported as mean ± SEM. Statistical analysis for AFM data were performed using Generalized Linear Mixed Model (GLMM) in the R software (2.14 release). With one cancer cell attached to the cantilever around 30 (F-d) curves were performed on 30 different ECs. The data obtained from F-d curves were independent in terms of ECs and dependent in terms of cancer cells. The AFM experiments performed were neither completely independent nor dependent, so to account for the heterogeneous data in every AFM experiments, we used a GLMM. Differences between the parameters calculated on untreated, blocking MUC1 or CD43 or both were tested by the mixed function of the “apex” package in the R software. Results
Expression of MUC1 and CD43 by bladder cancer cells
BCs (RT112, T24 and J82) were analyzed for the expression of MUC1 and CD43 by flow cytometry using MUC1 mAb E29 and CD43 mAb L10. The scatter plot obtained for MUC1 expression on J82 BCs as compared to the control is shown on Fig. S1 in the Supporting Material. Control IgG was used to detect the background level (Fig. 2: Black curves) in the measurements. As shown in Fig. 2, MUC1 and CD43 (red curves) were expressed by these cell lines at different levels. A weak expression of MUC1 and CD43 was observed on RT112 (Fig. 2A,B) and T24 (Fig. 2C,D), while J82 showed a good expression of MUC1 and CD43 (Fig. 2E,F) as compared to the other cell lines.
Figure 2. Flow cytometry analyses of MUC1 and CD43 expression in bladder cancer cells. Expression levels of
MUC1 and CD43 (red curve) by flow cytometry analysis in comparison with an irrelevant antibody (black curve): RT112 cells (A,B), T24 cells (C,D), J82 cells (E,F).
MUC1 and CD43 mediate bladder cancer cell-endothelial cell adhesion
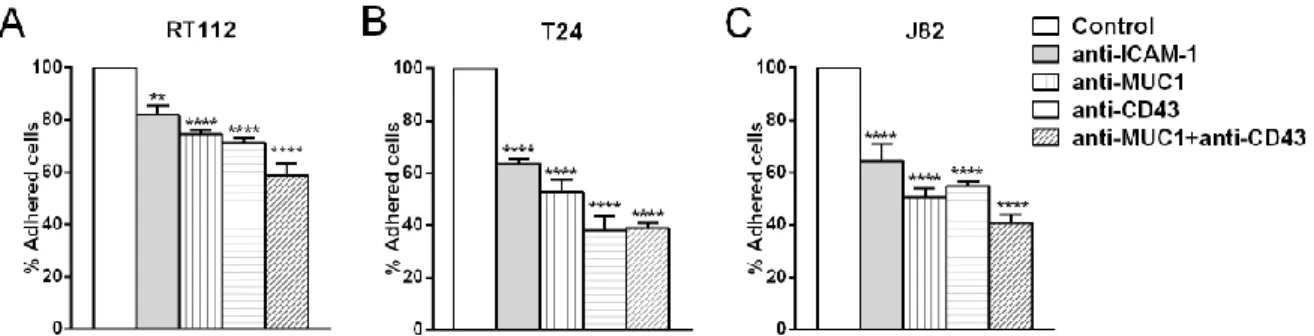
As demonstrated above, BCs express MUC1 and CD43, which are ligands for ICAM-1 (19,20). To verify if this expression mediates the adhesion of BCs to ECs via interaction with ICAM-1, adhesion assays were performed. Monoclonal antibodies were used to inhibit ICAM-1 expressed on ECs and MUC1 or CD43 expressed on BCs (RT112, T24 and J82) prior to the adhesion assay. The percentage of adhesion after blocking ICAM-1 on ECs and MUC1 or CD43 or MUC1+CD43 on BCs was calculated and compared to the adhesion obtained using a control antibody (mouse IgG). The percentage of cells adhered in control versus the total number of cells added were 75%, 55%, 66% respectively for RT112, T24 and J82. We normalized the control to 100% and calculated the inhibition when blocking receptors on different cell lines. Blocking ICAM-1 on ECs showed ~36% decrease in adhesion for T24, J82 (Fig. 3B,C) and ~18% decrease in adhesion for RT112 (Fig. 3A). Likewise, blocking MUC1 or CD43 on T24 and J82 showed ~50% decrease in adhesion (Fig. 3B,C) and RT112 showed ~25% decrease in adhesion (Fig. 3A). Blocking both (MUC1+CD43) induced an additional decrease in adhesion compared to blocking them separately in all three BCs (Fig. 3A-C). The decrease in adhesion when blocking ICAM-1 or MUC1 or CD43 was 50% less in RT112 as compared to T24 and J82. These results indicate that bladder cancer cell-endothelial cell adhesion is mainly mediated by the interactions of MUC1 and CD43 with endothelial ICAM-1 for invasive cells (T24 and J82). In contrast, RT112 adhesion on ECs is less dependent on ICAM-1.
Figure 3. Quantification of bladder cancer cell-endothelial cell adhesion. In adhesion assays, the percentage
(mean±SEM) of three bladder cancer cells RT112 (A), T24 (B) and J82 (C) adhering to ECs was quantified while blocking ICAM-1 on ECs and blocking MUC1, CD43 and MUC1+CD43 on cancer cells. One way ANOVAtest was performed to check the significance with respect to the control, ****p≤0.0001, ** p≤0.01.
Effect of blocking MUC1 and CD43 measured by SCFS
To measure the adhesion forces involved in bladder cancer cell-endothelial cell adhesion, we performed SCFS. J82 cells were used for our AFM experiments, because they express a higher level of MUC1 and CD43 as compared to two other cell lines (see Fig. 2). Initially, the interactions that are not mediated through ICAM-1 (nonspecific interactions, or mediated by other receptor-ligand interactions, thereafter called nonspecific interactions) were quantified using BSA. A single J82 cell was attached to the functionalized tipless cantilever and put in contact with BSA on the substrate and then was retracted. Force curves were analyzed to identify and measure the forces corresponding to the rupture events. The rupture forces obtained from the force curves are represented on a histogram with a bin size of 2 pN. The best bin size to fit our data was selected using the Freedom-Diaconis rule (41,42) using the R software. The rupture force histogram (Fig. 4D) revealed that the nonspecific interactions were mediated by a range of rupture forces <30 pN. Then, AFM experiments were performed using a HUVEC monolayer as the substrate and a J82 cell attached to the cantilever. Force curves were analyzed and the rupture
force histogram for non-treated cells (control) was obtained. Similarly AFM measurements were performed by attaching a J82 cell blocked with antibodies specific for MUC1 or CD43 or MUC1+CD43 and the rupture force histograms for anti-MUC1, anti-CD43 and anti-MUC1+anti-CD43 were obtained.
Figure 4. SCFS analysis of bladder cancer cell-endothelial cell adhesion. Force histograms showing the
distribution of rupture events for the adhesion of HUVEC monolayer with J82 bladder cancer cells for different conditions were obtained from force curves (applied force 500 pN, time of contact 10 s, velocity 5 µm/s). Histograms obtained while blocking MUC1 (A), CD43 (B) and MUC1+CD43 (C) on J82 cells (white histogram) were compared with the control without antibody (grey histogram). (D) Rupture force histogram for nonspecific interactions was obtained by using BSA-coated substrate.
The effect of blocking the receptors (MUC1, CD43 or both) involved in the interaction was quantified by comparing their force distribution to control. While blocking MUC1, the force histogram showed a significant decrease in the number of larger rupture force events as compared to the control (Fig. 4A). This decrease in rupture events was quantified by considering the rupture events above (>36 pN) since the events <36 pN were found unresponsive when blocking MUC1 or CD43 (Table S1). The number of force curves performed under each condition is represented by N and n represents the number of rupture events (>36 pN) obtained from the force curves (Table 1). Analysis of the total number of rupture events showed that J82 control (4.8 events per curve) had almost 2.7 times more events than after blocking MUC1 (1.8 events per curve). The inhibition in adhesion due to the blocking of MUC1 was quantified as ~64% (Table 1). Likewise, blocking CD43 (2.8 events per curve) showed 1.7 times less events as compared to control (Fig. 4B) with ~42% normalized inhibition (Table 1). Blocking
MUC1+CD43 (1.3 events per curve) showed 3.6 times less events as compared to the control (Fig. 4C) with an inhibition increased to ~72% (Table 1).
Substrate J82 cell condition % Inhibition compared to control
N n Mean number of rupture events per
curve (M=n/N) HUVECs Control 88 426 4.8±0.9 anti-MUC1 63.9 91 159 1.8±0.7 anti-CD43 42.2 89 249 2.8±1.0 anti-MUC1+anti-CD43 72.2 90 121 1.3±0.3 rICAM-1 Control 79 217 2.8±0.9 anti-MUC1 49.1 70 98 1.4±0.1 anti-CD43 44. 4 86 132 1.5±0.3 anti-MUC1+anti-CD43 68.4 85 74 0.9±0.1
Table 1. Analysis of rupture force distribution. The % inhibition in number of rupture events while blocking
different receptors involved in the interaction was quantified by comparing to control for both HUVECs and rICAM-1 as the substrate. N represents the number of force curves, n is the total number of rupture events >36pN for HUVECs as substrate or >30 pN when using rICAM-1 as substrate, and M represents the mean rupture events per curve. % inhibition by blocking the specific receptor was quantified using the formula [1-(MAb/Mcont)]*100. MAb
represents the mean number of rupture events obtained while blocking MUC1, CD43 and MUC1+CD43 using specific antibodies and Mcont represents the mean number of rupture events for control.
ICAM-1 mediates the interaction of J82 cell with HUVECs
To study the interactions of ICAM-1 alone with BCs ligands (MUC1 and CD43), we used rICAM-1 protein coated substrate instead of a HUVEC monolayer. SCFS experiments were performed with a J82 cell attached to the cantilever and rICAM-1 adsorbed on the substrate. Force histograms obtained while blocking MUC1 or CD43 or MUC1+CD43 were compared to the control (Fig. S2) and the inhibition was quantified (Table 1), by considering the rupture events >30 pN, since the events <30 pN were found unresponsive when blocking MUC1 and CD43 (Table S1). Blocking MUC1 (1.4 events per curve), CD43 (1.5 events per curve) as compared to the control (2.8 events per curve) showed an inhibition of ~49% and ~44% respectively (Table 1). Blocking both MUC1 and CD43 (0.9 events per curve) showed an increase in the normalized inhibition up to ~68% (Table 1). The inhibition obtained by blocking MUC1 or CD43 or MUC1+CD43 were found similar to the one obtained using rICAM-1 and HUVEC monolayer as the substrate. These results suggest that under these conditions the interaction of J82 cancer cells to ECs is mainly mediated by ICAM-1 expressed on ECs, in agreement with the results obtained from adhesion assays and our previous work (6).
Force range involved by MUC1 and CD43 during their interaction with ICAM-1
Given the strong inhibition obtained by blocking both MUC1 and CD43, we can consider that the rupture forces obtained are mainly due to the interaction between ICAM-1 (on ECs) and MUC1 and CD43 (on BCs), hence we are expecting 3 main peaks corresponding to 1) nonspecific interaction and other receptor-ligand interactions, 2) interaction of ICAM-1 with CD43 and 3) interaction of ICAM-1 with MUC1. To investigate the force ranges corresponding to MUC1 and CD43 during their interaction with ICAM-1, our data was analyzed using a GMM function. A common approach is based on qualitative assessment and fitting the force histogram by changing the number of Gaussians to observe which model fits best our data (43,44). Fig. S3 showed that the fit obtained using three Gaussians (adjusted R-square 0.981) represents our data better than two Gaussians (adjusted R-square 0.974) on the HUVECs/J82 interaction force histogram. These findings from qualitative analysis also go along with our initial assumptions that the force histogram obtained in the control is likely to have three sub-populations. First,
tri-modal GMM function was used in our control (HUVECs/J82 cell) to identify three Gaussian peaks. The GMM analysis showed the overall probability distribution (red) and three distinctive peaks (Fig. 5A) with mean rupture forces of ~31 pN, ~41 pN and ~50 pN (Table 2). Specific force ranges corresponding to MUC1 and CD43 interactions were obtained by analyzing the force histogram obtained while blocking MUC1 or CD43. When blocking MUC1, we considered that most of the specific interactions involving MUC1 were suppressed, so the data were analyzed with bi-modal GMM to identify 2 Gaussian peaks (Fig. 5B). The results showed a first peak (green) with a mean rupture force of ~29 pN corresponding to nonspecific interaction and a second peak (black) with a mean rupture force of ~43 pN corresponding to the interaction of ICAM-1 with CD43 (Table 2). Similarly, considering that most of the specific interactions involving CD43 were suppressed while blocking CD43, the data was analyzed to identify 2 Gaussian peaks (Fig. 5C). This result also showed a first peak (green) due to nonspecific interaction at ~31 pN and a second peak (blue) with a mean rupture force of ~53 pN corresponding to the interaction of ICAM-1 with MUC1 (Table 2). This GMM analysis demonstrates that ICAM-1 interacts with MUC1 and CD43 with distinct force ranges.
Figure 5. MUC1 and CD43 expressed on BCs interact with ECs with different force range. GMM function
analysis on control (A) showing three different sub-populations: nonspecific interactions (green) and interaction of MUC1 (blue) and CD43 (black). After blocking MUC1 (B), showing two sub-populations: nonspecific interactions (green) and interaction of CD43 (black). After blocking CD43 (C), showing two sub-populations, nonspecific interaction (green) and interaction of MUC1 (blue).
Substrate J82 cell condition Peak 1 (green) mean±SEM Peak 2 (black) mean±SEM Peak 3 (blue) mean±SEM HUVECs Control 31.0±0.25 40.9±0.34 50.4±0.84 anti-MUC1 29.3±0.21 42.9±1.42 anti-CD43 31.1±0.25 53.3±1.6
Table 2. Force range obtained from the GMM analysis of SCFS data for the interaction of BCs with ECs.
GMM analysis revealed that the interaction of CD43 is mediated by a mean rupture force of ~43 pN and the interaction of MUC1 is mediated by a mean rupture force of ~53 pN. Colors indicated for peak 1, 2 and 3 refer to colors used in Fig 5.
Attachment to the cytoskeleton is different for MUC1 or CD43
Jumps and tethers observed in the force curves can provide information on whether the receptor is connected to the cytoskeleton or not. Therefore, the number of jumps and tethers within the force curve was determined under the different conditions. The rupture events followed by the force plateau with a distance higher than 2 µm were considered as tethers in our analysis (45,46). To obtain comparable numbers for different conditions, the number of jumps or tethers per curve was obtained by dividing the total number of jumps or tethers (>36 pN) by the number of curves for each condition.
The data obtained from HUVEC/J82 are shown in Fig. 6. The analysis of the number of tethers for different conditions revealed some interesting information (Fig. 6A). When blocking MUC1 and MUC1+CD43, we observed a significant decrease (~64% and ~76%) in the number of tethers. This result suggests that most of the MUC1 mediated interactions might be through tethers. Furthermore, blocking CD43 did not change the number of tethers as compared to the control (Fig. 6A) in agreement with our early inference. These results strongly suggest that MUC1 on cancer cell is weakly connected to the cytoskeleton. Pie charts represent the relative presence of jumps and tethers for the different conditions (Fig. 6B). The same proportion of jumps were observed when blocking MUC1 (~83%) as compared to the control (~83%) (Fig. 6B). Conversely, when blocking CD43, the amount of jumps decreased (~70%) indicating that the interaction of CD43 with ICAM-1 may correspond to jumps and that CD43 is closely connected to the cytoskeleton.
Figure 6. MUC1 and CD43 interact with ICAM-1 through tethers and jumps: (A) Histogram showing the
(mean±SEM) number and type of ruptures (jumps and tethers >36 pN) while blocking the receptors involved in the interaction using HUVECs as the substrate. Generalized Linear Mixed Model (GLMM-R software) was performed to check the significance with respect to control, ***p<0.001, *p<0.05 and n.s p>0.05. (B) Pie charts showing the amount of jumps and tethers for each condition. Percentage of jumps is indicated.
Effect of Lat-A treatment on jumps and tethers
Tethers were separated considering a force plateau >2 µm (as described above) and the mean number of jumps and tethers for control and after Lat-A treatment were obtained by analyzing the rupture events >30 pN (Fig. 7). Fig. 7A shows a ~63% increase of tethers after Lat-A treatment as compared to the control. The effect on jumps was smaller, with a ~ 34% decrease after Lat-A treatment. This demonstrates that disruption of the actin cytoskeleton by Lat-A effectively increases the occurrence of tethers while decreasing, although to a lesser extent, the number of jumps. The pie chart on Fig. 7B also clearly shows the increased proportion of tethers after Lat-A treatment.
Figure 7. Effect of Lat-A on the number of tethers. (A) Histogram showing the number (mean±SEM) and types
of ruptures (jumps and tethers >30pN) for control or after Lat-A treatment. GLMM was performed to check the significance with respect to control. ** p≤0.01. (B) Pie charts showing the amount of jumps and tethers for both conditions. Percentage of jumps is indicated
A GMM analysis was performed on the data obtained after separating the jumps and tethers and considering the rupture events >30 pN (thereby removing peak 1 corresponding to the nonspecific interactions). The data from control and Lat-A treatment were then fitted with two Gaussians (corresponding to peak 2 and peak 3 in Fig. 5) and the relative area obtained for the two peaks is shown in Table 3. As demonstrated above, peak 2 and peak 3 should mostly correspond to the interaction of CD43 with ICAM-1 and MUC1 with ICAM-1 respectively. Looking at the area of the peaks obtained when considering jumps alone, we observed a decrease in the area of peak 2 and in the ratio after treatment with Lat-A as compared to the control (Table 3). This result indicates that the link between CD43 molecules and the actin cytoskeleton was disturbed after Lat-A treatment, leading to a decrease in the number of jumps. By contrast, when analyzing the area of tethers, we did not observe any change in the area of peak 2 and in the ratio after Lat-A treatment as compared to the control (Table 3) confirming the fact that the events that we are considering as tethers are not connected to the cytoskeleton.
Substrate J82 cell condition Jumps Tethers Peak 2 (Area) Peak 3 (Area) Ratio Peak 2/Peak 3 Peak 2 (Area) Peak 3 (Area) Ratio Peak 2/Peak 3 rICAM-1 control 0.61 0.39 1.6 0.41 0.59 0.7 Lat-A 0.48 0.52 0.9 0.42 0.58 0.7
Table 3: Area obtained from the GMM analysis of SCFS data. GMM analysis showed that the number of jumps
related to the interaction of CD43 with ICAM-1 decreased after Lat-A treatment as compared to the control.
Discussion
The mechanisms and the key molecules involved in the adhesion of leukocytes to the endothelium have been investigated in great details (18,33,47,48) but only a few works are available regarding the adhesion forces and proteins involved in cancer cell-endothelial cell adhesion (11,45,49). Previously, we identified ICAM-1 as a key molecule for bladder cancer cell adhesion to the endothelium (16) and investigated the role of ICAM-1 in bladder cancer cell adhesion using SCFS (6). These results led us hypothesize that MUC1 and CD43 are possible ligands expressed by BCs to mediate their adhesion with endothelial ICAM-1. In this work, the
influence of MUC1 and CD43 in bladder cancer cell-endothelial cell adhesion was characterized in detail using adhesion assays and SCFS.
As a model of endothelial cells, we used HUVECs (derived from the veins of human umbilical cords), even though it is known that metastasis mainly occurs in the microcirculation. We think that this should not be a problem, as we are interested in the adhesion of cells mediated through ICAM-1, which is expressed similarly on all cell types. Three bladder cell lines of different invasivity were used in this study, expressing MUC1 and CD43 at various levels. RT112 and T24 have a weak expression of MUC1. In the present work, we were able to detect a weak expression of MUC1 on RT112 and T24. This is in contrast with our previous results (6), where no detectable expression was found for these two proteins on both cell lines. This might be due to the fact that in the study presented here, instead of C595, we used E29 mAb, which has been shown to bind to several locations in the multiple repeats domain of MUC1 (50), thus increasing its sensitivity. This hypothesis is supported by the higher MUC1 expression obtained for J82 in the present study as compared to the previously reported expression (6). The expression of MUC1 is controversial in the literature, with a weak expression observed in T24 at the mRNA level (51) while another study reported no detectable level of MUC1 mRNA in T24 (52). By cons, J82 cells showed a good expression of MUC1, as observed in previous work (51). MUC1 expression was also reported in other BCs like KU7, UMUC2, SCaBER, TCCSUP and HT-1367 (51,52). The expression of CD43 has not been studied extensively, but some works showed a de novo expression of CD43 in cancer tissues, particularly bladder ones (53,54).
It has been already shown that MUC1 mediates the adhesion of breast cancer cells to ECs and increases transendothelial migration (55), and that CD43 plays a role in tumor-mesothelial cell adhesion via its interaction with ICAM-1 (36). Our results show that the adhesion of BCs (T24 and J82) on ECs was greatly reduced when blocking ICAM-1, MUC1 or CD43, whereas the adhesion of RT112 to ECs was not much affected by blocking these receptors. The present results indicate that bladder cancer cell-endothelial cell adhesion is mainly mediated through ICAM-1 for invasive cells (T24 and J82) as previously reported using AFM (6). The inhibition using antibodies against MUC1 and CD43 was not complete (i.e. additive), and this can be explained by the fact that 1) these antibodies are not able to completely inhibit the interactions (as already reported (23,36) and 2) other interactions not involving CD43 or ICAM-1-MUC1 interactions might be at play. For example, E-selectin can interact with both ICAM-1-MUC1 and CD43 (22,56), and integrins have been also shown to play a role in this process (12). This indicates that the interactions not inhibited by these antibodies can be either background or interactions not involving MUC1 or CD43.
SCFS has been very useful for quantifying the adhesive forces involved between cell-cell and cell-surface interactions (29,57). The adhesion forces involved in the interactions of leukocyte ligand (LFA-1) with ICAM-1 were studied in detail using this method (17,58,59). Recent work from our team showed that ICAM-1 expressed on ECs is a key molecule in mediating the adhesion to BCs (6). In this work, we applied SCFS to unravel the differences in force range originating from the interactions of ICAM-1 with either MUC1 or CD43.
SCFS experiments performed by blocking MUC1 or CD43 on BCs showed a significant decrease in the number of rupture events (Table 1) in agreement with our adhesion assays. When the HUVECs monolayer was replaced with rICAM-1 to specifically study the interactions mediated by ICAM-1 with its cancer cell ligands, the decrease in rupture events after inhibition with the antibodies was found similar to the ones obtained with endothelial cells, clearly indicating that the interactions of J82 cell with ECs were mainly mediated by ICAM-1. By contrast, the mean adhesion energy and mean detachment force showed no significant difference when blocking MUC1 or CD43 or both as compared to the control (Fig. S4). This might be due to the fact that these two parameters also depend on cell rheology in a complex manner.
By applying a GMM analysis on data from experiments using blocking antibodies against MUC1 or CD43, we were able to discriminate three different force ranges, when BCs interact with ECs. The nonspecific interactions or the interactions not involving ICAM-1 with MUC1 or CD43 can be assigned to a mean rupture force ~30 pN, a value in agreement with the data obtained using BSA coated substrate (which we found to be the best control), the interactions of CD43 and MUC1 with ICAM-1 were found to have a mean rupture force of ~43 pN and ~53 pN respectively. In our previous work (6), the histogram of rupture forces resulting from the interaction of HUVECs and J82 revealed a double Gaussian distribution with mean values of ~42 pN and ~70 pN. When blocking ICAM-1 on ECs, only one major peak centered at ~29 pN remained, a value in close agreement with the 30 pN peak found for “non specific interactions” in the present study (i.e. BSA). On the basis of these results, we propose that CD43 and MUC1 are the two main ligands that interact with ICAM-1 when BCs interact with ECs. The slight difference in peak values can be explained by the use of a higher sampling rate (204.8 Hz in our previous study versus 2048 Hz in this work), leading to an increase in resolution and a better discrimination of very close rupture events like double bonds (60,61). In addition, the size of the data analyzed in the present work is a lot larger. The parameters that might affect the mean rupture force such as local loading rate and cooperativity were also investigated. We found that there was no effect of the local loading rate (measured on the (F-d) curve before rupture) on the mean rupture forces (Fig. S5), and that the cooperativity effects can be neglected, due to the short contact time used in our experiments, as already suggested in previous work (29).
The force curves obtained by SCFS also revealed two different types of rupture events; the first type, called jump, is characterized by a linear increase of force before rupture (Fig. 1D), while for the second type, or tether, no force increase appears before the rupture event (i.e. it is a force plateau) (Fig. 1D). The cytoplasmic domain of MUC1 and CD43 were reported to interact with the actin cytoskeleton through ERM (erzin, radixin and moesin) protein linkers (62,63). In accordance with previous studies that consided only the jumps in the force curves to represent the unbinding of adhesive units (29,61), we analyzed the relative frequency of these events in our different experiments. The rupture forces obtained by considering jumps only showed a force distribution similar to the one obtained considering both jumps and tethers (Fig. S6). This is the same when blocking different receptors MUC1 or CD43 or MUC1+CD43 (data not shown). The GMM analysis of the data obtained from jumps also showed a similar force range for nonspecific interactions and interactions of MUC1 and CD43 with ICAM-1 (Table S2). It has been shown that interactions giving rise to force increase followed by jumps correspond to receptors anchored to the cytoskeleton, whereas force plateaus or tethers followed by rupture originate from receptors not or weakly attached to the actin cell cortex (28,61). This means that the relative presence of jumps and tethers in the rupture events can provide information regarding how tightly receptors are connected with the cytoskeleton (46,64–66). In our case, a detailed analysis on the number of jumps and tethers showed that MUC1 on J82 bladder cancer cell seems to be weakly connected to the cytoskeleton and that its interactions are mainly mediated through tethers. On the other hand, CD43 could be more closely linked to the cytoskeleton and associated with the early jumps obtained on the force curve.
The association of these ligands with the cytoskeleton was further studied after disruption of the actin cytoskeleton using Lat-A treatment on cancer cells (66,67). Analysis of the number of jumps and tethers showed a decrease in the number of jumps and an increase in the number of tethers after Lat-A treatment, as compared to the control (Fig. 7). These results indicate that the disruption of actin cytoskeleton transforms some jumps (bonds connected to the cytoskeleton) to tethers, but probably not all. A GMM analysis was performed to study the influence of Lat-A on the links between the cytoskeleton and the molecules involved (CD43 and MUC1). Our results show that Lat-A treatment decreased the area and ratio of jumps for peak 2 showing that some of
the CD43 molecules which were connected to cytoskeleton (and giving rise to jumps) were disrupted after the treatment.
Conclusions
To conclude, we showed that MUC1 and CD43 are two adhesive proteins expressed on BCs at different levels. Through adhesion assays and SCFS, we demonstrated that MUC1 and CD43 interact with endothelial ICAM-1 to mediate the adhesion of BCs to ECs. Combining SCFS measurements and GMM analysis, we showed that MUC1 interaction involves larger force levels than CD43, and that most of the MUC1 interactions are mediated through tethers. By analyzing the ratio of tethers and jumps that can be attributed to ICAM-1 interactions either with MUC1 or CD43, we concluded that most of the MUC1 molecules present on J82 bladder cancer cells were weakly connected to the cytoskeleton. The interactions with the cytoskeleton appear to be stronger for CD43, leading to jumps in the force curves. Experiments using the actin depolymerizing drug Lat-A confirmed this ligand differential association with the cytoskeleton.
Given the fact that the expressions of MUC1 and CD43 are also reported in many other cancer cells, we believe that our results will help understand the mechanisms occurring during early adhesion of cancer cells to the endothelium. It will be interesting to further study the involvement of these interactions in other processes, particularly tumor cell transmigration.
ACKNOWLEDGMENTS
We thank Alexei Grichine for help with the GMM analysis, Yara Abidine for help with AFM and the different team members for fruitful discussions.
We thank the ANR for grant No. 12-BS09-020-01 (TRANSMIG), and the Nanoscience foundation for support of the AFM platform. The DYFCOM team at LIPhy is a member of the LabeX Tec21 (Investissements d’Avenir - grant agreement No. ANR-11-LABX-0030).
AUTHOR CONTRIBUTIONS
VSR performed all experiments and performed AFM analysis. Statistical analysis on R was performed by AD. All the authors designed the experiments. VSR, AD and CV wrote the paper.
References
1. Reymond, N., B.B. D’Água, and A.J. Ridley. 2013. Crossing the endothelial barrier during metastasis. Nat. Rev. Cancer. 13: 858–870.
2. Jeon, J.S., I.K. Zervantonakis, S. Chung, R.D. Kamm, and J.L. Charest. 2013. In vitro model of tumor cell extravasation. PLoS One. 8: e56910.
3. Strell, C., and F. Entschladen. 2008. Extravasation of leukocytes in comparison to tumor cells. Cell Commun. Signal. 6: 10-22.
4. Bersini, S., J.S. Jeon, M. Moretti, and R.D. Kamm. 2014. In vitro models of the metastatic cascade: from local invasion to extravasation. Drug Discov. Today. 19: 735–742.
5. Mierke, C.T. 2013. Physical break-down of the classical view on cancer cell invasion and metastasis. Eur. J. Cell Biol. 92: 89–104.
6. Laurent, V.M., A. Duperray, V. Sundar Rajan, and C. Verdier. 2014. Atomic force microscopy reveals a role for endothelial cell ICAM-1 expression in bladder cancer cell adherence. PLoS One. 9: e98034.
7. Chotard-Ghodsnia, R., O. Haddad, A. Leyrat, A. Drochon, C. Verdier, and A. Duperray. 2007. Morphological analysis of tumor cell/endothelial cell interactions under shear flow. J. Biomech. 40: 335–344.
8. Miles, F.L., F.L. Pruitt, K.L. van Golen, and C.R. Cooper. 2008. Stepping out of the flow: capillary extravasation in cancer metastasis. Clin. Exp. Metastasis. 25: 305–324.
9. Shenoy, A.K., and J. Lu. 2014. Cancer cells remodel themselves and vasculature to overcome the endothelial barrier. Cancer Lett. 380: 534-544.
10. Mierke, C.T. 2008. Role of the endothelium during tumor cell metastasis: is the endothelium a barrier or a promoter for cell invasion and metastasis? J. Biophys. Article ID 18356 : 1-13.
11. Cao, Y., L.H. Hoeppner, S. Bach, E. Guangi, Y. Guo, E. Wang, J. Wu, M.J. Cowley, D.K. Chang, N. Waddell, S.M. Grimmond, A. V Biankin, R.J. Daly, X. Zhang, and D. Mukhopadhyay. 2013. Neuropilin-2 promotes extravasation and metastasis by interacting with endothelial α5 integrin. Cancer Res. 73: 4579–4590.
12. Heyder, C., E. Gloria-Maercker, W. Hatzmann, B. Niggemann, K.S. Zänker, and T. Dittmar. 2005. Role of the β1-integrin subunit in the adhesion, extravasation and migration of T24 human bladder carcinoma cells. Clin. Exp. Metastasis. 22: 99–106. 13. Klemke, M., T.Weschenfelder, M.H. Konstandin, and Y. Samstag. 2007. High affinity
interaction of integrin alpha4beta1 (VLA-4) and vascular cell adhesion molecule 1 (VCAM-1) enhances migration of human melanoma cells across activated endothelial cell layers. J. Cell. Physiol. 212: 368–374.
14. Yamada, M., K. Yanaba, M. Hasegawa, Y. Matsushita, M. Horikawa, K. Komura, T. Matsushita, A. Kawasuji, T. Fujita, K. Takehara, D.A. Steeber, T.F. Tedder, and S. Sato. 2005. Regulation of local and metastatic host-mediated anti-tumour mechanisms by L-selectin and intercellular adhesion molecule-1. Clin. Exp. Immunol. 143: 216–227.
15. Roche, Y., D. Pasquier, J.J. Rambeaud, D. Seigneurin, and A. Duperray. 2003. Fibrinogen mediates bladder cancer cell migration in an ICAM-1-dependent pathway. Cell. Proteolysis Oncol. 89: 1089–1097.
16. Haddad, O., R. Chotard-Ghodsnia, C. Verdier, and A. Duperray. 2010. Tumor cell/endothelial cell tight contact upregulates endothelial adhesion molecule expression mediated by NFκB: Differential role of the shear stress. Exp. Cell Res. 316: 615–626. 17. Zhang, X., E. Wojcikiewicz, and V.T. Moy. 2002. Force Spectroscopy of the Leukocyte
Function-Associated Antigen-1/Intercellular Adhesion Molecule-1 Interaction. Biophys. J. 83: 2270–2279.
18. Zhang, X., A. Chen, D.D. Leon, H. Li, E. Noiri, V.T. Moy, and M.S. Goligorsky. 2004. Atomic force microscopy measurement of leukocyte-endothelial interaction. Am. J. Physiol. Heart Circ. Physiol. 286: 359–367.
19. Regimbald, L.H., L.M. Pilarski, B.M. Longenecker, M.A. Reddish, G. Zimmermann, and J.C. Hugh. 1996. The Breast Mucin MUC1 as a Novel Adhesion Ligand for Endothelial Intercellular Adhesion Molecule 1 in Breast Cancer. Cancer Res. 56: 4244–4249.
20. Rosenstein, Y., J.K. Park, W.C. Hahn, F.S. Rosen, B.E. Bierer, and S.J. Burakoff. 1991. CD43, a molecule defective in Wiskott-Aldrich syndrome, binds ICAM-1. Nature. 354: 233–235.
21. Simms, M.S., O.D. Hughes, M. Limb, M.R. Price, and M.C. Bishop. 1999. MUC1 mucin as a tumour marker in bladder cancer. BJU Int. 84: 350–352.
22. Geng, Y., K. Yeh, T. Takatani, and M.R. King. 2012. Three to tango: MUC1 as a ligand for both E-selectin and ICAM-1 in the breast cancer metastatic cascade. Front. Oncol. 76: 1-8.
23. Hayashi, T., T. Takahashi, S. Motoya, T. Ishida, F. Itoh, M. Adachi, Y. Hinoda, and K. Imai. 2001. MUC1 mucin core protein binds to the domain 1 of ICAM-1. Digestion. 63 Suppl 1: 87–92.
24. Fernandez-Rodriguez, J., C.X. Andersson, S. Laos, D. Baeckström, A. Sikut, R. Sikut, and G.C. Hansson. 2002. The Leukocyte Antigen CD43 Is Expressed in Different Cell Lines of Nonhematopoietic Origin. Tumor Biol. 23: 193–201.
25. Tuccillo, F.M., C. Palmieri, G. Fiume, A. de Laurentiis, M. Schiavone, C. Falcone, E. Iaccino, R. Galandrini, C. Capuano, A. Santoni, F.P. D’Armiento, C. Arra, A. Barbieri, F. D. Piaz, D. Venzon, P. Bonelli, F.M. Buonaguro, I. Scala, M. Mallardo, I. Quinto, and G. Scala. 2014. Cancer-associated CD43 glycoforms as target of immunotherapy. Mol. Cancer Ther. 13: 752–762.
26. Friedrichs, J., J. Helenius, and D.J. Müller. 2010. Quantifying cellular adhesion to extracellular matrix components by single-cell force spectroscopy. Nat. Protoc. 5: 1353– 1361.
27. Franz, C.M., A. Taubenberger, P.H. Puech, and D.J. Müller. 2007. Studying integrin-mediated cell adhesion at the single-molecule level using AFM force spectroscopy. Sci. Signalling. 406:1-15.
28. Puech, P.H., A. Taubenberger, F. Ulrich, M. Krieg, D.J. Müller, and C.P. Heisenberg. 2005. Measuring cell adhesion forces of primary gastrulating cells from zebrafish using atomic force microscopy. J. Cell Sci. 118: 4199–4206.
29. Taubenberger, A., D.A. Cisneros, J. Friedrichs, P.H. Puech, D.J. Müller, and C.M. Franz. 2007. Revealing Early Steps of α2β1 Integrin-mediated Adhesion to Collagen Type I by
Using Single-Cell Force Spectroscopy. Mol. Biol. Cell. 18: 1634–1644.
30. Sulchek, T.A, R.W. Friddle, K. Langry, E.Y. Lau, H. Albrecht, T. V Ratto, S.J. DeNardo, M.E. Colvin, and A. Noy. 2005. Dynamic force spectroscopy of parallel individual Mucin1-antibody bonds. Proc. Natl. Acad. Sci. U. S. A. 102: 16638–16643.
31. Alsteens, D., M.C. Garcia, P.N. Lipke, and Y.F. Dufrêne. 2010. Force-induced formation and propagation of adhesion nanodomains in living fungal cells. Proc. Natl. Acad. Sci. U. S. A. 107: 20744–20749.
32. Pfreundschuh, M., D. Alsteens, R. Wieneke, C. Zhang, S.R. Coughlin, R. Tampé, B.K. Kobilka, and D.J. Müller. 2015. Identifying and quantifying two ligand-binding sites while imaging native human membrane receptors by AFM. Nat. Commun. 6: 8857-8863. 33. Zhang, X., E.P. Wojcikiewicz, and V.T. Moy. 2006. Dynamic Adhesion of T
Lymphocytes to Endothelial Cells Revealed by Atomic Force Microscopy. Exp. Biol. Med. 231: 1306–1312.
34. Champelovier, P., A. Simon, C. Garrel, G. Levacher, V. Praloran, and D. Seigneurin. 2003. Is interferon gamma one key of metastatic potential increase in human bladder carcinoma? Clin Cancer Res. 9: 4562–4569.
35. Masters, J.R.W., P.J. Hepburn, L. Walker, W.J. Highman, L.K. Trejdosiewicz, S. Povey, M. Parkar, B.T. Hill, P.R. Riddle, and L.M. Franks. 1986. Tissue Culture Model of Transitional Cell Carcinoma: Characterization of Twenty-two Human Urothelial Cell Lines. Cancer Res. 46: 3630–3636.
36. Ziprin, P., N.A. Alkhamesi, F. Paul, D.H. Peck, and A.W. Darzi. 2004. Tumour-expressed CD43 (sialophorin) mediates tumour-mesothelial cell adhesion. Biol. Chem. 385: 755– 761.
37. Hutter, J.L., and J. Bechhoefer. 1993. Calibration of atomic-force microscope tips. Rev. Sci. Instrum. 64: 1868-1873.
38. Schubert, R., N. Strohmeyer, M. Bharadwaj, S.P. Ramanathan, M. Krieg, J. Friedrichs, C.M. Franz, and D.J. Müller. 2014. Assay for characterizing the recovery of vertebrate cells for adhesion measurements by single-cell force spectroscopy. FEBS Lett. 588: 3639– 3648.
39. Benoit, M., D. Gabriel, G. Gerisch, and H.E. Gaub. 2000. Discrete interactions in cell adhesion measured by single-molecule force spectroscopy. Nat. Cell Biol. 2: 313–317. 40. Kerssemakers, J.W.J., E.L. Munteanu, L. Laan, T.L. Noetzel, M.E. Janson, and M.
Dogterom. 2006. Assembly dynamics of microtubules at molecular resolution. Nature. 442: 709–712.
optimal bandwidth selection for protein unfolding and unbinding data. J. Chem. Phys. 130: 1-15.
42. Bizzari A.R, and S. Cannistraro 2012. Biological applications of dynamic force spectroscopy. In Dynamic Force Spectroscopy and Biomolecular recognition, Chapter 6. CRC Press, pp 163-192.
43. Imoukhuede, P.I., and A.S. Popel. 2014. Quantitative fluorescent profiling of VEGFRs reveals tumor cell and endothelial cell heterogeneity in breast cancer xenografts. Cancer Med. 3: 225–244.
44. Weddell, J.C., and P.I. Imoukhuede. 2014. Quantitative characterization of cellular membrane-receptor heterogeneity through statistical and computational modeling. PLoS One. 9: e97271.
45. Puech, P.H., K. Poole, D. Knebel, and D.J. Müller. 2006. A new technical approach to quantify cell-cell adhesion forces by AFM. Ultramicroscopy. 106: 637–644.
46. Tulla, M., J. Helenius, J. Jokinen, A. Taubenberger, D.J. Müller, and J. Heino. 2008. TPA primes alpha2beta1 integrins for cell adhesion. FEBS Lett. 582: 3520–3524.
47. Barreiro, O., M. Yáñez-Mó, J.M. Serrador, M.C. Montoya, M. Vicente-Manzanares, R. Tejedor, H. Furthmayr, and F. Sanchez-Madrid. 2002. Dynamic interaction of VCAM-1 and ICAM-1 with moesin and ezrin in a novel endothelial docking structure for adherent leukocytes. J. Cell Biol. 157: 1233–1245.
48. Zhang, X., S.E. Craig, H. Kirby, M.J. Humphries, and V.T. Moy. 2004. Molecular basis for the dynamic strength of the Integrin alpha4beta1/VCAM-1 interaction. Biophys. J. 87:
3470–3478.
49. Heroult, M., F. Schaffner, D. Pfaff, C. Prahst, R. Kirmse, S. Kutschera, M. Riedel, T. Ludwig, P. Vajkoczy, R. Graeser, and H.G. Augustin. 2010. EphB4 Promotes Site-Specific Metastatic Tumor Cell Dissemination by Interacting with Endothelial Cell-Expressed EphrinB2. Mol. Cancer Res. 8: 1297–1309.
50. Karsten, U., N. Serttas, H. Paulsen, A. Danielczyk, and S. Goletz. 2004. Binding patterns of DTR-specific antibodies reveal a glycosylation-conditioned tumor-specific epitope of the epithelial mucin (MUC1). Glycobiology. 14: 681–692.
51. Fujii, T., K. Shimada, S. Anai, K. Fujimoto, and N. Konishi. 2013. ALKBH2, a novel AlkB homologue, contributes to human bladder cancer progression by regulating MUC1 expression. Cancer Sci. 104: 321–327.
52. Kaur, S., N. Momi, S. Chakraborty, D.G. Wagner, A.J. Horn, S.M. Lele, D. Theodorescu, and S.K. Batra. 2014. Altered expression of transmembrane mucins, MUC1 and MUC4, in bladder cancer: pathological implications in diagnosis. PLoS One. 9: e92742.
53. Santamaría, M., A. López-beltrán, M. Toro, J. Peña, and I.J. Molina. 1996. Specific Monoclonal Antibodies against Leukocyte-restricted Tumor Cells React with Nonhematopoietic Tumor. Cancer Res. 56: 3526–3529.
54. Hurford, M.T., S. Gujral, S.J. Schuster, and R. Schwarting. 1999. Extramedullary myeloid cell tumor of the urinary bladder in a patient with myelodysplastic syndrome. Pathol. Res.
Pract. 195: 699–703.
55. Rahn, J.J., J.W. Chow, G.J. Horne, B.K. Mah, J.T. Emerman, P. Hoffman, and J.C. Hugh. 2005. MUC1 mediates transendothelial migration in vitro by ligating endothelial cell ICAM-1. Clin. Exp. Metastasis. 22: 475–483.
56. Matsumoto, M., K. Atarashi, E. Umemoto, Y. Furukawa, A. Shigeta, M. Miyasaka, and T. Hirata. 2005. CD43 functions as a ligand for E-Selectin on activated T cells. J. Immunol. 175: 8042–8050.
57. Fierro, F.A., A. Taubenberger, P.H. Puech, G. Ehninger, M. Bornhauser, D.J. Müller, and T. Illmer. 2008. BCR/ABL Expression of Myeloid Progenitors Increases β1-Integrin Mediated Adhesion to Stromal Cells. J. Mol. Biol. 377: 1082–1093.
58. Wojcikiewicz, E.P., X. Zhang, A. Chen, and V.T. Moy. 2003. Contributions of molecular binding events and cellular compliance to the modulation of leukocyte adhesion. J. Cell Sci. 116: 2531–2539.
59. Wojcikiewicz, E.P., M.H. Abdulreda, X. Zhang, and V.T. Moy. 2006. Force spectroscopy of LFA-1 and its ligands, ICAM-1 and ICAM-2. Biomacromolecules. 7: 3188–3195. 60. Taninaka, A., Y. Hirano, O. Takeuchi, and H. Shigekawa. 2012. Force measurement
enabling precise analysis by dynamic force spectroscopy. Int. J. Mol. Sci. 13: 453–465. 61. Helenius, J., C.P. Heisenberg, H.E. Gaub, and D.J. Müller. 2008. Single-cell force
spectroscopy. J. Cell Sci. 121: 1785–1791.
62. Bennett Jr., R., T. Jarvela, P. Engelhardt, L. Kostamovaara, P. Sparks, O. Carpen, O. Turunen, and A. Vaheri. 2001. Mucin MUC1 is seen in cell surface protrusions together with ezrin in immunoelectron tomography and is concentrated at tips of filopodial protrusions in MCF-7 breast carcinoma cells. J Histochem Cytochem. 49: 67–77.
63. Serrador, J.M., M. Nieto, J.L. Alonso-Lebrero, M.A. Del Pozo, J. Calvo, H. Furthmayr, R. Schwartz-Albiez, F. Lozano, R. González-Amaro, P. Mateos, and F. Sánchez-Madrid. 1998. CD43 interacts with moesin and ezrin and regulates its redistribution to the uropods of T lymphocytes at the cell-cell contacts. Blood. 91: 4632–4644.
64. Friedrichs, J., K.R. Legate, R. Schubert, M. Bharadwaj, C. Werner, D.J. Müller, and M. Benoit. 2013. A practical guide to quantify cell adhesion using single-cell force spectroscopy. Methods. 60: 169–178.
65. Celik, E., M.H. Faridi, V. Kumar, S. Deep, V.T. Moy, and V. Gupta. 2013. Agonist leukadherin-1 increases CD11b/CD18-Dependent adhesion via membrane tethers. Biophys. J. 105: 2517–2527.
66. Sariisik, E., C. Popov, J.P. Müller, D. Docheva, H. Clausen-Schaumann, and M. Benoit. 2015. Decoding Cytoskeleton-Anchored and Non-Anchored Receptors from Single-Cell Adhesion Force Data. Biophys. J. 109: 1330–1333.
67. Sun, M., J.S. Graham, B. Hegedüs, F. Marga, Y. Zhang, G. Forgacs, and M. Grandbois. 2005. Multiple membrane tethers probed by atomic force microscopy. Biophys. J. 89: 4320–4329.
SUPPORTING MATERIAL