Computational Naval Ship Hydrodynamics
The MIT Faculty has made this article openly available.
Please share
how this access benefits you. Your story matters.
Citation
Brucker, Kyle A., Douglas G. Dommermuth, Thomas T. O’Shea, Dick
K. P. Yue, Kelli Hendrickson, and Gabriel Weymouth. “Computational
Naval Ship Hydrodynamics.” 2010 DoD High Performance
Computing Modernization Program Users Group Conference, 14-17
June, 2010, Schaumburg, Illinois, USA, IEEE, 2011.
As Published
http://dx.doi.org/10.1109/HPCMP-UGC.2010.62
Publisher
Institute of Electrical and Electronics Engineers (IEEE)
Version
Author's final manuscript
Citable link
http://hdl.handle.net/1721.1/120298
Terms of Use
Creative Commons Attribution-Noncommercial-Share Alike
Computational Naval Ship Hydrodynamics
Kyle A. Brucker (
[email protected]
),
aGabriel Weymouth
([email protected]
),
bKelli Hendrickson
([email protected]
),
aThomas O’Shea (
thomas.t.o’[email protected]
),
aDouglas G. Dommermuth
([email protected]
),
aand
Dick K.P. Yue
([email protected]
)
ba
Naval Hydrodynamics Division, Science Applications International Corporation,
10260 Campus Point Drive, M/S C5, San Diego, CA 92121
b
Department of Mechanical Engineering, Massachusetts Institute of Technology,
77 Massachusetts Avenue, Cambridge, MA 02139
DISTRIBUTION STATEMENT A. Approved for public release; distribution is unlimited.
Abstract
The primary purpose of our research efforts is to improve naval design and detection capabilities. Our current research efforts leverage HPC resources to perform high-resolution numerical simulations with hundreds of millions to billions of unknowns to study wave breaking behind a transom stern, wave-impact loading, the generation of spray by high-speed planing craft, air entrainment by plunging breaking waves, forced-motion, and storm seas. This paper focuses on the air entrainment and free-surface turbulence in the flow behind a transom-stern and wave-impact loading on marine platforms. Two codes, Numerical Flow Analysis (NFA) and Boundary Data Immersion Method (BDIM), are used in this study. Both codes are Cartesian-based LES formulations, and use either Volume of Fluid (VOF) (NFA) or conservative Volume of Fluid (cVOF) (BDIM) treatments to track the free-surface interface. The first project area discussed is the flow behind the transom stern. BDIM simulations are used to study the volume of entrained air behind the stern. The application of a Lagrangian bubble-extraction algorithm elucidates the location of air cavities in the wake and the bubble-size distribution for a flow that has over 10% void fraction. NFA simulations of the transom-stern flow are validated by comparing the numerical simulations to experiments performed at the Naval Surface Warfare Center Carderock Division (NSWCCD), where good agreement between simulations and experiments is obtained for mean elevations and regions of white water in the wake. The second project area discussed is wave impact loading, a topic driven by recent structural failures of high-speed planing vessels and other advanced vehicles, as well as the devastation caused by Tsunamis impacting low-lying coastal areas. NFA simulations of wave breaking events are compared to the NSWCCD cube impact experiments and the Oregon State University O.H. Hinsdale Wave Research Laboratories Tsunami experiments and it is shown that NFA is able to accurately simulate the propagation of waves over long distances after which it also accurately predicts highly-energetic impact events.
1. Introduction
A critical remaining challenge in modern Naval-ship design and analysis is accounting for the effects of breaking waves, spray, and air entrainment on the performance and signatures of surface ships. Aside from the need to model complex physics, the design of the ships themselves are becoming more complex with the incorporation of advanced hull forms such as the tumblehome bows and trimaran hulls currently employed in the DDG 1000 and LCS designs. Moreover, as the Navy considers novel hull concepts and extreme operating environments and conditions, the design process will require extrapolation from current design databases and rely heavily on computational tools. Given this framework, the first objective of our research is to validate numerical methods that are capable of modeling complex physics such as (i) spray-sheet and jet formation; (ii) air entrainment and bubble generation; and (iii) strong free-surface turbulence interactions with large-amplitude breaking waves. The second objective of our research is to provide design support for assessing the performance and signatures of the next generation of naval vessels undergoing extreme loads and motions while operating at high speed. The results of this research effort will improve our capability of simulating and understanding how these complex phenomena affect the design and analysis of Navy ships.
This paper focuses on the results of our second year of effort towards these two objectives, where we have focused on air entrainment and free-surface turbulence in the flow behind a transom stern and wave-impact loading on marine
platforms. Underpinning both of these areas of research are validations with experiments performed at the Naval Surface Warfare Center Carderock Division (NSWCCD). In this paper, we perform a systematic study of these problems using our core applications and validate them against available experimental data. Section 2 provides details and references for these core applications. Section 3 highlights our work on transom-stern flows, emphasizing the air entrainment and free-surface turbulence and comparisons to experiments performed at NSWCCD. Section 4 outlines two comparisons between experiments and simulations in the area of wave-impact loading on marine platforms. Section 5 is a summary of our primary results and their significance to the DoD.
2. Numerical Approach
Two core applications, Numerical Flow Analysis (NFA) and Boundary Data Immersion Method (BDIM), are used in this study. Each of these codes has been previously described and discussed and we focus on recent improvements and their ability to scale to large numbers of processors. NFA is a Cartesian-based implicit-LES solver that uses the Volume of Fluid (VOF) interface tracking method. The numerical algorithm and details of its implementation on distributed memory HPC platforms are given in (Dommermuth, et al. 2008). One significant modification to the inter-processor data communication routines and sub-domain layout was implemented. This modification leverages the small number of blocks (or sub-domains) in any one direction that result from the three-dimensional domain decomposition and allows 1-dimensional sub-communicators to replace the global communicator in MPI collective data operations. In conjunction with the data-communication modifications the data allocation in memory was optimized with respect to the most intensive portions of the solver. Together these modifications improved the execution time in terms of wall-clock hours and CPU hours required per unknown by a factor of 2-10 and allow NFA to scale to thousands of processors. Figure 1 shows the results of both the current implementation (NFA2.0) and its predecessor (NFA) in terms of number of iterations per hour achieved for 1283 unknowns per core as the number of cores is increased. As the number of cores increases the number of unknowns increases in direct proportion, for example the case with 1024 cores has 2.15 billion unknowns whereas the case with 8 cores has 16.7 million unknowns. Hence, ideal performance (i.e. in the limit of communication time tending to zero) would be indicated by a horizontal line. In summary, Figure 1 shows that more grid points can be solved for with fewer processors and less time, and that NFA2.0 is capable of efficiently simulating jobs with billions of grid points in a reasonable number of wall-clock hours.
BDIM is also a Cartesian-based implicit-LES solver that uses the conservative Volume of Fluid (cVOF) method to track the interface. The numerical algorithm is given in (Weymouth and Yue 2010). Recent scaling studies of the multigrid solver used to solve the Poisson equation for the pressure field in BDIM were performed and the Cray-XT4 located at ERDC (Jade). It was found that collective operations such as MPI_ALLREDUCE provided the biggest impediment to scalability, as expected, and the multi-grid solver was modified to reduce the need for collective operations and performance was improved.
3. Air Entrainment and Free-surface Turbulence of Transom Sterns
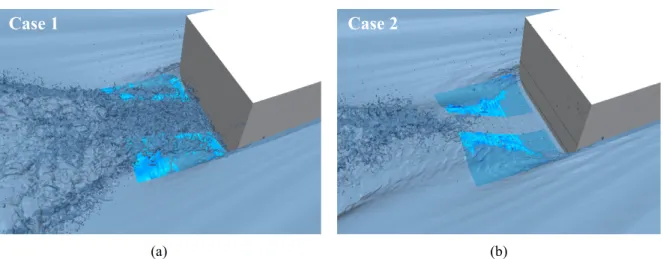
NFA predictions of a transom-stern flow are compared to laboratory measurements that have been performed at NSWCCD (see Dommermuth, et al. 2008; Fu, et al. 2008b; and Wyatt, et al. 2010). The three-dimensional numerical simulations use 1408x768x384= 415,236,096 grid points which are distributed over 396 nodes on a Cray XT5 (Einstein at NAVO) and run for 31,000 time steps corresponding to 7.75 ship lengths. Each case required about 250 hours of wall-clock time and 100,000 CPU hours. Additional details on the simulation are given in Wyatt, et al. 2010. The results from two cases are presented here. The first (Case 1) is at 7 knots (Fr=Uo/√(gLo)=0.38) is a partially wetted transom condition.
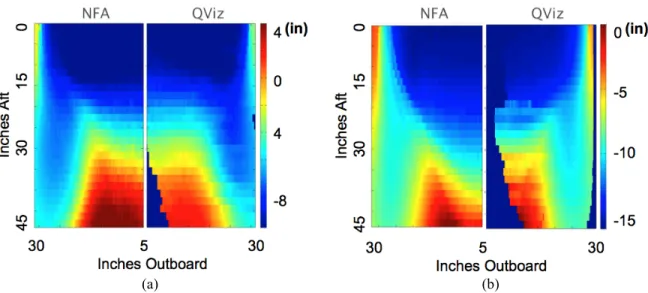
The second (Case 2) is at 8 knots (Fr=0.43) is a dry transom condition. It should be noted here that the physics of the flow change between these two conditions and NFA predicts these two conditions accordingly. Figure 2 compares instantaneous NFA predictions (dark blue) to mean QViz measurements (light blue) of the free-surface elevation for 7 and 8-knot speeds. The NFA results are partially transparent to show the entrainment of air due to free-surface turbulence. The transom is partially wet for 7 knots and fully dry for 8 knots. The turbulence in the transom region is significantly larger for 7 knots than 8 knots. The agreement between NFA predictions and QViz measurements is excellent. Figure 3 extends the results of the qualitative comparison shown in Figure 2 to a quantitative one in which the NFA predictions are compared to QViz measurements for the mean free-surface elevation behind the transom for 7- and 8-knot speeds. The red contours denote wave crests, and the blue contours denote wave troughs. The numerical and experimental results have been averaged in time. The correlation coefficients between the predictions and the measurements are 0.978 and 0.960 for respectively 7 and 8 knots. The excellent prediction of the average free-surface elevation allows for the investigation mean and r.m.s. quantities on the surface. Figure 4 is an example of how much information can be derived from these quantities. Figure 4 compares NFA predictions to measurements for the flow behind the transom for the 7-knot speed. The measurements
show time-averaged pixel value from a video of the experiments whereas the NFA predictions show stream-wise velocity r.m.s. velocity fluctuations on the free surface. The result that the r.m.s. velocity on the free-surface mimics the specular return observed in the video provides a criteria which may help in identifying regions of whitewater where air is entrained.
BDIM simulations of a canonical transom stern configuration are used to better understand the unsteady entrained air behind a transom stern. This transom geometry is a simple 3D backward facing step with half-width equal to the submergence depth ‘h’ with uniform inlet velocity ‘U’. Since the canonical geometry has no bow, the development of the near-wall boundary layer is not simulated and the body boundary conditions are set to free-slip. The Cartesian background grid is set to obtain LES resolution levels: ΔtU/h=0.00125, Δxmin/h=0.0125 near the body and interface, and Δxmax/h=0.1 far
from the regions of interest. The transom is essentially dry with only occasional wetting due to the highly energetic nature of the flow. To understand the influence of various geometrical quantities on the air entrained in the wake, the canonical stern geometry is modified by using increasing “transom keel angle” (α) to understand the influence of various geometrical quantities on the air entrained in the wake.
Figure 5 shows the instantaneous interface and the average surface and transverse slices of the averaged void fraction in the flow for the three geometries considered. The transom keel angle (α>0) can be seen in the instantaneous images in Figure 5. For the flows considered, the transom keel angle acts very much like a ramp, accelerating the flow off of the back of the stern and increasing the energy of the flow. The maximum averaged void fraction in the wake as well as the distribution of air in the wake changes significantly as the transom keel angle increases. This can be observed by comparing Figures 5b with α=0.00, 5d with α=0.10, and 5f with α=0.20.
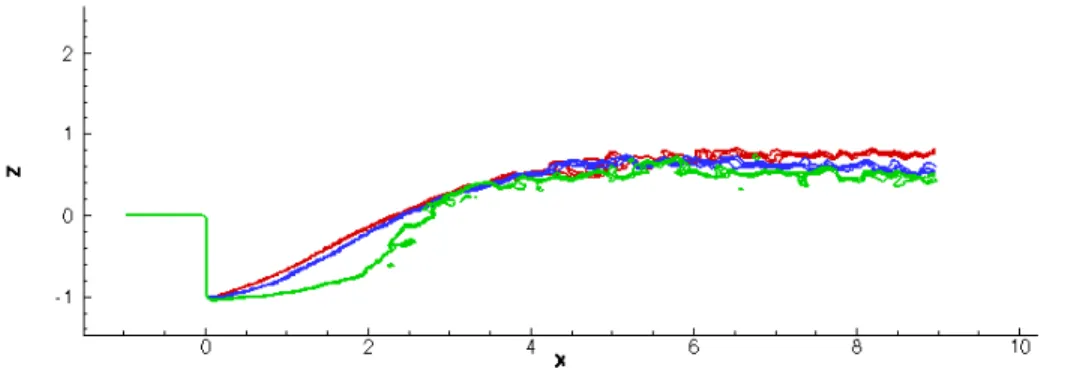
Figure 6 shows the mean centerline surface elevation for three different transom keel angles at this Froude number. While the mean surface elevation has little significant difference far downstream of the stern, the flow closer to the sterns shows the effect of zero verses non-zero keel angle. The linear dependence of the slope of the mean interface on the centerline has been reported in experiments. For the non-zero keel angle, the slope of the mean interface appears to have little dependence on the actual transom keel angle.
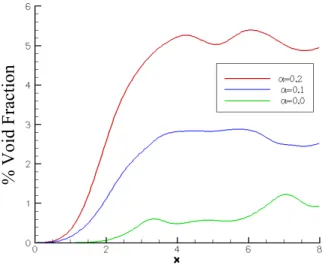
Of particular interest for air entrainment modeling is the characterization of the quantity of entrained air within the wake of the stern. Figure 7 shows the cross-sectional bubble volume as a function of distance downstream of the stern for the three different geometries. The bubble volumes are determined with a Lagrangian “blob” extraction technique. The effect of the transom keel angle is significant in the amount of air being entrained. Further study of this and other geometrical effects is the focus of ongoing research.
4. Wave-Impact Loading on Marine Platforms
NFA predictions of wave-impact loading are compared to laboratory measurements at Oregon State University (OSU) (Oshnack, et al. 2009) and at NSWCCD (Fullerton, et al. 2008; Fullerton, et al. 2009; and Fullerton, et al. 2010). The OSU experiments are motivated by Tsunamis causing significant loss of life and property in low-lying coastal areas. The NSWCCD experiments are motivated by a structural failure due to wave slamming of the Advanced Swimmer Delivery System (ASDS).
The input for OSU soliton simulation is based on laboratory measurements from experiments performed at the O.H. Hinsdale Wave Research Laboratory at OSU (see Oshnack, et al. 2009). In the OSU experiments, a soliton is sent down a wave flume, runs up a small beach, and impacts with a wall. Of particular interest for the experiments at OSU are scouring on the beach and impact loading on the wall. The three-dimensional numerical simulations use 4608x256x640=754,974,720 grid points which are distributed over 360 nodes on the SGI Altix ICE (diamond at the ERDC) and run for 41,500 time steps. This required about 300 hours of wall-clock time and 110,000 CPU hours. The soliton is about 1.2m high in a water depth of 2.29m. The soliton travels over 61m before hitting the breakwater. As show in Figure 8, the soliton rises up the beach and overturns (a-c). A pocket of air is trapped beneath the plunging breaker (d-f). The air pocket breaks up due to Kelvin-Helmholtz instability (g). The formation of air pockets contributes to beach erosion due to scouring (g-h). A thin jet forms on the flat portion of the beach (h). The jet impacts the breakwater (i).
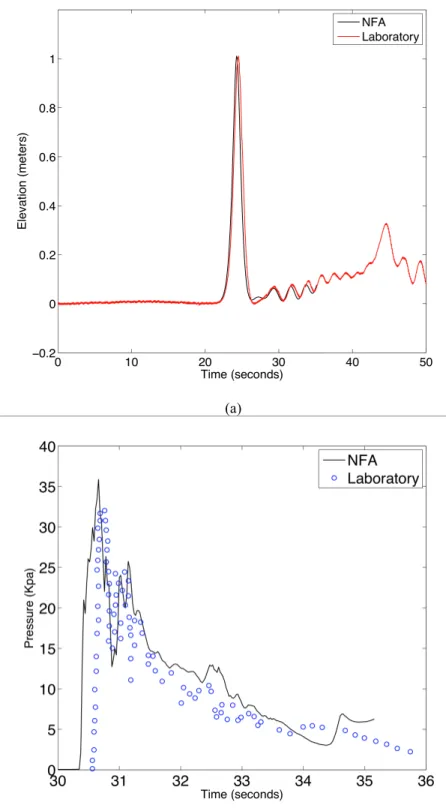
Figures 9a and 9b compare NFA predictions to laboratory measurements for a) free-surface elevation 21.5m down the tank and b) impact pressure at the base of the breakwater. The free-surface elevations as predicted by NFA are in excellent agreement with experimental measurements. This shows that NFA can simulate the propagation of waves over long distances with minimal amplitude and dispersion errors. Pressures that are induced by the jet are important because in
certain coastal areas buildings must be designed to sustain Tsunami loads. The pressure predictions also agree very well with experiments. In particular, the peak pressures as predicted by NFA agree very well with experiments. Overall, the ability of NFA to predict the wave slamming loads is remarkable because the wave had to travel over a great distance, nearly 61m, before breaking and impacting the wall.
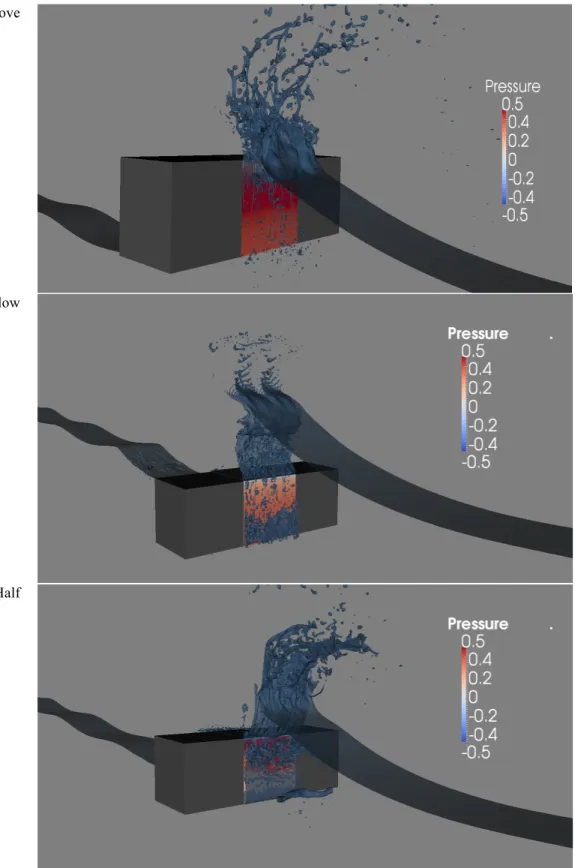
In the NSWCD experiments, the impact loading due to waves slamming on cube are investigated for regular and irregular waves for 3 different levels of immersion of the cube (measured relative to the calm free surface), including no immersion, half immersed, and fully immersed. Here our comparison focuses on the irregular breaking wave cases. The parameters in the cube-impact experiments described in Fullerton, et al. 2009 were used as the basis for three-dimensional numerical simulations. The computational domain consisted of 2048x128x768=201,326,592 grid points which were distributed over 192 nodes on the SGI Altix ICE (diamond at the ERDC) and run for 40,000 time steps. This required about 100 hours of wall-clock time and 20,000 CPU hours per simulation. Unlike the OSU comparison where the motion of the wave-maker was the same between experiment and simulation, here a pressure forcing technique was used to generate the breaking waves. The pressure forcing technique is described and validated in Brucker, et al. 2010. The application of this technique created an irregular wave with h/λ=0.063 (where h is the wave amplitude and λ is the wave length) which broke in close proximity to the front face of the cube. Figure 10 shows the iso-contour representation of the free-surface and pressure distribution on the front face of the cube near the instant of maximum pressure on the front face for the cube a) above mean water level (MWL), b) below MWL, and c) 50% below MWL.
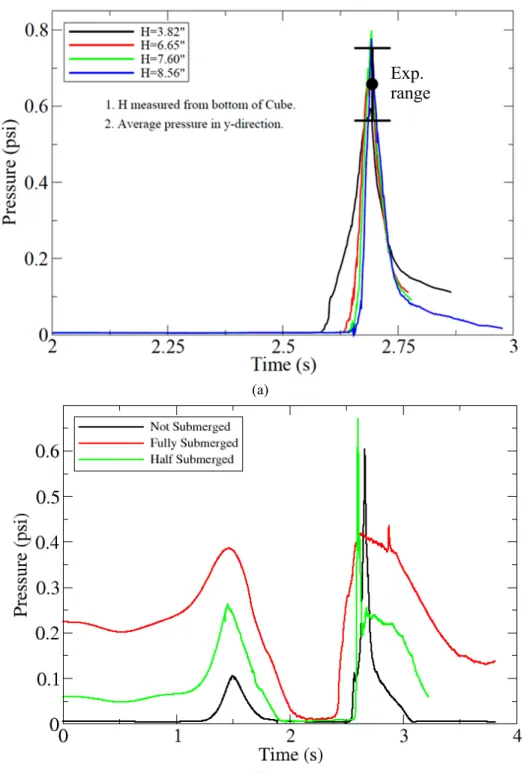
Figure 11a shows the pressure over time at several vertical locations measured from the bottom of the cube (given in figure legend). The peak predicted pressures for the all three cases are in the same range as the values reported in Fullerton, et al. 2009, shown in Figure 11a as large black dot (average) and error bars (range). Figure 11b shows the effect of the submergence level on the peak pressure. The first impact shown in Figure 11b, around t=1.5s, is during the development period and h/λ is smaller than 0.063. The second impact, around t=2.5s, shows that the position of the cube with respect to the MWL can change the pressure by +/- 100%
5. Conclusions
This work has focused on two types of problems significant to understanding the effects of breaking waves, spray, air entrainment and extreme motions and wave loads on the performance and signatures of surface ships. Through a carefully validated computational effort, we have studied the air entrainment and free-surface turbulence for a transom-stern and the wave-impact loading on marine platforms. For the transom stern, we identified the important kinematic features in these flows and have also begun to understand the effect geometry has on the quantity and location of air entrainment behind a transom stern. For the wave-impact loading, we have shown the capability of our numerical calculations to accurately capture intense forces in irregular waves. Future research efforts will continue to explore the transom stern problem by continuing quantitative comparisons to available experimental data, prediction of internal wave generation due to submerged obstacles, and continued study of steady and unsteady breaking waves for the purpose of developing appropriate turbulence closure models for use in highly mixed turbulent flows.
Significance to DoD
Accounting for the effects of breaking waves, complex hull forms, and extreme motions and wave loads on the performance and non-acoustical signature of a surface ship is one of the main remaining challenges remaining in modern naval ship design. Recent software and hardware advances are close to meeting this challenge.
Acknowledgements
The Office of Naval Research supports this research under contract number N00014-07-C-0184 and N00014-01-1-0124. Dr. Patrick Purtell is the program manager. This work is supported in part by a grant of computer time from the DOD High Performance Computing Modernization Program (http://www.hpcmo.hpc.mil/). The numerical simulations have been performed on the SGI Altix ICE and the Cray XT4 at the U.S. Army Engineering Research and Development Center (ERDC), and on the Cray XT5 at the Navy DoD Supercomputing Resource Center (NAVO). The support of the flow visualization group at ERDC under the guidance of Paul Adams is gratefully acknowledged. Animations of NFA simulations are available at http://www.saic.com/maritime/NFA
.
References
Proceeding of the 28th Symposium on Naval Hydrodynamics, Pasadena, CA, USA, 2010, to appear.
Dommermuth, D. G., O’Shea, T. T., Brucker, K. A., & Wyatt, D. C., “A numerical formulation for simulating free-surface
hydrodynamics,” Proceedings of the 27th Symposium on Naval Hydrodynamics, Seoul, Korea, 2008.
Dommermuth, D. G., Fu, T. C., Brucker, K. A., O’Shea, T. T., & Wyatt, D. C., “Numerical prediction of a seaway,” Proceeding of the
28th Symposium on Naval Hydrodynamics, Pasadena, CA, USA, 2010, to appear.
Hendrickson, K. & Yue, D. K.-P., “Models for Simulating Breaking Waves in Computational Ship Hydrodynamics,” Proceedings of the
27th Symposium on Naval Ship Hydrodynamics, Seoul, Korea, 2008.
Hendrickson, K., Dong, X., O’Shea, T. T., Dommermuth, D. G., Weymouth, G. & Yue, D. K.-P., “Modeling Breaking Ship Waves for Design and Analysis of Naval Vessels,” Proceedings of the HPCMO User’s Group Conference, 2005, Pittsburgh, PA.
Fu, T. C., Dommermuth, D. G., O’Shea, T. T., & Ratcliffe, T., “A comparison of experimental measurements and computational
predictions of a deep-v planing hull,” Proceeding of the 28th Symposium on Naval Hydrodynamics, Pasadena, CA, USA, 2010, to
appear.
Fu, T. C., Fullerton, A., Brewton, S., Brucker, K., & Dommermuth, D., “An experimental and computational study of breaking-wave impact forces,” Proceedings of the 27th Symposium on Naval Hydrodynamics, Seoul, Korea, 2008a.
Fu, T. C., Fullerton, A., Ratcliffe, T., Minnick, L., Walker, D., Pence, M., & Anderson, K., A Detailed Experimental Study of Transom Breaking Waves, Technical Report NSWCCD-50-TR-2008, Naval Surface Warfare Center Carderock Division, Hydromechanics Department, 2008b.
Fullerton, A.M., Fu, T. C., Ammeen, E. S., “Distribution of wave impact forces from breaking and non-breaking waves,” Proceeding of
the 28th International Conference on Ocean, Offshore, and Arctic Engineering, Honolulu, HI, USA, 2009.
Fullerton, A.M., Fu, T. C., Brewton, S., O’Shea, T. T., Brucker, K. A., & Dommermuth, D. G., “A comparison of measured and
predicted wave-impact pressures from breaking and non-breaking waves,” Proceeding of the 28th Symposium on Naval Hydrodynamics,
Pasadena, CA, USA, 2010, to appear.
Oshnack, M. E., Aguiniga, F., Cox, D., Gupta, R., & Lindt, J. de L, “Effectiveness of small onshore seawall in reducing forces induced by tsunami bore: large-scale experimental study,” J. Disaster Res., Vol. 4 (6), 2009.
Ratcliffe, T., Minnick, L., O’Shea, T., Fu, T., Russell, L., & Dommermuth, D., “An integrated experimental and computational investigation into the dynamic loads and free-surface wave-field perturbations induced by head-sea regular waves on a 1/8.25 scale-model of the R/V Athena,” Proceedings of the 27th Symposium on Naval Hydrodynamics, Seoul, Korea, 2008.
Rottman, J.W., Brucker, K. A., Dommermuth, D. G., & Broutman, D., “Parameterization of the internal wave field generated by a
submarine and its turbulent wake in a uniformly stratified fluid,” Proceeding of the 28th Symposium on Naval Hydrodynamics, Pasadena,
CA, USA, 2010, to appear.
Weymouth, G.D. & Yue, D. K.-P., “Conservative Volume of Fluid Method for Free-Interface Simulations on Cartesian Grids,” Journal of Computational Physics, Vol. 229 (8), 2010.
Wyatt, D., Fu, T., Taylor, G., Terrill, E., Xing, T., Bhusan, S., O’Shea, T., & Dommermuth, D., “A comparison of full-scale experimental measurements and computational predictions of the transom-stern wave of the R/V Athena I,” Proceedings of the 27th Symposium on Naval Hydrodynamics, Seoul, Korea, 2008.
Wyatt, D. C., Bhushan, S., Brucker, K. A., Carrica, P., Chevalier, K., Dommermuth, D. G., Fu, T.C., O’Shea, T. T., & Xing, T., “Comparisons of model-scale experimental measurements and computational predictions for the transom wave of a large-scale transom
Figures
Figure 1. The number of iterations (time steps) per hour achieved while the number of grid points (unknowns) per core is fixed at 128x128x128 and the number of CPU's (or cores) is increased. Results from NFA2.0 are shown in black, while results from the previous version (NFA) are shown in blue. Note that 2.15 Billion unknowns require only ~30 seconds per time step.
(a) (b)
Figure 2. Perspective views of transom-stern flow: (a) Wetted transom at 7 knots and (b) Dry transom at 8 knots.
(a) (b)
Figure 3. Mean free-surface elevation contours: (a) Wetted transom at 7 knots and (b) Dry transom at 8 knots.
Figure 4. NFA results on left show stream-wise r.m.s. velocity fluctuations painted on the free surface. Experiments on the right show time-averaged pixel value from a video of the experiments.
(a) (b)
(c) (d)
(e) (f)
Figure 5. Instantaneous interface (left) and averaged interface with transverse slices showing averaged void fraction (right) for the canonical transom stern geometry with transom keel angle α=0 (a-b), α=0.1 (c-d), and α=0.2 (e-f).
Figure 6. Mean centerline surface elevation for three different transom keel angles α. Flat transom, α=0, (green), α=0.1 (blue) and α=0.2 (red).
Figure 7. Cross-sectional bubble volume as a function of distance downstream of the stern for the three different transom keel angles α.
Figure 8. Snapshots of NFA numerical simulation of a wave breaking on a beach and hitting a breakwater. View from left to right and top to bottom.
a
b
c
d
e
f
g
h
i
(a)
(b)
Figure 9. NFA predictions compared to laboratory experiments for (a) free-surface elevation and (b) pressure acting on base of breakwater.
(a) Above
(b) Below
(c) Half
Figure 10: Snap shots near peak pressures on front face of cube. Irregular breaking waves with H/λ=0.063. Note the dimensional pressure in psi is recovered by multiplying the contour level by 1.381.
(a)
(b)
Figure 11. Comparison between NSWCCD experiments and NFA2.0 for an irregular breaking wave and a cube. (a) Pressures at different vertical locations on the front face of the cube installed above the mean water line. Black circle and error bars represent the experimental range (Fullerton, et al. 2009). (b) Average pressure on front face of cube for different submergence levels.
Exp.
range
View publication stats View publication stats