HAL Id: hal-01393585
https://hal.archives-ouvertes.fr/hal-01393585
Submitted on 7 Nov 2016
HAL is a multi-disciplinary open access
archive for the deposit and dissemination of
sci-entific research documents, whether they are
pub-lished or not. The documents may come from
teaching and research institutions in France or
abroad, or from public or private research centers.
L’archive ouverte pluridisciplinaire HAL, est
destinée au dépôt et à la diffusion de documents
scientifiques de niveau recherche, publiés ou non,
émanant des établissements d’enseignement et de
recherche français ou étrangers, des laboratoires
publics ou privés.
25 kV-50 Hz railway supply modelling for medium
frequencies (0 – 5 kHz)
Caroline Stackler, Florent Morel, Philippe Ladoux, Piotr Dworakowski
To cite this version:
Caroline Stackler, Florent Morel, Philippe Ladoux, Piotr Dworakowski. 25 kV-50 Hz railway
sup-ply modelling for medium frequencies (0 – 5 kHz). ESARS-ITEC, Nov 2016, Toulouse, France.
pp.Electronique, �10.1109/ESARS-ITEC.2016.7841330�. �hal-01393585�
25 kV-50 Hz railway supply modelling for medium
frequencies (0 – 5 kHz)
Caroline STACKLER
1,3a, Florent MOREL
1,2, Philippe LADOUX
3, Piotr DWORAKOWSKI
1 1ITE SuperGrid Institute, 130 rue Léon Blum, F-69100 VILLEURBANNE, France²Univ Lyon, Ecole Centrale de Lyon, CNRS, Laboratoire Ampère, F-69130 ECULLY, France
3LAPLACE, Université de Toulouse, CNRS, INPT, UPS, F-31000 TOULOUSE, France a[email protected]
Abstract—In this paper, a modelling method of a 25 kV-50 Hz
railway line, in a frequency range from 0 to 5 kHz, is presented. A model is proposed to quantify current and voltage harmonics generated by traction converters in different points of the network. An equivalent circuit, taking into account the skin effect for time-domain simulations, is also proposed. A new model, based on state space representation and transfer functions is developed to simplify the study of the interactions between several trains circulating on a line sector. As an example, the amplitudes of the harmonics generated by on-board active rectifiers are computed at several points of the network for a given topology of the overhead line and several positions of two trains on a sector with a junction.
Keywords—railway supply, impedance, skin effect, state space
representation, harmonic interactions, EMC
I. INTRODUCTION
Currently, different topologies of traction chains coexist on a railway network [1]. Thanks to the development of power electronics, new architectures including a medium frequency transformer, are studied to replace the step-down transformer and the input rectifier [2], [3]. These new topologies, are expected to reduce the volume and weight of the traction chain input stage, improve the efficiency and increase the availability. However, the pulse-width modulation techniques used to control the input rectifiers generate harmonics in the line current. The current harmonics interact with the impedance of the railway infrastructure. Disturbances can thus be generated in the overhead line voltage. The resulting harmonics may be a source of perturbations for signalling circuits or for other trains on the same sector [4]. Interoperability standards and constraints imposed by railway companies limit the harmonic level rejected into the overhead line. As an example, the European standard EN 50388, limits the peak voltage to 50 kV in every point of the overhead line [5]. Moreover, no harmonic is allowed in the frequency ranges corresponding to railway signalling. A model combining the infrastructure and the traction chain is necessary. The model has to be valid in the frequency range of the harmonics generated by the traction chains in order to evaluate the impact of the harmonics on the grid and to verify the compliance with standards.
After a brief state of the art on the methodology used for 25 kV-50 Hz railway supply modelling, this paper presents an equivalent circuit reproducing, in the time domain, the variation of the overhead line resistance in function of frequency due to
the skin effect. A novel approach based on the state space representation is then described. In addition to a reduction of the simulation complexity, it also simplifies a study of several trains on the same sector and, hence, the analysis of the influence of one train on another. The interactions between the input converter with 4 active rectifiers and a 25 kV-50 Hz infrastructure are then analysed. Simulation results using a line sector with a junction are presented.
II. STATE OF THE ART
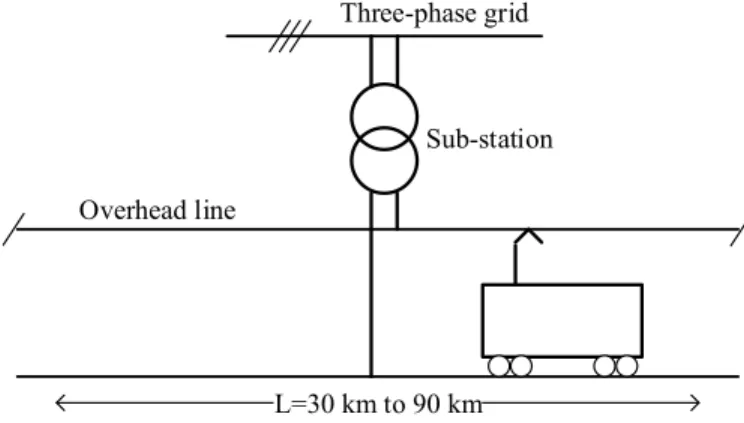
Usually, a 25 kV-50 Hz railway line is composed by 30-to-90 km electrically independent sectors (Fig. 1). Each sector is supplied by a single phase sub-station transformer connected between two phases of the three-phase grid. The three-phase grid and the sub-station transformer may be modelled by lumped inductive and resistive parameters associated in series [1]. However, at 5 kHz, the wave length in the overhead line (49 km) is commensurable to the length of a sector and the propagation effects cannot be neglected in the frequency range considered for these lengths. Hence, the overhead line can be described by the theory of the multi-conductor transmission lines (MTL) with distributed parameters. For frequencies up to 5 kHz, a single equivalent conductor (Fig. 2 (left)) can be used to represent the electrical circuit, associating the overhead lines in parallel [6]. For higher frequencies, the interactions between the overhead wires, the geometry of the rails and the fact that the soil is not a perfect conductor have to be taken into account.
L=30 km to 90 km Sub-station Three-phase grid
Overhead line
cdx
rdx
ldx
I(x+dx)
V(x+dx)
I(x)
V(x)
L C/2 C/2 RFig. 2. Equivalent circuit of a one-equivalent conductor overhead line (left) and of an overhead line quadripole with lumped parameters (right)
The electrical behaviour of the overhead line is described by the telegrapher’s equations [1], [4], [6]. From the exact solution of these equations, the input impedance, 𝑍𝐿, of a L-long-overhead line section connected to a load with an impedance, 𝑍0, can be obtained thanks to equation (1) [7],
𝑍𝐿= 𝑍𝑐
𝑍0𝑐ℎ(𝛾𝐿) + 𝑍𝑐𝑠ℎ(𝛾𝐿)
𝑍𝑐𝑐ℎ(𝛾𝐿) + 𝑍0𝑠ℎ(𝛾𝐿) (1)
where 𝑍𝑐 = √𝑟+𝑗𝜔𝑙𝑗𝜔𝑐 , 𝛾 = √𝑗𝜔𝑐(𝑟 + 𝑗𝜔𝑙) are, respectively, the characteristic impedance and the propagation constant of the line depending on the per-unit-length parameters of the overhead line 𝑟, 𝑙 and 𝑐 and the frequency 𝜔. Associating the impedances of the different parts of the fixed installations, the total impedance seen by the train running on a sector can be calculated.
Nevertheless, these expressions, using hyperbolic cosines and sines of complex quantities, are non-linear. Hence, they cannot be implemented in standard simulation softwares operating in the time domain. To address this problem, the line is generally discretised in 𝑁 quadripoles connected in cascade. Their length must be short in front of the wave length of the electrical circuit. Hence, the length depends on the frequency range considered. Thus, each quadripole can be modelled by lumped parameters as presented in Fig. 2 (right).
III. MODELLING OF THE SKIN EFFECT
At 5 kHz, the skin depth 𝛿 in the copper (0.93 mm) is far smaller than the contact line radius (5.8 mm). It results in an apparent increase of the electrical resistance with the increase of the frequency. A frequency-dependent resistance cannot be directly implemented in a time domain simulation software. Hence, an equivalent circuit composed of resistances with decreasing values and inductances with increasing values arranged in a ladder configuration has been proposed, as shown in Fig. 3, to model this phenomenon in transmission lines [8], [9].
In case of a direct current flow, the impedance of the ladder circuit is equal to all the resistances connected in parallel. When the frequency increases, the impedance of the external levels increases progressively until it becomes large compared to the impedance of the rest of the circuit. Hence, the impedance of the circuit increases with the frequency until reaching a plateau corresponding to the resistance 𝑅1 (Fig. 3.).
RM RM-1 R2 R1 L1 LM-2 LM-1
Fig. 3. Equivalent ladder circuit modelling the skin effect in transmission lines Even if the RL ladder model is well-known, as far as the authors are concerned, it has never been applied to overhead lines. The approach proposed here consists in integrating this circuit to replace the resistances of the cascaded quadripoles to model the skin effect.
In order to determine the resistive and inductive parameters of the ladder circuit, an optimization procedure has been developed. It aims to minimize the difference (equation (2)) between the real part of the impedance of the circuit (𝑍𝑅𝐿(𝑓)) and the analytical expression of the resistance of a quadripole with skin effect (𝑅𝐴𝐶(𝑓)). The expression of 𝑅𝐴𝐶(𝑓) is obtained thanks to the conventional calculation methods of the resistance taking into account the skin effect for a cylindrical conductor characterised by a radius, a conductivity and a permeability, and using Bessel functions of first kind [10].
𝑒𝑟𝑟𝑜𝑟 = ∑ (𝑅𝑒(𝑍𝑅𝐿(𝑓)) − 𝑅𝐴𝐶(𝑓) 𝑅𝐴𝐶(𝑓) ) 2 𝑓𝑚𝑎𝑥 𝑓=0 (2) Some constraints are added to the optimisation procedure in order to obtain a small imaginary part compared to the quadripole inductance and an accurate model at the fundamental frequency. The number of cells in the ladder circuit depends on the frequency range considered, on the contact line radius and on the target accuracy. The skin effect impacts the overhead line resistance from some hundreds of Hertz. A higher number of levels in the ladder circuit is required to obtain an accurate model up to some kHz.
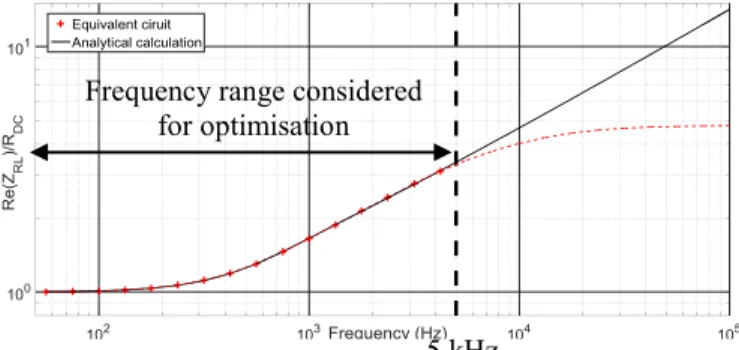
For a contact line radius of 5.8 mm, a 5-resistance 4-inductance ladder circuit (Fig. 5) has been selected to model the resistance of a 1-km-length quadripole with skin effect for a frequency range from 0 to 5 kHz. Its parameters are presented in Table I. In Fig. 4, the real part of the impedance 𝑍𝑅𝐿(𝑓) is compared to the analytical calculation of the quadripole resistance with skin effect, 𝑅𝐴𝐶(𝑓). The proposed approach can be used as well to model the skin and the proximity effects in the sub-station transformer.
Fig. 4. Ratio between the real part of the impedance of the 5-level ladder circuit and the resistance in DC
5 kHz Frequency range considered
R5 L1 L3 L4 L2 R3 R4 R2 R1 L C/2 R(f) C/2
Fig. 5. Quadripole with a 5-level ladder circuit modelling the skin effect TABLE I. PARAMETERS OF THE 5-LEVEL LADDER CIRCUIT
Resistances Inductances 𝑅1= 12 𝛺 𝐿1= 2,2 µ𝐻 𝑅2= 1,3 𝛺 𝐿2= 21 µ𝐻 𝑅3= 0,76 𝛺 𝐿3= 36 µ𝐻 𝑅4= 0,57 𝛺 𝐿4= 92 µ𝐻 𝑅5= 58 𝑚𝛺
IV. STATE SPACE REPRESENTATION
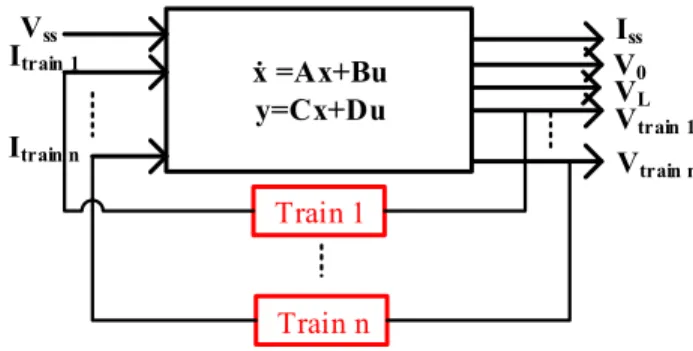
A novel approach is proposed in this section allowing to take into account several trains on the same sector. The state space representation of all the fixed installations, using the cascaded-quadripoles theory integrating the ladder circuit modelling the skin effect, is calculated. For this state space representation (see Fig. 6), the vectors are defined as following:
The inputs 𝑢 are the transformer voltage 𝑉𝑠𝑠 and the train currents 𝐼𝑡𝑟𝑎𝑖𝑛𝑠.
The outputs 𝑦 are the sub-station current 𝐼𝑠𝑠 , the overhead line voltages at the train terminals 𝑉𝑡𝑟𝑎𝑖𝑛 and the sector extremity voltages 𝑉0 and 𝑉𝐿 (for a section without junctions). Other voltages or currents can be considered easily as output: substation voltage, currents at various points of the network…
The states 𝑥 correspond to the voltages at the terminals of the capacitances and to the currents in the inductances of the quadripoles.
Generally, such a state space representation counts hundreds of state variables. Hence, a method has been developed to calculate the state space representation automatically. The matrix of the transfer functions is determined. Each component models the influence of a specific input on an output.
ẋ =Ax+Bu y=Cx+Du Train 1 Train n Itrain 1 Itrain n Vss Iss V0 VL Vtrain 1 Vtrain n
Fig. 6. State-space diagram of the traction chain and the infrastructure
L0 x0 Sub-station Train B Train A 0 2 1
Fig. 7. Line sector with a junction
Two Simulink models of a sector with one train running on it have been compared. The first model is composed by electrical components from Matlab toolbox SimPowerSystems. The infrastructure is modelled using Π -sections and RL ladder circuit; the train is modelled by a multiwinding transformer, ideal switches, capacitors and current sources. The second model includes the state space representation of the infrastructure. The train is modelled by the transfer functions and the switching functions of the converter (as developed in section V.C.1). With the same configurations of the simulator, simulations on the first model are seven times longer than ones on the second model, including the calculation of the state space representation of the infrastructure. Then, the simulation time is highly reduced using the state space representation regarding a simulation where all sectors are modelled by equivalent circuits. Thanks to this method, a line sector with several trains can be studied. The interactions between trains can be analysed directly using the transfer functions. In addition, when the state space representation is obtained from the electrical diagram, particular sections with sub-station filters or junctions may be studied easily.
V. SIMULATION RESULTS
An accurate model of the network is necessary to estimate with precision the impedance of the infrastructure seen by a train. Hence, models have been developed in the environment Matlab-Simulink, illustrating the theory presented previously. A. Skin effect modelling in a line sector with a junction
From the theory presented previously, a line sector with a junction and two branches at the right of the sub-station (Fig. 7) has been studied. Using the toolbox SimPowerSystems in Matlab-Simulink, a model has been proposed. The parameters used are given in Table II [1]. The railway line is divided in 1 km-long quadripoles associated in cascade. Each section is modelled by a quadripole in Π which resistive part is modelled by the ladder circuit presented in section III (Fig. 5).
TABLE II. PARAMETERS OF THE SECTOR [1]
Lengths of line sections (Fig. 7)
Overhead line per-unit-length parameters Sub-station parameters 𝐿0= 40 𝑘𝑚 𝑥0= 20 𝑘𝑚 𝑟 = 0,13 𝛺/𝑘𝑚 𝑅𝑠𝑠= 1,17 𝛺 𝐿1= 45 𝑘𝑚 𝑥 = 10 𝑘𝑚 𝑙 = 1,5 𝑚𝐻/𝑘𝑚 𝐿𝑠𝑠= 21,2 𝑚𝐻 𝐿2= 20 𝑘𝑚 𝑦 = 5 𝑘𝑚 𝑐 = 11 𝑛𝐹/𝑘𝑚 𝑉𝑠𝑠= 27,5 𝑘𝑉
Fig. 8. Total impedance seen by train A
Fig. 8 compares the total impedance seen by a train running on the upper branch of the sector (train A) obtained with the model integrating the skin effect to the one obtained without skin effect. This impedance corresponds to the transfer function between the current of train A and the voltage at its terminals. One can see that this impedance presents resonances at some characteristic frequencies. Harmonics generated by the input rectifiers at the resonant frequencies would be highly amplified by the infrastructure. Besides, the skin effect has a significant impact on the amplitude of the resonances which increases with frequency. It results in an attenuation of the resonances observed in the total impedance of the infrastructure. Moreover, more the frequency increases, more the attenuation is important. For example, at 3.7 kHz, the resonance is five times smaller for the model with skin effect than for the model without.
The line impedance has then been drawn in Fig. 9 for a train running on the upper branch of the sector. One can see that, after the first resonance, the impedance varies in function of the train position on the sector. A similar study has been carried out for different lengths and topologies of the sector. The results showed a dependence of the position of the resonances on the infrastructure topology.
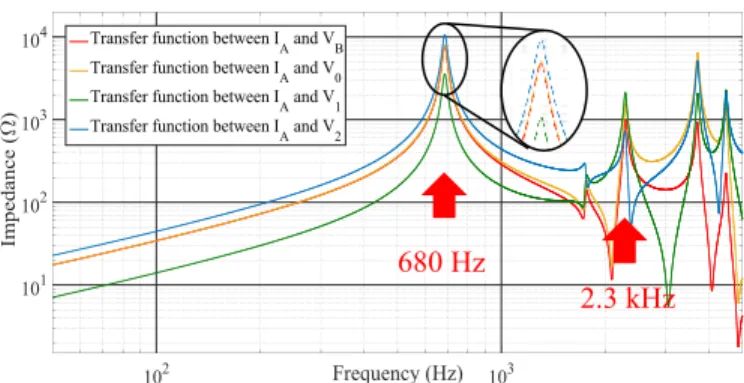
B. State space representation of the 25 kV-50 Hz supply The state space representation of the railway line has then been calculated for two trains running on both branches of the sector (Fig. 7). Each sector has been modelled with 1-km-long quadripoles and 5-level ladder circuits modelling the skin effect in the quadripole resistance. The state space representation counts 640 state variables. Fig. 10 shows the transfer functions from the current of train A 𝐼𝐴 to the voltage of train B 𝑉𝐵 and in the extremities 𝑉0, 𝑉1 and 𝑉2.
Fig. 9. Impedance seen by train A moving on the sector
Fig. 10. Example of transfer functions
One can notice that, as for the infrastructure impedance, for frequencies higher than the first resonance, the transfer functions varies with the position of the trains. The influence of harmonics generated by train A on the overhead line voltage at the terminals of train B and in the extremities of the line can thus be analysed.
For example, current harmonics generated by train A at the first resonance of the infrastructure impedance (680 Hz) would be amplified in the overhead line by an impedance of 7 kΩ in train B and by an impedance between 3.6 and 11 kΩ in the extremities of the line. This could result in a high overvoltage at the terminals of other trains running on the line sector. Indeed, a harmonic of only 1 A in the current of train A can induce an overvoltage of 7 kV at train B terminals. In some cases, the resulting voltage waveform could then not be compliant with the EN 50388 standard. In addition, for some resonant frequencies, the amplification is lower at the terminals of the train generating the harmonics than in other points of the network. Indeed, comparing Fig. 10 to Fig. 9, one sees that current harmonics at 2.3 kHz generated by train A would cause higher voltage harmonics for train B than for train A it-self.
C. Locomotive-infrastructure interactions
The interactions between an on-board input converter and the infrastructure have then been studied for two trains running on the two branches of this specific overhead line sector which parameters are given in Table II.
Braking resistor DC bus Traction motor 5-w in di ng tr an sf or m er Pantograph auxiliary Active rectifier
Fig. 11. Diagram of a 4-active-rectifier input converter (only one rectifier drawn)
680 Hz
Fig. 12. Voltages and harmonics at one secondary (left) and at the primary (right) of the transformer
1) 4-active-front-end-rectifier converter
The 4 MW on-board converter considered is presented in Fig. 11 [1]. It uses a 5-winding step-down transformer. The primary is connected to the 25 kV-50 Hz overhead line and the secondary windings deliver an AC voltage around 1 kV to supply four active front end rectifiers. The rectifiers, controlled by phase-shifted pulse width modulation (PS-PWM), supply DC links with a voltage 𝑉𝐷𝐶 around 2 kV. The DC links are connected to three-phase inverters supplying the traction motors or the auxiliaries.
The switching frequency of the active front end rectifiers 𝑓𝑠𝑤 is fixed at 450 Hz. Despite the fact that PWM techniques allow to cancel low order harmonics, high frequency harmonics are generated. Indeed, at the terminals of every rectifier, the high frequency spectrum components are centred around the multiples of twice the switching frequency, 900 Hz (Fig. 12 (left)) [1],[11]. For 𝑛 rectifiers, the total voltage harmonic distortion at the transformer primary is reduced by shifting the carriers by 2𝑛𝑓1
𝑠𝑤. The voltage reported at the primary presents
2𝑛 + 1 levels, (9 levels for a 4-rectifier converter). The harmonics, injected into the overhead line, are thus centred around frequencies multiple of 2𝑛𝑓𝑠𝑤, that is 3.6 kHz (Fig. 12 (right)).
For the study of the harmonic interactions between the input rectifier and the infrastructure, a model of the converter has been developed using Matlab-Simulink (Fig. 13, Fig. 14).
Vp Vs Is,1 V1 Iload,1 C1 Lf R f kt Active rectifier DC bus 5-winding transformer
Fig. 13. Electrical diagram of the 4-active-front-end rectifiers
t
k
1
-+
Vp V1 f fs R L 1 tk
1
Ip X s C1 1 X Vs S1,1-S2,1 S1,1-S2,1 Is,1-+
X s C4 1 X S1,4-S2,4 S1,4-S2,4 Is,4 V4 Iload,1 Iload,4+
+
+
+
-f fs R L 1Fig. 14. Diagram of the 4-active rectifiers using transfer functions
For each traction chain, the three-phase inverter and the traction motor are modelled by a constant current source 𝐼𝑙𝑜𝑎𝑑,𝑖. The AC voltages at the terminals of the rectifiers 𝑉𝐴𝐶 are calculated from the switching functions of the rectifiers 𝑆𝑖,𝑗. Then, at the primary side of the transformer, voltage and current, respectively noted 𝑉𝑝 and 𝐼𝑝, are reported thanks to an equivalent diagram of the multi-winding transformer developed in [12]. Due to the lack of data, this model takes into account only the total resistance 𝑅𝑓 and the total leakage inductance 𝐿𝑓 of the windings of the transformer reported to the secondaries. The capacitive and frequency effects (skin and proximity effects) are not modelled. In principle, their impact on the amplitudes of the harmonics could be not negligible.
2) Harmonic interactions
To study the interactions between the input converter with 4 rectifiers and the infrastructure, two trains (A and B) running on the two branches of the studied sector (Fig. 7, Table II), have been modelled using the theory presented previously. The state space representation of the fixed installations and the model of the two locomotives with 4 active front end rectifiers controlled by PS-PWM have been used. The outputs are the voltages at the terminals of the trains and at the extremities of the line. From the state space representation, the total impedance seen by both trains has been determined. Fig. 15 shows the norm of both impedances in function of the frequency.
Fig. 15. Transfer functions between the currents of the trains and the voltage in the extremity 1 of the sector
Fig. 16. Line voltages at the extremity 1 of the line generated by a train at the position of train A and at the position of train B
For train A, the frequency of the first bloc of harmonics obtained with the 4-rectifier converter, 3.6 kHz, corresponds to a 1.9 kΩ-resonance. However, for train B, the amplitude at 3.6 kHz, is only equal to 120 Ω, that is 16 times less than the one of train A. The result is an amplification of the harmonics around 3.6 kHz which is much higher when generated by the on-board converter of train A than when generated by the converter of train B (Fig. 16, Fig. 17).
The state space representation has been used to model the system composed of the fixed installations and the rolling stock. Simulations have been made in the time domain in the environment Matlab-simulink. The voltages in the extremity 1 of the line obtained with the 4-active-front-end-rectifier converter in train A and in train B on the sector (Fig. 7) are shown on Fig. 16. One can note that voltage perturbations are higher for train A than for train B. By analysing the frequency spectra (Fig. 17), one can see the harmonic bloc corresponding to the spectrum components generated by the on-board input converter around 3.6 kHz.
VI. CONCLUSIONS
A method to model the 25 kV-50 Hz railway supply has been presented to study the interactions between the supply system and the locomotives. A ladder circuit, composed of resistances and inductances has been proposed to model the skin effect in the overhead line resistance for time domain simulations. Its parameters have been optimised in function of the number of ladder levels and of the frequency range. Using this circuit and the MTL theory, a study of the infrastructure impedance has been carried out in Matlab-Simulink. The presence of resonances at some characteristic frequencies, highly dependent on the topology of the network and on the position of the train has thus been highlighted. If an input rectifier injects current harmonics in the overhead line at these frequencies, it can induce high voltage disturbances because of the resonances which can be harmful either for the rail signalling system or for other trains on the same sector. An analysis based on state space representations and transfer functions has then been developed to study the interactions between several trains on the same line sector. From this approach, the harmonic interactions between a 4-active-rectifer on-board converter and the fixed installations have been studied.
Fig. 17. Voltage spectra at the extremity 1 of the sector generated by both trains VII. OUTLOOK
For frequencies beyond 1 kHz, the skin and proximity effects in the sub-station transformer could not be negligible and would highly impact the impedance seen by the trains and the transfer functions between the trains. Thus, the ladder circuit presented in this paper could be re-used to model these phenomena. However, new topologies for input rectifiers based on solid state transformers generate current harmonics in a higher frequency range. As a consequence, the models for the sub-station transformer and the overhead line have to be extended to some tens of kHz.
VIII. REFERENCES
[1] J. Suarez, “Etude et modélisation des intéractions électriques entre les engins et les installations fixes de traction électrique 25 kv-50 Hz,” GEET-INP Toulouse, 2014.
[2] D. Dujic, F. Kieferndorf, F. Canales, and U. Drofenik, “Power electronic traction transformer technology,” in Power Electronics and Motion Control Conference (IPEMC), 2012 7th International, 2012, vol. 1, pp. 636–642. [3] N. Evans, T. Lagier, and A. Pereira, “A preliminary loss comparison of solid-state transformer technology in rail application employing Silicon Carbide (SiC) MOSFET switches,” in PEMD Glasgow, 2016.
[4] D. Frugier and P. Ladoux, “Voltage disturbances on 25kV-50 Hz railway lines - Modelling method and analysis,” in Power Electronics Electrical Drives Automation and Motion (SPEEDAM), 2010 International Symposium on, 2010, pp. 1080–1085.
[5] EN 50388 standard. Railway Applications. Power supply and rolling stock. Technical criteria for the coordination between power supply (substation) and rolling stock to achieve interoperability, 2012.
[6] P. Ferrari and P. Pozzobon, “Railway lines models for impedance evaluation,” in Harmonics and Quality of Power Proceedings, 1998. Proceedings. 8th International Conference On, 1998, vol. 2, pp. 641–646. [7] J. Holtz and H. J. Klein, “The propagation of harmonic currents generated by inverter-fed locomotives in the distributed overhead supply system,” IEEE Transactions on Power Electronics, vol. 4, no. 2, pp. 168–174, Apr. 1989. [8] B. K. Sen and R. L. Wheeler, “Skin effects models for transmission line structures using generic SPICE circuit simulators,” in Electrical Performance of Electronic Packaging. IEEE 7th Topical Meeting on, 1998, pp. 128–131. [9] C.-S. Yen, Z. Fazarinc, and R. L. Wheeler, “Time-domain skin-effect model for transient analysis of lossy transmission lines,” Proceedings of the IEEE, vol. 70, no. 7, pp. 750–757, Jul. 1982.
[10] M. Magdowski, S. Kochetov, and M. Leone, “Modeling the skin effect in the time domain for the simulation of circuit interconnects,” in Electromagnetic Compatibility - EMC Europe, International Symposium on, 2008, pp.1–6. [11] T. L. D. Holmes, Pulse Width Modulation for power converters - Principles and practice. John Wiley & Sons, 2003.
[12] Z. Yang, S. Li, W. Nan, and X. Zha, “High frequency harmonic analysis and suppression of converters paralleled by multiwinding transformer,” in 2014 International Power Electronics and Application Conference and Exposition, 2014, pp. 1303–1309.