COMPUTER PROCESSING OF STEREO IMAGES FOR THE
AUTOMATIC EXTRACTION OF RANGE
by
JEROME BARRY LERMAN
SUBMITTED IN PARTIAL FULFILLMENT OF THE REQUIREMENTS FOR THE DEGREES OF
BACHELOR OF SCIENCE AND
MASTER OF SCIENCE at the
MASSACHUSETTS INSTITUTE OF TECHNOLOGY June, 1970
Signature of Author
Certified by
Accepted by
Signature redacted
D f rtment of Electricalt gineering, May 21, 1970
Signature redacted
I'hesis
SupervisgSignature redacted
Chairlnan, iabe.iptl ta Committee on Graduate Students
ikrhives
gNSS.INST.
tEcH
-COMPUTER PROCESSING OF STEREO IMAGES FOR THE
AUTOMATIC EXTRACTION OF RANGE
by
JEROME BARRY LERMAN
Submitted to the Department of Electrical Engineering on May 21, 1970 in partial fulfillment of the requirements for the degrees of Bachelor of Science and Master of Science
ABSTRACT
A technique has been developed to generate a three-dimensional disparity space from a pair of two-dimensional stereo images of a scene. The disparity space will contain surfaces that correspond to the surfaces of objects in the viewed scene. Spurious surfaces that do not represent real objects may also be present and must be eliminated. Using computer-generated random patterns, the prop-erties of disparity space are examined. The problems caused by occluding objects and regions of uniform brightness are discussed. Based on these observations, a computer program is presented that will produce a range map of a natural scene from a pair of stereo images.
THESIS SUPERVISOR: Adolfo Guzman-Arenas
TITLE: Assistant Professor of Electrical Engineering I
ACKNOWLEDGMENT
The work described in this thesis was sponsored by the Bioscience Programs of NASA's Office of Space Science and Applications as DSR Project 55-25700, and performed at the M.I.T. Draper Laboratory.
Special thanks go to Louis Sutro, the project supervisor, for his encour-agement and enthusiasm, and to Adolfo Guzman for his many helpful sug-gestions. My sincere thanks to Catherine Griffin who typed the thesis.
*Contract NSR 22-009-138.
This report was prepared under DSR Project 55-25700, sponsored by the National Aeronautics and Space Administration Headquarters, Office of Space Science and Application, through Contract NSR-22-009-138 with the Massachusetts Institute of Technology.
The publication of this thesis does not constitute approval by the Charles Stark Draper Laboratory or the National Aeronautics and Space Administration of the findings or the conclusions contained therein. It is published only for the exchange and stimulation of ideas.
TABLE OF CONTENTS
Chapter
1. Introduction to Depth Perception 1. 1 Depth Cues . . . . .
1. 2 Selecting Depth Cues for a Computer Algorithm 1. 3 Retinal Disparity
2. Disparity Space. . . .
2.1 A Remapping of Visual Space. 2. 2 Generating a Disparity Space . 2. 3 Viewpoint of the Disparity Space
2. 4 STEREO - A Computer Program to Generate a Disparity Space .
3. Random-dot Stereo Images
3. 1 Images of Plane Surfaces 3. 2 Ambiguities due to Occlusion.
3. 3 STROUT - A Simple Program to Extract Range. 3. 4 Random-dot Images of Arbitrary Objects
4. Images with Regions of Uniform Brightness 4. 1 Parallelograms of Matches 4. 2 Ambiguities Due to Occlusion
4. 3 EXPER - A Program to Extract Range
4. 4 FUSER - A Program that Implements Shadow-Checking . 5. Stereo Images of Natural Scenes
5.1 Noise . . . . 5. 1 Registration of the Images 5. 3 Range Maps for Real Images . 6. Conclusions and Suggestions
References Appendix A Appendix B Appendix C
The Relationship of Range to Disparity A Limit on the Resolution of Range Listings of Computer Programs
CHAPTER
1
INTRODUCTION
The ability to perceive the world as three-dimensional is a talent developed by man's precursors to cope with the rigors of arboreal existence .1 Evolution flat-tened our snouts and moved our eyes from the sides to the front of our heads. From this position, they share similar but slightly different views of the same scene. Such
an arrangement is called a stereo imaging system.
Onto the retina of each eye is projected a two-dimensional representation of the scene being observed. Using these two retinal images, our brains can construct the impression of solid objects lying in three-dimensional space. The image thus perceived is:
(a) A single three-dimensional image (b) In front of the observer
(c) Right side up (i. e. not upside down) In contrast, the images on the retina are:
(a) Two, two-dimensional images (b) In back of the eye
(c) Upside down
Reference 2 gives a detailed explanation of depth perception. 1. 1 Depth Cues
The properties of the images that are useful for deducing depth are called depth cues. The most important are listed below:(3)
(1) Interposition - an object that occludes part of another object is seen as nearer.
(2) Relative size - the larger of two similar objects is seen as nearer. (3) Relative height - the lower of two objects is seen as nearer.
-
---(5) Linear perspective - the greater the convergence of lines, the greater the impression of distance.
(6) Light and shadow - shadow patterns favor the impression of depth. (7) Accommodation - the muscular tension on the lenses of the eye needed
to bring an object into focus is a function of distance.
(8) Movement parallax - near objects tend to move faster than far objects. (9) Convergence - the angle between the optical axes of the two eyes
de-creases as the fixated object becomes more distant.
(10) Retinal disparity - the amount an object is shifted when comparing the views of both eyes is a function of distance.
Cues 1-8 are monocular since they require only one eye. Cues 9-10 are bin-ocular cues that rely on the interaction of two eyes. An important distinction among the various depth cues may be made on the basis of complexity. The first six cues operate on recognized objects. In order for interposition to be effective, for
ex-ample, the observer must be able to recognize that some portion of a familiar object is being blocked. Object recognition is a high level process that draws on past ex-perience with the world. Cues of this type are called content-dependent since they must interpret the content of the image.*
Cues 7-10, on the other hand, are content-independent. They require no in-formation about the content of the scene, only a pattern of brightness. No organiza-tion of objects is necessary. To decide whether an image is in focus does not de-mand the recognition of objects in the scene. Retinal disparity has recently been
shown to be content-independent for highly textured images such as random dot
pat-terns.(4)
1. 2 Selecting Depth Cues for a Computer Algorithm
It is the goal of this thesis to develop a content-independent algorithm for ex-tracting depth information from images that are obtained through two-dimensional
sensors such as a photograph or a TV camera. Throughout the rest of this paper, the word "image" will refer to a two-dimensional array of numbers obtained by
sam-pling and quantizing a continuous image. Such an array is suitable for computer processing.
By choosing content-independent cues the difficult problem of object
recogni-*It is of interest to note that the decomposition of a visual scene into the constituent objects is possible, without having previous knowledge or familiarity with these objects. "SEE" is a computer program (Guzman, 1968) that does this decomposi-tion for scenes containing polyhedra (objects with flat faces).
a-w
P
W
zz
LENSES
ddL
dR
LEFT V IEW
RIGHT VIEW
III
Fig. 1 Stereo camera configuration with parallel
optical
axes, f = focal lengthof
thelenses.
a = interocular distance.nition may be avoided. Of the cues available, we must eliminate motion parallax since we are constrained to a static "snapshot" type imaging system. Accommodation and convergence are useful for determining the range of a single fixated object,* but do not account for the depth perception of an entire scene. Retinal disparity is capable of indicating the spatial arrangement of many objects. It has been suggested that accommodation and convergence provide a plane of reference for the information obtained through retinal disparity.(5) For this reason, throughout this paper we will assume that the convergence of the stereo system is known and the images are in focus. Retinal disparity will be the only cue utilized by the algorithm to determine depth. A camera configuration such as in Fig. 1 will be used to obtain stereo images. 1. 3 Retinal Disparity
Two cameras (or eyes) that view the same scene from slightly different lo-cations will produce similar images. In Fig. 2, points within the shaded region of space may appear in both views. Their positions in the two images will be different. This difference is known as retinal disparity.
To investigate retinal disparity, we must define some terms. A point in one view will be the "true match" of a point in the other view if they are images of the
same point in space. The "locus of possible matches" is the projection in one view of all the points in space whose image is a given point in the other view. In other words, the locus of possible matches is the path of points that must be searched to find the true match for a given point in the other view. For each point in one view, there is a locus of possible matches in the other view.
For a stereo system with flat image planes, the loci of possible matches are always straight line segments that intersect at some point in the image plane. In particular, for a camera system whose optical axes are parallel (as in Fig.1), the loci of possible matches will be parallel horizontal line segments.(6) By horizontal, we mean parallel to the plane of the optical axes. Thus, for such a system, an ob-ject in the left view will be shifted laterally in the right view by an amount that de-pends on its distance from the camera (its range). We are assuming identical cam-era systems. In particular, the magnification of the left image must be the same as the right image. If all the above conditions are met, there can never be any vertical shifting of objects from one view to another.
If we restrict our study to stereo systems with parallel axes, the computa-tional task will be simplified. For digital images stored line by line, the locus of possible matches of a point in one view will lie somewhere along the same line of the
* B.K. P. Horn has developed a computer program (M.I.T. thesis, 1970) that uses focussing to obtain depth information.
- _
(
Fig. 2 The shaded region of space will be viewed by both cameras.
LENSES
y
YO
Xr
I
LEFT
VIEW
RIGHT VIEW
Fig. 3 For a point (xt, yo) in the left view of a stereo pair, the locus of possible matches in the right view is shown as a solid line.
I
YO
other image. Thus, to search for matches, only one line of each image must be stored in the computer at any time. For a system where the optical axes converge at some finite point, several lines of the image would have to reside in computer memory and the slope of the locus of possible matches would be a function of position in the frame. If images obtained from a converged stereo system could be trans-formed so that the loci of possible matches become horizontal lines, then the algo-rithm to be described in subsequent chapters would be effective. This transformation is possible and known.!7 Thus, for the rest of this dissertation, all stereo systems will be assumed to have parallel optical axes.
In Appendix A, the relationship between the range, z, of a point in space and its retinal disparity, d, was found to be:
K
z=
(1)
where K is a constant that depends on the camera configuration. According to equa-tion (1), a point infinitely far from the camera will have zero disparity, i. e. it will appear at the same coordinates in both views. As the point moves nearer, its dis-parity will increase. If a point in space a distance z0 from the plane of the camera
lenses casts an image at (xt, yo) in the left view, by equation (1), its image in the right view will be at x - , yo).
A procedure for finding the range of a point at (x y 0)in the left view is as
follows (See Fig. 3):
(1) Find the position (xt,. yO) in the right view.
(2) Look to the left along the horizontal line through (x 3 ,o) for
a true match.
(3) If a true match is encountered at (xr' YO), measure the disparity (d = xt - xr) and compute the range by equation (1).
The most difficult step in the process described above is locating a "true match." The only information directly available from the image are the quantized numbers representing the brightness. If an attempt is made to find true matches by
searching for points with the same brightness, it is very likely that several matches will be discovered. By arranging these brightness matches at the position in space that their disparities imply, we would expect true matches to form surfaces, while spurious matches will tend to form isolated clusters. A method for accomplishing this is described in the next chapter.
CHAPTER 2
DISPARITY SPACE
The purpose of this section is to describe the theory and use of a three-dimensional space that is easily generated from a pair of stereo images. Called dis-parity space, or d-space, it will contain a mapping of the objects viewed by both
cameras. Many of the techniques discussed in this section were first presented by Julesz in a paper on automatic depth perception. (8)
2. 1 A Remapping of Visual Space
The area of space viewed by both cameras (shaded region in Fig. 2) will be called the visual space. The surfaces in this space can be described as a functionof three variables, e. g. for Cartesian coordinates:
Sv = f (x, y, z) (2)
If we substitute for the range variable, z, according to equation (1), a new mapping of space is obtained.
Sd
= g (x, y, d) (3)In this new space, called disparity space (d-space), any straight line that is a func-tion of z will be mapped into a hyperbola. Since the transformation is conformal, we will expect continuous surfaces in visual space to be mapped into continuous
sur-faces in d-space. Fig. 4 shows a plan view of a visual space containing a slanted plane. The plane's mapping into d-space is shown for several different viewing dis-tances. As the plane becomes more distant, its mapping in d-space becomes more
flattened. This means that for distant objects, small variations in range will not be easily detected. (See Appendix B for a further discussion of range resolution.) 2. 2 Generating a Disparity Space
In Section 1. 3, the difficulties in identifying a true match by comparing brightness were discussed. If points with matching brightnesses were arranged in a d-space, the true matches would form continuous surfaces, and might be distin-guished from spurious matches. It is necessary then to obtain matches as a function
d
0.10 1
0.08
-0.06
1
0.04
-0.
02-I I I I I I 1 1 x +
12
PLANE IN VISUAL SPACE
(a)
x
0
U 0
DISPARITIES FOR A PLANE WITH SLOPE 1/2
(b)A plane in visual space that is slanted. The same plane represented in disparity space for three values of z .
T~< ~
z
0 +6
z
x
0
z
-
100
SI
I
I
I
I
I
1 0x
+
xx
x+ 12
Fig. 4 (a)(b)
i iz0
- 10
z0112
LEFT
20
7
15
10 32141 6 27
IMAGE 12
71 52 2
24115 61 73
1 1
0 0 0 011
1 1
0 0 0 0
1
1
0
RIGHT 20
7
13241171
2 6
2
7IMAGE 12
71
124
15
72
121
61
73
LEFT
20 7
15 10 3241 6 27]
IMAGE
1271152
2
24 15161
0
Di
0l 0 0 00RIGHT
20 7
13241
17 2
6
IMAGE 12 71
224151
61173
LEFT
20 7
151032 41
7
6 27
IMAGE 12
7115212 24
151
76
3
RIGHT
20J7
1321411171
2
J
6J127
IMAGE
121711 24115172 21161173
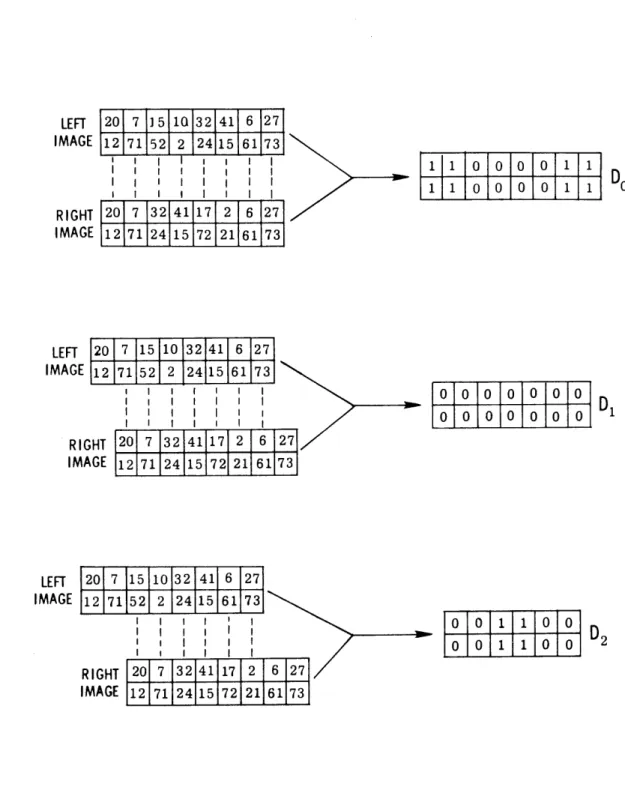
Fig. 5
Generation of the first three d-planes from a stereo
pair of two-line images
of disparity.
Since disparity corresponds to a lateral shift, the following method will mark all matches at a given disparity, n:
(1) The left and right images are superimposed.
(2) The right images is shifted n/2 picture elements (pixels) to the right and the left image is shifted n/2 pixels to the left.
(3) Elements that now overlap are compared. If their difference is less than a specified tolerance, they are considered a match and that position in the array is replaced by a "1". If they do not match, a "0" is inserted in the array.
By following this procedure, an array of
1's
andO's
called a disparity plane (d-plane) is formed. The d-plane for a disparity of n pixels is represented as Dn' Fig. 5 shows pictorially the generation of the first three d-planes for a two line image. Mathematically the process is described by:Dn (i,
j)
= 1 ifIL(i
-n/2,
j)-
R(i + n/2,j)
1 (4) 0 otherwiseD (i,
j)
= ith column,jth
row of d-plane at disparity of n unitsn .th .th
L (i,
j)
= entry ofleft
image array at i column,J
rowR (i,
j)
=entry of right image array at it column,
jt
row
E = tolerance of match (E is set to zero for computer-generated images) Dn (i, j) is not defined for i,
j
<0 or i,j
> frame size, e. g. 256 pixelsIf a sequence of d-planes, starting with D0, is generated and stacked one
upon the other as in Fig. 6a, the three-dimensional d-space we have been seeking will be produced. The position of
1's
(i. e. matches) is a function of x, y and d. From Section 2. 1, we know that surfaces in visual space will map into surfaces in d-space. Thus, if continuous surfaces of matches could be identified in the gener-ated d-space, the problem would be solved. The presence of spurious matches, however, causes some non-trivial problems that will be discussed in subsequentchapters.
The wedge-shaped nature of the d-space in Fig. 6a is caused by the shifting of one image past the other. For each shift, one less column will overlap, and therefore each successive d-plane will be one unit narrower than the plane that
pre-cedes it. It should be noted, however, that the visual space in Fig. 2 is roughly wedge-shaped also.
(a) D-planes aligned to create a d-space. The scene is mapped into this d-space
as if it were viewed three-dimensionally from a point midway between the two
cameras.
d
(c) D-planes aligned to create d-space that maps the scen as if it were viewed three-dimensionally from the righ camera's viewpoint.
Fig. 6
Do
D
(b) D-planes aligned to create a d-space that maps the scene as if it were viewed three-dimensionally from the left camera's viewpoint.
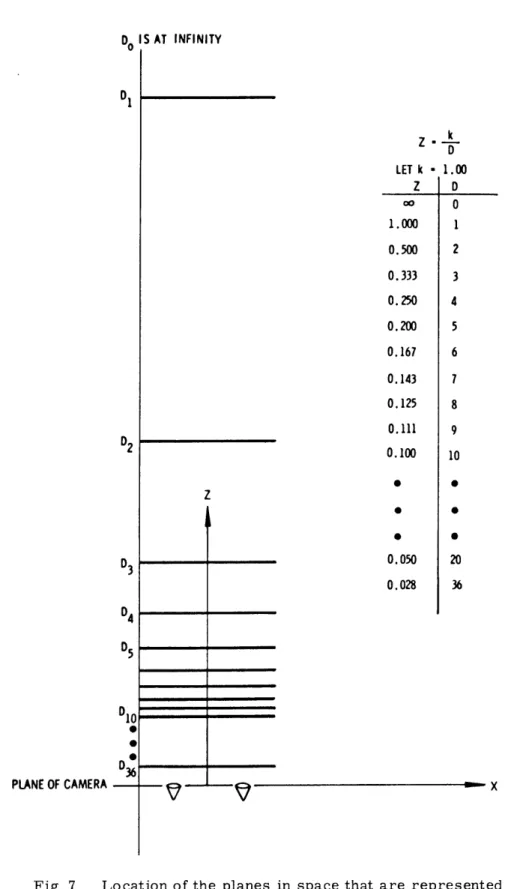
a
only integer values. The allowed values of range (by Eq. (1) will be z= K K , K 0 1 2 Fig. 7 shows the location of these ranges in visual space. The space nearest the viewer is most finely divided. The accuracy of the computed range will therefore be better for near objects. The resolution of range for distant objects will be poor. A point that lies between the planes in Fig. 7, will be "rounded off" into one of the ad-jacent planes. An analytical expression for range resolution is derived in Appendix B. 2. 3 Viewpoint of the Disparity Space
If an algorithm is developed that can produce the z coordinate for each posi-tion in the left or right view, we must decide which frame of reference to use - the left view, the right view, or something else.
By holding your finger before your eyes, fixating a far off point and alternately blinking each eye, you may convince yourself that the human frame of reference is not the left eye or the right eye but "something else'.' The position of your finger with both eyes opened, will usually lie midway between its positions when viewed by each eye alone. The effect of ocular dominance
(9
may complicate this observation for some people, but most human observers see the world as if viewed by a single three-dimensional sensor in the middle of their eyes. Since there is no reason tostress one eye over the other in a computer alogrithm, the inherent symmetry of this central viewpoint is appealing.
The algorithm described in Section 2. 2 produces a d-space that is referenced to the central viewpoint. In subsequent sections, it will be useful to have disparity
spaces that are referenced to the left or right viewpoint. These may be produced by stacking the d-planes differently. From Fig. 6a and Eq. (4), it can be seen that the d-planes have been stacked so that their centers are aligned. If the planes were
right-justified (as in Fig. 6b), the d-space would be referenced to the left view, since the right view is being shifted past. Similarly, if the d-planes where left justified (see Fig. 6c), the d-space would be referenced to the right view. 2. 4 STEREO - A Program to Generate Disparity Spaces
A computer program has been written that will produce a d-space when given a stereo pair of images as input. The input images are expected to be 256
X256
ar-rays stored on magnetic tape. Because of memory limitations, the output d-space contains only the first 36 d-planes. This is not a very serious constraint, since for the camera arrangement used, 0-36 units of disparity includes ranges from infinity up to 5' in front of the camera (See Appendix A). The width of the d-space is 128 columns, also due to memory limitations. In effect, the input images are treated as 128 X 256.A parameter, SCOL, determines which column of the input images will be the start of what is effectively a 128 column input image. LSHIFT, RSHIFT, LOFSET,
Do SAT
INFINITYD
Z -k LET k 1.00 Z D 00 0 1.000 1 0.500 2 0.333 3 0.250 4 0.200 5 0.167 6 0.143 7 0.125 8 0.111 9 2 0.100 10 * S z * 6D3
0.050
200.028
36 0405
D10 D36 PLANE OF CAMERA - XFig. 7 Location of the planes in space that are represented by integer values of disparity.
and ROFSET are parameters provided to allow for registration of the two images, EPS determines the tolerance of the match.
Since the locus of possible matches is a horizontal straight line, only one line of each image need be in the computer at one time. If the stereo system con-verged at some finite point, several lines of each image would have to be resident in the computer to produce one line of d-space (of Section 1. 3).
Switches are provided to determine which viewpoint the generated d-space will reference. See Appendix C for a program listing.
The program STEREO is used to generate all the d-spaces that are discussed in the following pages. It may be regarded as a basic building block for all the pro-cedures that are presented in this dissertation.
CHAPTER 3
RANDOM-DOT STEREO IMAGES
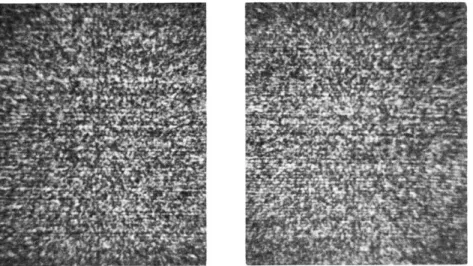
A pair of random-dot stereo images is shown in Fig. 8. generating such a stereo pair is well known.10,11) In this case, 256 X 256 arrays of randomly distributed numbers representing
*
When viewed through a stereoscope, Fig. 8 will appear to be a fore a background plane.
The method for the images are 64 shades of gray. square floating
be-Computer-generated random-dot patterns have several properties that make them a desirable beginning point.
(1) They are highly structure, with few spurious matches. (2) They are noise free.
(3) They cannot be mis-registered.
By studying these very artificial images, some insight into depth perception will be gained that will be useful in processing real images.
3. 1 Images of Plane Surfaces The images in Fig. 8 image 5 pixels to the right. This technique will produce plane in visual space that is
were created by shifting a 64 x 64 pixel region of one The uncovered region is filled with more random dots. a surface with a constant disparity, corresponding to a
perpendicular to the axes of the camera system. If a d-space were produced from the images in Fig. 8, we would expect to find a region of matches in D0 corresponding to the background and a region of matches in D5 corresponding to the square floating in space. All the other d-planes will contain scattered spurious matches. Fig. 9 shows a cross-sectional view of the generated d-space, i. e. a plane parallel to the x axis and the d axis. The detailed area in Fig. 6a represents a similar section of a d-space. Such sections are often
used to examine a disparity space since the entire three-dimensional structure is not easily displayed. Matches are represented as dots.
*A stereoscope suitable for viewing the stereo pairs in this thesis may be obtained from Air Photo Supply, Yonkers, New York.
Fig. 8 A random-dot stereo pair depicting a square floating before a background. (Image quality has been degraded by half-tone reproduction).
d--x
Fig. 9 A cross-section of the d-space generated from the stereo pair in Fig. 8.
df
(a)
(b)
Fig. 10 (a) A cross-section of d-space showing an occlusion ambiguity for w
>
(ds - db).(b) A cross-section of d-space showing an occlusion ambiguity for w < (ds - d b)
d
For images of planes perpendicular to the observer, the continuous surfaces of true matches will lie in the same d-planes, i. e. no surface will cut through several d-planes. Thus, a spurious match in a given-d-plane will not have very many neigh-boring matches in that d-plane, while a true match will be surrounded by other matches. By imposing this kind of test on the d-space, spurious matches can be eliminated.
3. 2 Ambiguities Due to Occlusion
If a section of the d-space of a scene containing a square floating before a background is examined carefully, a region with no continuous surface is observed on either side of the floating square. This region, seen in Fig. 10a, is termed am-biguous since no true match can be identified. It is caused by the fact that some parts of the background visible in one view will be hidden behind the floating square in the other view (See Fig. 29).
For a square W pixels wide at a distance corresponding to a disparity ds' floating before a background at a distance corresponding to a disparity db, there will be two different types of occlusion ambiguity:
Case I: W ! (d s- d b). A section of d-space for this case is shown in Fig.IOa. On either side of the nearer surface are regions of ambiguity that are (ds - db)/2
elements wide.
Case 2: W < (ds - d b). A section of d-space for this case is shown in Fig.10b. If a small object is far enough in front of the background, two separate regions of ambiguity will exist. Further difficulty arises since the viewer can see both the ob-ject and the region of space directly behind it. For such cases, the nearer surface will be chosen.
Tests on human observers have shown that "these regions of ambiguity are always perceived as being the continuation of the adjacent area that seems to be far-thest away." (12) Continuing the occluded surface is a reasonable procedure that
should be incorporated into a depth algorithm. In order to do this, we must first be able to decide which regions are ambiguous. From Fig. 10, any region that does not contain a continuous surface is ambiguous. This means that for a given value of x and y, if none of the points in the d-planes, then that region is ambiguous.
3. 3 STROUT - A Simple Program for Range Extraction
A program, STROUT, has been written that incorporates the techniques de-scribed in Sections 3. 1 and 3. 2. Input to STROUT is a d-space generated by STEREO (See Section 2. 4). Output will be an image array whose entries represent distance, not brightness. Such a range map may be displayed as an ordinary picture except that the brightness of points in the image will indicate range. Since there are 36
d-planes in the disparity space, there can be only 36 values of range, and hence only 36 shades of gray in the range map.
The operation of STROUT may be divided into two steps. First, continuous surfaces of matches are found and ambiguous regions are marked. All spurious matches should be rejected by this part of the program. In the second section, am-biguities that have been previously marked are resolved.
The first section of the program will only find continuous surfaces of matches that are contained in a d-plane, i. e. surfaces that correspond to planes in visual space. perpendicular to the observer. A more complex program (and a more gen-erally useful program) would search for arbitrary surfaces in the d-space (See Section 3. 4).
For each value of x and y in the d-space, the d-plane with the maximum number of matches in an N x N neighborhood centered at (x, y) is located (N is a program parameter). This value of disparity is associated with the point (x, y) and the range follows directly from Eq. (1). It is assumed that the point in d-space with the most neighbors is part of a surface of matches. Since spurious matches have
few neighbors, they will usually be rejected.
2LOWLIMV If the maximum number of matches at (x, y) does not exceed N x 100 where LOWLIM is a program parameter, the point is marked as ambiguous. If there are several d-planes with the same maximal number of matches, the program
arbitrarily chooses the nearest. For a robot doing a navigational task, it would be a good strategy to always pick the nearest of several possible choices. Further ex-amination of the scene may prove this guess incorrect, but at least no collision will have occurred. An improvement could conceivably be obtained by making our choice
in such a way that the resulting dimensional position is close to the three-dimensional position of neighboring points.
After the above steps have been completed, the regions marked as ambig-uous must be resolved. A routine, RESOLV, searches the incomplete range line by line to find marked regions. When one is encountered, the first non-ambiguous points to the left and right of the region are examined. Whichever point represents a surface farthest from the camera is chosen to replace the marked ambiguities. This completes the range map.
Fig. 11 is a stereo pair of a stick 64 pixels wide that slopes out toward the viewer. The top of the stick is farthest away. Fig. 12 is the range map computed by STROUT. The background is dark (far) while the stick gradually brightens to-ward the bottom of the image, implying that the bottom of the stick is nearest the observer (which is true). There is a slight amount of irregularity along the lateral edges of the stick due to chance variations. The edges of objects are most
suseep-Fig. 11 A random-dot stereo pair of a plane that slopes out toward the viewer.
Fig. 12 Range map produced by STROUT from the stereo pair in Fig. 11. In this image, bright-ness is proportional to range, e. g. dark re-gions are far, lighter rere-gions are nearer.
tible to errors by STROUT. For this image (Fig. 12), N= 3, LOWLIM = 50 (i. e. if less than 50% of the points in a neighborhood are matches, the region is marked as ambiguous.
3.4 Random Dot Images of Arbitrary Objects
Scenes composed of surfaces that are not planes pose additional problems. It should be possible to search the d-space for the "best" arrangement of continuous
surfaces. Because of the discrete nature of the d-space, the property of continuity may not be obvious.
Fig. 13 shows a section of d-space generated from a scene containing a plane surface that is skewed with respect to the cameras. From Fig. 4, we would expect such a surface in visual space to map into a hyperbola in d-space. Because of the discreteness of the input images and the d-space, the hyperbola is distorted by round. off error. If the surface in Fig. 13 were embedded in spurious matches, it would be difficult to detect as a "continuous" surface.
Unless round-off error is reduced by using images with more sample points (e. g. 1000 x 1000), recognizing skewed surfaces near the observer will be difficult. If we consider skewed surfaces far from the cameras, the hyperbola in d-space will be flattened (as in Fig. 4) and not as susceptible to this type of noise.
As of this time, no program has been written (by me) to correctly process arbitrarily shaped images. This failure is not as restricting as it appears, since a program such as STROUT will produce reasonable results with arbitrary scenes as input (See Section 6).
z
z, + 61/2
Z0 (b)X
x +12
X0 0PLANE IN VISUAL SPACE
(a)
Fig. 13 (a) Skewed plane in visual space.
(b) Cross-section of d-space that would be generated Due to discreteness, the expected hyperbola does not appear very continuous.
CHAPTER 4
IMAGES WITH REGIONS OF UNIFORM BRIGHTNESS
Scenes that contain surfaces of random dots are extremely rare in nature. In most natural scenes, the probability of finding a particular brightness at a given point in an image is conditional on the brightness of the surrounding points. It is not unusual for connected regions of points to have the same or very similar brightness.
In a random-dot image such as Fig. 8 or Fig. 11, regions of uniform brightness are very unlikely.
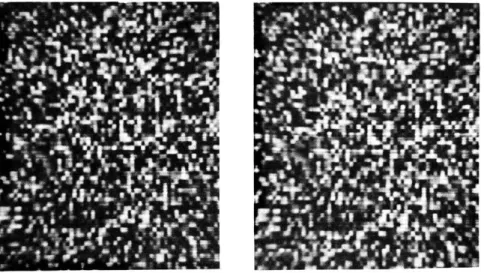
In order to move a step closer to real scenes, this chapter will consider images that contain regions of uniform brightness. An example of the type of images to be used is the stereo pair in Fig. 14. This stereo pair is similar to Fig. 8 except that it is composed of random blocks, not random dots. Each block is a 4 x 4 square of picture elements that are assigned the same brightness. When viewed
stereo-scopically, Fig. 14 depicts a square floating in front of a background (same scene as in Fig. 8).
4. 1 Parallelograms of Matches
Before examing the stereo pair in Fig.14, let us first imagine a single square of uniform brightness floating in front of a background of random dots. If a stereo pair of images of this scene were obtained, the program STEREO could use them to generate a d-space. In this disparity space, we would expect to find a surface of matches in the d-plane corresponding to the disparity of the background, and a square of matches in the d-plane corresponding to the disparity of the floating square. This will indeed be true, but there is more.
Fig. 15 is a cross-section of the d-space for the scene described above. In-stead of just a line of matches at the position of the square (as in Fig. 9), there is a parallelogram-shaped cluster of matches. This effect is caused by the uniform brightness of the square. If we imagine the two stereo pairs being shifted past one another, an increasing area of the uniform square will overlap until the two squares are exactly superimposed. After this, the region of overlap will decrease to zero with additional shifts. Since the square has uniform brightness, any sections that
Fig. 14 Random-block stereo pair depicting a square floating before a background.
d
x
Fig. 15 Cross-section of d-space generated from a scene containing a square of uniform brightness.
overlap will generate matches in the appropriate d-planes. In Fig. 16, this process is illustrated with a one-line image containing a uniform region. The expected par-allelogram of matches is seen in the generated d-space.
Since the area of match increases (or decreases) by one unit for each unit of shift, 1/2 unit must be added to (or subtracted from) each end of the line of matches in successive d-planes. This implies (and Fig. 16 verifies) that the slopes of the sides of the parallelogram must be t 1/2.:Thus,the cluster of matches is really rec-tangular but appears to be a parallelogram due to differences in the scale of the dis-play.
At this point, we have succeeded in locating the edges of the uniform region in space, but there is no information in the stereo pair that can be of help in deter-mining the exact spatial location of the interior points of the uniform region. Any surface of matches that lies within the parallelogram of matches may be the true sur-face. There is no texture on the viewed object to give a clue as to which surface to choose. Only at the edges of the uniform region where the parallelogram converges to a single match can a non-arbitrary choice be made.
For human observers, the outline of the region of uniform brightness may provide a suggestion of the three-dimensional shape of the object, e. g. a region with a circular outline might be seen as part of a sphere, while a region with a square outline might be considered a flat surface. These cues require object recognition and will therefore not be used.
A reasonable compromise, then, would be to assume that the parallelogram of matches represents some arbitrary surface in space. We have located in three dimensions the borders or boundary of the region, where is the rest of the surface located? Since information is lacking, we could assume it to be a "minimum energy" surface, obtained for instance by stretching a rubber sheet across the three-dimensional frame. If we do this for the example discussed above, we will obtain a plane.
In the output range map, these arbitrarily chosen surfaces could be marked to indicate their questionable nature. This first guess (and it was a guess) might then be modified by additional information from the scene. Viewing the object from a different position, or attempting to explore it with a feeler would provide the needed data.
If the surface of uniform brightness is not a plane perpendicular to the camera axes, then the parallelogram of matches will be skewed. For perpendicular surfaces, the surface of minimum energy (the diagonal of the parallelogram) will lie entirely within a single d-plane. For surfaces that are tilted with respect to the camera axes, the diagonal of the skewed parallelogram will cut through several d-planes.
Region of
Uniform Brightness
E 201 7 15 10 13213627
T 20 7 323217 2 6 27E
Region of
Uniform Brightness
20 7 15 10 32 32 6 27Do
20 7 3232
117
2 6 27
D,
D-SPACE
I
0
D
1
1 u I
0 0
1 1
10 10
2 1 10 732 32117 2 6 270
0 1
0 0
0 101 0 101
D3
20 7 15 10 32 32 6 27 20 7 32 32 17 2 6 27D4
207 15 110132 1321 6 1271 201 7 1321321171 2 16 127]Fig. 16 D-space for a pair of one-line stereo images containing a region of uniform brightness. A parallelogram of
1's
is observed in the d-space.LEFT
I MAG
RI GH
I MAG
[
11
1o
0lo
oT1
1
i _q%,Fig.17 shows a cross-section of d-space containing askewed parallelogramof matches. The program EXPER to be described in 4. 3 will produce a surface of minimum
energy only for non-skewed parallelograms. For skewed parallelograms, an approx-imation to a minimum energy surface is generated.
4. 2 Ambiguities Due to Occlusion
Lack of texture in a scene can make the resolution of occlusion ambiguities
difficult. The simple technique described in Section 3. 2 for random-dot images will no longer be effective.
Let us consider a scene in which a square of uniform brightness is floating in front of a background of a different uniform brightness. (If the two surfaces had the same brightness, they would be seen as one surface). In the d-space generated from this scene, we would expect to find two parallelograms of matches in positions corresponding to the disparities of the two surfaces. The presence of a nearer oc-cluding surface, however, will modify the parallelogram of the farther surface in an interesting way.
Occlusion implies that part of an object is blocked from view by another nearer object. If the occluded object were of uniform brightness, then part of its
parallelogram of matches must be missing since part of the uniform surface is hidden behind another object. As the two stereo images are shifted past each other, the blocked region will move 1/2 unit to the left (or right) in successive d-planes.* Figure 18 shows a cross-section of d-space generated from a scene in which an
occlusion occurs
in the left viewonly.
Figure 19 shows a cross-section of d-spacegenerated from a scene in which surfaces are occluded in both views. In this case, the parallelogram due to the occluding surface lies within the parallelogram
of
matches corresponding to the farther, occluded surface.
The gaps in the parallelograms caused by an occluding object may be regarded as "shadows" of an object. These shadows are projected by the occluding object along lines with a slope of +
1/2
and -1/2
both. Where the shadowof occlusion
intersects a parallelogramor
a surface of matches, there will be a region of ambiguity, i. e. no matches will be present. If we re-examine Fig.10, the notion of shadows ofocclusion
may be applied to textured surfaces also. In general, any non-transparent physicalobject
in space must cast shadows ofocclusion
in a generated d-space. Thisobserva-tion will prove useful in the next secobserva-tion for eliminating spurious surfaces of matches. A general algorithm for removing the effects of occlusion ambiguities might be implemented as
follows:
(1) In d-space, identify surfaces of matches corresponding to
objects
invis-(1 ual space.
... ... . ... ... ... ... ... ... ...... ... ... ... ...... ... ... ... -... ... ... .... . ... ... ... ... .. ... ... ... ... ..... ... .... ... ... ... ... ... ... ... ... ... ... ... ... ... .... ...
left view
'LA
x
... 1 11 1 1 1 1, ... ... ............. ......... ............... ... ... ... ... ... ...... ... ... ...... ... ......
...
... ... ... ... ... ... ... ... ... ... ... ... ... ... ... ... ... ...... :*" * ... , ... *right view
YO
(b)(a)
...
...
...
*1*1111* ... ...... ...1- 1- 11,11 11 ... * .... ...... ...... I ......... ... . ... ... ... ... ... ...... ... ... ... ...... ... ... ...... ... ... ............ ... ... ......... ....... I ... ... ... ...... ... ... ... ... ... ... ...... - - ... ...... ... ... I ...left view
...
...
...
...
...
...
...
...
...
...
...
...
I
...
.
-
...
I
...
I
...
...
I
*- -
...
...
...
... ... ... .. ... 7 ... ...... ... ... ...... ... ... -.-. VA .-.-.-.-.-.-. ... ... ... ... ... * ...... ... ... I .... ...... ... .... .. ...... '* ... ... ......... ...... ...... ...... ... ... ... ...... ... ... ... ...... ... ... .......... I ... I ... ... ......right view
YO
x
(b)
(a)
Fig. 17 Cross-section of d-space showing a skewed parallelogram of matches generated by a tilted plane in visual space.
Fig. 18 (a) Stereo pair of a scene containing occluded surfaces of uniform brightness in one view. (b) Cross-section of the generated d-space.
Fig. 19 (a) Stereo pair of a scene containing occluded surfaces of uniform brightness in both views. (b) Cross-section of the generated d-space.
(2) Examine the regions that are in the shadows of occlusion cast by each object - if a continuous surface or parallelogram of matches is cut by a shadow, re-connect the region with a smooth curve or fill in the parallelogram.
The method described above has not been incorporated into the programs to be described (although it certainly could be added). As a result, the program EXPER produces erroneous results when confronted with the situations in Figure 18 and Fig. 19. The disconnected parallelograms will be treated as separate surfaces, yielding an incorrect range map. With additional programming (not possible due to
a lack of time), these cases could be properly handled. 4. 3 EXPER - A Program to Extract Range
The program STROUT described in Section 3. 3 looked for clusters of matches in d-planes. If a given position had several clusters in different d-planes, the one implying the nearest surface was chosen. This procedure assumes that spurious matches will not occur in clusters. This a good assumption for random-dot images, but it will not be true for images with regions of uniform brightness.
Figure 20 is a section of the d-space generated from the stereo pair in Fig.14. Since the images contain squares of uniform brightness, it is not surprising to find many small parallelograms of matches. They are organized into two continuous sur-faces, one at a disparity corresponding to the background and the other at a disparity corresponding to the floating square. In addition, there are surfaces of matches re-sulting from spruious parallelograms scattered throughout the space. These spurious matches must be rejected.
If a small neighborhood is examined in each d-plane, as STROUT does, then incorrect choices will frequently be made by selecting the nearer of two possible surfaces. STROUT's performance could be improved by making the neighborhood size larger than size of the uniform regions (i. e. N > 4 for Fig. 14), but that kind of information about an image is not usually known. Also, as the neighborhood size in-creases, the resolution of the range map decreases.
A better strategy, then, would be to start by examining a small neighborhood. If several possible surfaces are encountered, the neighborhood size is increased until a single surface is found. In this way, the largest organization of matches will be chosen. Small spurious surfaces of matches will be rejected in favor of larger surfaces. This is the procedure used by the program EXPER (See Appendix C for a program listing). In all other aspects, EXPER is identical to STROUT. The type of occlusion ambiguities described in the previous section will not be properly proc-essed.
to-d
x
Fig. 20 Cross-section of d-space generated from the stereo pair in Fig. 14.
Fig. 21 Random-block stereo pair of a plane that slopes out toward the viewer.
ward the viewer. It is similar to Fig. 11, except that it is composed of squares of uniform brightness, not random dots. The brightness of each square is a random variable. Given the d-space generated from these images as input, EXPER will
pro-duce the range map in Fig.22 (N = 3, LOWLIM = 50). It is interesting to investigate the errors, shown as bright dots along the edge of the stick.
Figure 23 is a cross-section of the d-space generated from Fig. 21 at a value of y corresponding to one of the error points. If we examine the regions on either side of the near surface (the surface with a larger disparity), we would expect to find no surfaces of matches, since this is a region of ambiguity as described in Section 3. 2. On the left side, however, a spurious parallelogram of matches occurs in the ambiguous region. EXPER will choose this surface since there are no larger ones at that position, and it will erroneously appear in the output range map. Such problems did not occur in random-dot images, since spurious matches did not form surfaces. For images with regions of uniform brightness, it is possible to find sur-faces (actually parallelograms) of spurious matches. We know from Section 4. 2, however, that these spurious surfaces cannot be a real surface, since they do not cast shadows of occlusion. The next section will describe a program that takes this property into account, and properly eliminates surfaces that do not cast shadows of
occlusion.
4. 4 FUSER - A Program That Implements Shadow-Checking
As mentioned in Section 4. 2, any non-transparent physical object must cast shadows of occlusion in d-space. This property of surfaces of true matches will al-low surfaces of spurious matches, as shown in Fig.23, to be identified and rejected. By examining Fig. 23, we can see that the surfaces of matches that corrrespond to real objects do cast the required occlusion shadows, while the spurious parallelo-grams of matches do not. Thus, for every surface of matches in d-space, we must check along lines of + 1/2 slope and - 1/2 slope to test for the presence of occlusion shadows. This additional test for the validity of surfaces of matches is made nec-essary by the fact that images with regions of uniform brightness are likely to con-tain spurious surfaces of matches. For random-dot images, spurious surfaces of matches are unlikely enough to be ignored.
In order to reduce the effort involved in writting a program to check for oc-clusion shadows, an interesting property of d-space in conjunction with an existing program EXPER (See Section 4. 3) were utilized. The method to be described is not very efficient with respect to computer time, since it requires the formation of two disparity spaces from each stereo pair. A more straightforward method (but more difficult to program) would utilize a single disparity space. The purpose of writing this program is merely to demonstrate the effectiveness of occlusion shadow-checking in removing spurious surfaces of matches.
Fig. 22 Range map produced by EXPER from the stereo pair in Fig.21. Brighter points are nearer.
SPURIOUS SURFACE
di
x
Fig. 23 Cross-section of d-space gen-erated from the stereo pair in Fig. 21 showing spurious sur-faces that appear in range map.
In Section 2. 3, we discussed the different viewpoints that a d-space may reference. If the scene shown in Fig. 24 is viewed from the position of the left cam-era, the near object, S, appears directly in front of the ambiguous region, AL' This region is ambiguous because it is seen only by the right camera and hence will have no true match in d-space. Similarly, when the scene is viewed from the view-point of the right camera, the object
SI
appears directly in front of the ambiguous region AR. Thus, by generating d-spaces from the left viewpoint and the right view-point, occluding objects will be vertically aligned with one of their occlusion shadows. Figure 25 shows three cross-sections of the d-space generated from the scene in Fig. 24. The section of d-space in Fig. 25b is from the central viewpoint, and the occluding object does not align vertically with either of its occlusion shadows. In Fig. 25a and 25c, the occluding surface lies directly above one of its occlusion shad-ows. If EXPER were applied to the left viewpoint d-space (Fig. 25a) and the right viewpoint d-space (Fig. 25c), two range maps would be produced. Surfaces of matches that did not align with occlusion shadows would not be present. Surfaces that are present in both range maps therefore must have cast both the left (slope = +1/2) and the right (slope = -1/2) occlusion shadows. The purpose of the program, FUSER, is to transform the left viewpoint and right viewpoint range maps to the same point of reference, the center viewpoint, and compare them. If points at the same position in the two transformed range maps are seen at the same distance in space, then those points cast the required occlusion shadows and no change is made. If points at the same position are seen at different distances in the two range maps, then the point is marked as ambiguous. After the entire frame has been examined the routine, RESOLV, described in Section 3. 3, is used to resolve all points that have been marked as ambiguous.The effect of FUSER, then, is to determine which points in the final range map resulted from identifying surfaces of matches in d-space that do not cast oc-clusion shadows. These points are labeled as ambiguous and the routine RESOLV finds the surface that they occlude. Thus, an "illegal" surface is stripped away.
To transform from left viewpoint d-space to center viewpoint d-space, each d-plane Dn is shifted n/2 units to the left. To transform from right viewpoint d-space to center viewpoint each d-plane, Dn, is shifted n/2 units to the right. The alignment of d-planes for the different viewpoints is shown in Fig. 6.
Figure 26 is a schematic description of the entire process, starting with the viewed scene. The surface
S1
occludes parts of the background, B. In the d-space generated from a stereo pair of images of the scene, the surfaces S1 and B are ob-served. Additional spurious surfaces which do not cast occlusion shadows are also present. Neither of these spurious surfaces will be present in both the left and rightOCCLUDED REGIONS OF THE BACKGROUND
AL
BACKGROUND, B
OCCLUDING OBJECT, Sl
z
x
LEFT CAMERA VIEWNT
RI GHT CAMERA
Fig. 24 Scene containing an object, S1, in front of a background surface, B.
AR
dI
X
(a)dl
X
(b)d
x
(c)
Fig. 25 The same cross-section of d-space, but from different viewpoints.
(a) left viewpoint (b) center viewpoint (c) right viewpoint
B S1 z STEREO CAMERA t.X a) VISUAL SPACE STEREO SPURIOUS 71- 7 R SURFACES d B
b) d-space of the scene above
containing spurious surfaces
STEREO
STEREO
SPURIOUS
Si -
~
SURFACES j-7 B B~
left viewpoint d-space c) right viewpoint d-space
EXPER EXPER
Si
Si-B .-
B-d) d-spaces after EXPER has identified largest surfaces
of matches and resolved occlusion ambiguities
FUSER FUSER
e)
d-spaces shifted to central VIEWPOINT by FUSERB
S1
B
f)
Final d-space after FUSER has resolved conflicts. The spurious surfaces have been eliminated.Fig. 26 Elimination of spurious surfaces by occlusion shadow -checking.
viewpoint range map (See Fig. 26e), and they will be rejected. The final step(Fig. 26f)
shows a d-space in which the spurious surfaces have been eliminated, leaving the
de-sired surfaces that represent physical objects in space.
If the method described above (using FUSER to check for occlusion shadows)
is applied to the random-block stereo pair in Fig. 21, the range map in Fig. 27 is
produced.
Note that the errors observed in Fig. 22 have been eliminated.
Fig. 27 Range map produced by FUSER from stereo pair in Fig. 21. Er-rors have been eliminated.
CHAPTER 5
STEREO IMAGES OF NATURAL SCENES
Stereo images of a real scene may be obtained by digitizing photographs taken with a camera (the Stereo Realist, a commercially available 35 mm camera,' exposes two images simultaneously), or directly through a TV camera connected to a com-puter. The problems encountered by either method are similar, and no distinction between the two will be made. Figure 29 is a stereo pair of images of a simulated Mars scene. It was obtained by scanning the scene with the vidicon camera system
described in Appendix C. Each image consists of 256 x 256 points with 64 possible gray levels.
5.1
Noise
In order for an image to be encoded into an array of numbers suitable for computer processing, light levels must be measured and quantized. Noise is intro-duced into the image by shot noise in the light sensor and round-off error in the quantizer. For a high quality image encoding system, noise present in the recorded image usually cannot be detected by a human observer. It is there, however, and will cause difficulties for stereo processing.
The amount of noise in a digitized image may be measured by the following scheme:
(1) Two images of the same photograph or scene are recorded suc-cessively taking care to keep all parameters of the digitizing system constant.
(2) Corresponding points in the two digitized frames are subtracted to form a difference frame.
(3) A histogram of the entries in the difference frame will give the probability distribution of the noise in the images.
*Available from the David White Instrument Division, Realist Inc., Menomonee Falls, Wisconsin.